Modeling the Population-Environment Interaction A Geo-demographic Analysis of North-central Costa Rica to Support Biological Corridor Designation, Conservation Policy and Practice
Bạn đang xem bản rút gọn của tài liệu. Xem và tải ngay bản đầy đủ của tài liệu tại đây (1.18 MB, 26 trang )
Modeling the Population-Environment Interaction:
A Geo-demographic Analysis of North-central Costa Rica to Support Biological Corridor
Designation, Conservation Policy and Practice
Margaret V. Buck, M.S. Candidate
Land Resources Program
Gaylord Nelson Institute for Environmental Studies
University of Wisconsin-Madison
Stephen J. Ventura, Ph.D.
Professor, Environmental Studies and Soil Science
Director, Land Information and Computer Graphics Facility
University of Wisconsin-Madison
Abstract
This study seeks to incorporate a rich and diverse collection of demographic and socioeconomic
spatial datasets into an analysis of critical areas for conservation and in the designation of
biological corridors between existing protected areas in Costa Rica. Located to the north of the
greater San José metropolitan area, the largest urban population center in the country, the project
area encompasses five national parks (PN’s): PN Turrialba, PN Volcán Irazú, PN Braulio
Carrillo, PN Volcán Poás, and PN Juan Castro Blanco, (approximately 6,500 km² total).
Focusing on datasets from the year 2000, we have joined together data about human populations,
biophysical conditions, infrastructure, land tenure and other landscape factors as layers in a
geographic information system and produced a priority areas model based on a simple,
adjustable factor analysis. A selection of data variables were statistically evaluated using a
weight or ranking system and new spatial layers developed, based on the results of the factor
score of each variable. Areas on the landscape where the resulting ranks or weights of these
variables are clustered, we classified as locations in the study area where human population /
land-use pressure is most intense and demanding on the available natural resources. A similar
model was developed using biophysical and other landscape variables to identify areas where the
rate and intensity of natural resource depletion is most concentrated.
These two analyses were joined together in a single overlay model, and the result spatially
represents what we define as priority areas, or critical areas. While factor analysis models are
commonly used within a wide range of GIS applications and as decision-making tools in natural
resource management, demographic variables have rarely been included in the analysis.
Furthermore, when demographic data has been incorporated into these models, the coarseness of
the spatial information (often only to the ‘distrito’ or district level) has imposed a limit on the
potential analysis. With the assistance of public agencies in organizing their own data, it was
possible to develop models, which are more spatially explicit and representative of the human
presence on this landscape.
Our results present various models that differ based on adjustments made to the weighting of the
human population or biophysical factors. We conclude by presenting a series of proposed
biological corridors connecting the five protected areas. The comparison of this series of
proposed biological corridors is accompanied by a critical examination of the evolution of the
Mesoamerican Biological Corridor (MBC) and its lack of correlation with conservation targets
defined in the study region. We observe that conservation efforts need to be directed towards the
expansion of existing national parks in the study region in order to combat the increasing levels
of forest fragmentation and biodiversity loss. We conclude generally that the demographic
variables add to the integrity and specificity of the model and that adjustments made to the
weighting of the factors affects results in consistent and expected ways. The complete research
results are intended to be evaluated by conservation planners and managers, with the goal that
the models can continue to be improved upon and used to help inform future conservation
planning in the project area.
INTRODUCTION
The objective of this study is to identify areas within a set geographic region, which might be
key targets for the implementation of conservation management and policy. In conservation GIS
practice, this has developed into what is more commonly known as a critical areas analysis
(Hopkins, 1984). However, these types of conservation targeting exercises can result in the
development of policies which are potentially misguided and doomed to failure due to their
inabilities to adequately model the factors of land-use activities, human population dynamics,
and more locally-defined stakeholder presence.
Given the now dominant use of Geographic Information Systems (GIS) and related technologies
as tools in natural resource research and planning, and the recognition of the capacity of GIS to
inform and influence decision-making at a range of administrative levels, there is a clear impetus
to test methods for the integration and analysis of human population factors which might be
spatially enabled and modeled. The key assumption here is that the incorporation of these
factors will function to more adequately and accurately inform the results of GIS analysis, and
will therefore allow for more informed decision-making on the part of conservation
policymakers and managers.
Furthermore, in the specific context of Costa Rica, limited financial and personnel resources
within the principal natural resources administrative body, the Ministry of the Environment and
Energy (MINAE), have increased the need and utility of using GIS to target conservation
programs and practices.
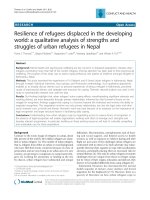
Study Area
The focus of this study is the area surrounding, connecting, and including five national parks: PN
Volcán Poás, PN Volcán Irazú, PN Braulio Carrillo, PN Turrialba, and PN Juan Castro Blanco.
The total area of interest measures approximately 6,500 km² (Figure 1).
The parks of this study region were selected due in large part to the following characteristics:
2
1. Spatial proximity to the metropolitan area of San Jose, the population center of the
country;
2. High level of biodiversity and endemism, particularly of plant species;
3. Relatively small area (only Braulio Carrillo is over 40,000 ha in size);
4. Abundance of geospatial information available from various institutions working in
region.
(Figure 2)
The national parks, (with the exception of Juan Castro Blanco), are located within the
Conservation Area of the Central Volcanic Cordillera (ACCVC). There are eleven Conservation
Areas in Costa Rica administrated by the National System of Conservation Areas (SINAC), a
main division within MINAE. In total, the ACCVC manages twenty-three separate protected
areas, covering approximately 1,400 km². As of the year 2000, the entire protected area system
of Costa Rica was comprised of 151 protected areas, classified into eight different management
categories (Figure 3).
These eight management categories can essentially be grouped according to two levels of
protection, outlined by Sterling Evans as the following:
“Type I is ‘strict’ protection (national parks, biological reserves, national
monuments, natural reserves, and wildlife refuges) with these objectives:
‘to preserve species and to reduce human intervention in environments and
ecological processes’…Type II includes forest reserves and protected
zones whose objective ‘partially to protect the biological diversity as they
are open to exploitation of resources under certain conditions’” (Evans,
1999).
Several researchers/conservationists have pointed to the need to increase the size of the protected
areas, especially those located within this study region. The argument has been that increasing
pressure from human activities, (mainly through deforestation), have caused fragmented forests,
as well as “conservation islands” (Sanchez-Azofeifa et al, 2003).
In national studies of biodiversity conservation, it has been recommended that the country
implement efforts to increase the area and consolidate its network of strictly protected areas
(INBIO, 2002). A report from the project GRUAS in 1996, recommended that the national parks
and biological reserves in the system should be increased to cover approximately 19.5% of the
national territory. Today, this percentage remains at 12.5% (CONARE, 2002).
The high level of plant endemism observed in this study region is a strong indicator of its overall
significance to the biological richness of Costa Rica, (with a biodiversity level at ~ 5% of the
global total). In fact, one of the four areas of endemism classified within the country is located
within this study region: the high uplands of the central volcanic cordillera (INBio, 2002). These
characteristics lend increased impetus to the need for stricter management and conservation of
the region’s forest and water resources. Furthermore, the proximity of this study region to the
population center of the country points to a need for more research into the interaction between
areas of high biodiversity significance and human population development and land-use
activities.
3
Previously, this study region has been integrated into several GIS analyses primarily focused on
deforestation rates, as well as on identifying the relationship between population growth and
deforestation. As Sader and Joyce concluded in their national study of deforestation between
1940 and 1983, only 17% of the original natural forest cover remained in the mid-1980’s (Sader
& Joyce, 1988). It is the claim that in the 1970’s alone; the rate of deforestation was at 1% of
Costa Rican territory (or 511 km² per year – 1.4 km² daily) (Palloni and Rosero-Bixby, 1999). In
their CDE working paper on “Population and Deforestation in Costa Rica”, Palloni and RoseroBixby acknowledge the parallelism between population growth and increased deforestation rates
when they state that, “The most commonly mentioned causal link between these two processes is
the demographic pressure on land combined with public policies favoring settlement in public
lands to avoid land reform and to take away population pressure” (Palloni and Rosero-Bixby,
1999). However, they also emphasize that the parallel, however strong and connected, is not the
singular cause of deforestation, nor is it defined in any simple terms. Palloni further alludes to
the concept that population growth ought not to be equated directly with deforestation levels
when he states: “Population pressure is neither a necessary nor a sufficient condition for
deforestation to occur; population growth only matters if it occurs in conjunction with land
inequality. Instead, distorted titling legal codes and policies lead to deforestation even in the
absence of population pressures of any sort” (Palloni, 1994). These conclusions support the
overall concept of this study: that it is necessary to analyze the interaction of variables focusing
on demographic and socioeconomic trends in a region as well as land-use activity and landholdings in order to more adequately assess the relative impact of the human population presence
on the forest resources of the area. By bringing this analysis into the toolbox of a geographic
information system (GIS), we hope to provide a methodological framework which is both sound,
adaptable, and malleable to incorporate other inputs and scales.
METHODS
As stated previously, the objective of this study is to identify key targets for the implementation
of conservation programs and practices using GIS to model the biophysical, human population,
and land-use factors interacting in the region. In order to do this, we divided the analysis into
three separate phases.
First, we analyzed spatial data available primarily on biophysical and land-use factors in what is
known as a spatial multicriteria decision-making assessment, or “weighting and ranking”
schema. This enabled us to define areas of significance related to biodiversity, ecosystem
representation, land cover change, and pressure associated with land-use activities. Although
this method has become more widely implemented in this type of analysis, for its relative ease of
use and ability to introduce a socioeconomic and/or human population presence into
conservation GIS analysis, we questioned its potential in adequately representing the wealth of
demographic variables available for human population analysis, as are readily available in the
National Census.
Therefore, we introduced an intermediate phase into this study where factors assessed in the first
phase are modeled relative to the finest scale of publicly available political/administrative
4
divisions in Costa Rica, the district (distrito). We focused this part of the analysis on data
available from the past two census years, 1984 and 2000. Land cover data from 1986 and 2000,
permitted a comparable assessment of changes in the biophysical setting over time. This phase
of the analysis sought to identify key groups of districts where conservation policy and
implementation might be targeted at a more local administrative level.
Finally, given the results from the first part of the analysis, we compare the targeting of critical
areas for conservation with the series of proposed biological corridors, as related to the larger
regional project known as the Mesoamerican Biological Corridor (MBC). As the MBC has
evolved in scope and objectives over the past several years, so has criticism of it from the
conservation scientist community. We examine the changing spatial definition of the MBC
corridor designations, and offer a comparison with the key target areas, as identified in the earlier
stages of our analysis.
Geospatial Datasets used in GIS Analysis
It is important to note that an underlying objective in this study has been to develop an analysis
with a methodology which would remain flexible as well as easily repeatable in future studies.
For this reason, a vast majority of datasets used in this analysis were produced by Costa Rican
national governmental and educational institutions, and were selected for their accessibility and
wide availability, as well as for their relative precision and integrity. Acknowledgements to those
institutions who contributed datasets are made at the end of this paper.
Additionally, we selected methods of GIS analysis that require a relatively minimum level of
hardware and software sophistication. For our part, all analysis was performed on a Pentium III
machine, with 512 MB RAM, and less than 20 GB of hard drive space. The software package
we used was Environmental Systems Research Institute’s (ESRI) ArcView 3.2, with Spatial
Analyst v.1.1. We mention these hardware and software specifications because we feel that they
are closely similar to those found in the offices of MINAE (as well as other governmental
ministries), and our aim is to document a type of analysis that could easily be performed by the
GIS analysts in these offices.
A list of geospatial datasets included in each phase of the analysis can be viewed in Appendix I.
Phase I – Spatial Multicriteria Decision-Making Assessment
As Jacek Malczewski notes in the introduction of a chapter entitled “Spatial Multicriteria
Decision Analysis”:
“Decision analysis is a set of systematic procedures for analyzing complex
decision problems. The basic strategy is to divide the decision problem
into small, understandable parts; analyze each part; and integrate the parts
in a logical manner to produce a meaningful solution” (Malczewski in
Thill, 1999).
5
For the purposes of this phase of GIS analysis, we follow what Malczewski describes as spatial
multiattribute decision-making, or MADM (Thill, 1999). In this case, each dataset can be
defined as a decision variable, in relation to the decision of identifying conservation targets, or
critical areas. Datasets are described by both their spatial location and their attribute data. These
attribute data become redefined relative to their criterion in the decision analysis. Once each
dataset, or layer, has been defined in terms of its criterion, both spatially and by attribute data,
the resulting layers are overlaid to produce a combined result of multicriteria assessment.
To place this in the context of weighting and ranking, the attributes (and occasionally the spatial
location) of each data layer are assigned values which define the relative connection to
identifying whether a spatial location is to be targeted for conservation programs and practices.
These values may vary within data layers, according to differing attributes. Once all the data
layers have been assessed and valued individually, they are combined in an additive way to
produce a resulting assessment, as informed by these multicriteria. When the individual data
layers are combined, they may either be assigned equal importance in the resulting decision set,
or they may be assigned various ranks. Thus the resulting decision set can be varied based on the
values assigned to criteria within each data layer, as well as values assigned between data layers.
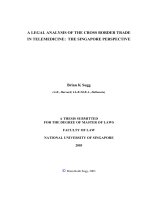
In our particular analysis, we used the datasets listed in Appendix I as our set of layers. These
we divided into separate categories so as to create two composite layers for the ultimate decision
set. These two categories could best be defined as: biophysical/biodiversity significance and
adverse land-use (Figure 4). All layers were assigned values based on their attributes and then
converted to grids. We chose a minimum grid cell size of two hectares, or approximately 141.42
m². According to the Costa Rican Forest Law passed in 1996, the minimum size of a forest patch
is no less than two hectares, with seventy trees measuring > 30cm diameter at breast height (Ley
Forestal, 1996). Since forest dominates as a key natural resource of this study region, and
decreases in forest cover are so closely correlated with biodiversity loss, we found this to be an
appropriate cell size for the dataset grids.
Initially, we generated binary grids for each data layer, with equal weighting for each attribute.
This produced a series of grids which represent the presence or absence of a particular criterion
on the landscape. For the biophysical/biodiversity composite layers were defined and combined
to represent spatial locations of increased biodiversity significance. This decision subset could
also be defined as areas in need of strict protection under the management of MINAE. A final
adverse land-use composite was created as a representation of areas where land-use activities and
impact are negatively affecting the potential for forest cover regeneration.
The intersections of these composite analyses enabled the identification of key areas for the
targeting of conservation programs and practices. Analytical confidence is highest when
examining the resulting decision set of simple binary overlays, where all criteria and datasets
were weighed and ranked equally.
Through close reference to similar studies by Leclerc and Rodriguez (1998) and Maas (2002),
we repeated the composite grid analysis through weighting the variables within each dataset,
where applicable. The resulting decision set was then compared empirically with the un-biased
result.
6
Phase I(b) – Integration of Datasets to District Level
The district, or distrito, administrative division in Costa Rica is the finest level to which the
national census data is made publicly available. With just over sixty districts distributed entirely
within the study region, we hypothesized that through normalizing the various datasets to the
district level and setting that as the minimum level of analysis, the resulting observations would
better inform the definition of conservation targets; or, more appropriately, associating key
conservation target regions with administrative areas where there is a wealth of demographic
variables available through the national census would provide the tools for decision-makers to
effect more comprehensive conservation programs.
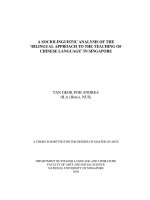
Here we will note that the Central American Population Center graciously offered their dataset of
census segment center points for the study region. A Thiessen polygon map layer was generated
from these census segment centroids and used in Phase I of this analysis, as a variable in the
“Adverse Land-Use Composite” to represent estimated population density distribution. Thiessen
polygons are calculated based on a method known as the Dirichlet tessellation, which subdivides
a planar surface into areas based around proximate center points. This method has been
frequently used in the analysis of fine-scale census data in many countries throughout the world,
and is generally regarded as the most viable option for producing a polygon surface for this type
of application in the absence of actual census segment delineations (Martin, 1996). It is our
estimation that this layer more accurately represents the population distribution in this area than
the populated areas point coverage more widely available for use and derived from the 1:50,000scale topographic maps. The Thiessen polygon layer and density distribution can be viewed in
Figure 5.
Phase II – Comparison with Mesoamerican Biological Corridor Proposed Designations
As the Mesoamerican Biological Corridor project has evolved in meaning and scope over time,
as have the proposed designations of biological corridors in Costa Rica. These changes can be
assessed both spatially and contextually. The most recent series of proposed biological corridors
is managed and mapped by SINAC/MINAE, under the plan of each Conservation Area. In this
final phase of the GIS analysis, we performed an overlay of three different sets of corridor
designations, (Proyecto GRUAS, PROARCA, and current MBC), with our resulting analyses of
conservation targets in the study region to assess their spatial correlation.
RESULTS / DISCUSSION
7
Phase I – Spatial Multicriteria Decision-Making Assessment
For this phase we produced decision sets based on the two composites of biodiversity and
adverse effects. Within the first set of decision set results, our intent was to produce a
multicriteria assessment which provided equal weighting to all variables, (within and between
layers). A more elegant result was produced when weights were factored in the analysis,
particularly where it was possible to rank such layers as the road types, population counts, and
ecosystem representation.
We initially performed an assessment of land use, forest cover loss and fragmentation using
Landsat TM images from both 1986 and 2000, which had originally been classified by
FUNDECOR and CATIE. This allowed us to derive the spatial distribution of cultivated land for
2000 to be used in the adverse effect composite. We calculated the amount of natural forest area
lost between 1986 and 2000 as well as the level of forest fragmentation within the area (Figure
7). In their analysis of deforestation in Costa Rica between 1986-1991, Sanchez-Azofeifa,
Harriss, and Skole demonstrated that at a national level, both deforestation and fragmentation
had increased over time (although it has been demonstrated that the rate of deforestation has
slowed since the late 1980’s) (Sanchez-Azofeifa et al, 2001). Using methods similar to theirs,
we evaluated the relative change in the study region between 1986 and 2000.
The comparison was made only for areas which were classified as having natural forest cover in
1986. Therefore, we do not consider areas which may not have been classified as natural forest
in 1986, but we classified as such in the image from 2000. Additionally, all forest areas which
were less than two hectares, (the minimum mapping unit), were deleted as were areas classified
as cloud cover in the 2000 image. It is extremely difficult to capture a cloud-free satellite image
within the region and therefore there was no other option for this present study but to include this
particular image classification. Therefore, it is possible that the total forest area for 2000, as
calculated in the table in Figure 7, may be less than the actual forest cover. However, it was our
assessment that this omission would not alter the overall conclusion in the table that
deforestation and fragmentation trends continued to increase between 1986 and 2000. The
deforestation rate of natural forest cover in the study region was calculated at approximately 40
km² per year.
Natural forest cover loss between 1986 and 2000 was then compared with the ecosystems
identified in the region, as defined by the recently released Central American regional ecosystem
map (Vreugdenhil et al, 2002). Figure 8 displays both a map of the natural forest cover change
between 1986 and 2000 in the study region, as well as the natural forest cover loss during that
time period overlaid with the ecosystems of the area. The ecosystem type which experienced the
greatest amount of natural forest cover loss for this time period is classified as “Bosque denso
latifoliado siempre verde nuboso montaño y altimontaño”, according to the ecosystem map
classification scheme. Only 37% of this ecosystem type is currently under strict protection
within the greater study region.
The biodiversity composite was compiled and simplified by combining the natural forest cover
as identified for the year 2000 with the sites of endemic plant species, as published by the
8
National Biodiversity Institute (INBio). Other factors eventually integrated into the analysis
included slope and aspect, as derived from a digital elevation model of the study region.
The adverse land-use composite contained the more complex array of factors and weights, as
layers representing similar land-use were incorporated from various data sources. The most
complicated of these was the representation of land under cultivation. The assumption was that
any land under cultivation is posing a negative impact on biodiversity level in the area. In this
analysis, the following geospatial datasets were considered to represent areas of cultivated land:
coffee plantation locations, export plant plantations, Agrarian Development Institute (IDA) land
settlements, and patches defined as cultivated land by the 2000 land cover/land-use
classification. In order to avoid double counting these areas within the final composite, we
eliminated all land cover/land-use classifications of cultivated areas which were located within
IDA settlements. These combined layers were then weighted equally to represent cultivated
regions within the study area.
The adverse land-use composite was assembled from the various layers using a simple additive
method. It was then classified into three levels of pressure or threat: low, medium, and high.
Low was defined as area where only one factor of adverse land-use is in place. Medium
represents areas where at least two factors are at play, and high represents as many as three or
more factors. Once these two composites were combined and assessed, the conservation target
areas were identified as areas where medium-high levels of adverse land-use intersected with
areas of biodiversity significance (Figure 9). The target areas identified in Figure 9 can be
interpreted as regions which would require more in-depth surveys of land tenure, demographic,
and socioeconomic characteristics in order to develop more sound conservation policy and
practice. Such regions may present key opportunities for corridor designations, as currently
defined under the Mesoamerican Biological Corridor. Regions outside of these target areas,
where adverse land-use is not at a high level, which remain within a buffer distance of the
national parks could be areas considered for the expansion of the existing national parks.
We also note that special attention should be made to the target areas defined within the existing
national parks in the study region. While these areas are technically under the “strict protection”
management category, there is evidence that land-use and deforestation still takes place within
park boundaries, as supported by the fact that a percentage of the land designated as national
park in this study region still remains in private hands. According to a 1999 study by MINAE, of
all the protected areas, (all management categories), within the Central Volcanic Cordillera
Conservation Area, less than 3% of that total protected area was in public landholding (SINACMINAE, 1999). The 2002 state of the nation report indicated that 11% of all national park land
in Costa Rica remains as private property. Furthermore, the report noted that the government
would require approximately $54.7 million USD to purchase that property (Estado de la Nación,
2002).
While we performed several iterations within this phase of the analysis, it became quite evident
that the possibilities for adjustments in weights and ranking would not be exhausted within the
scope of this study. Furthermore, the utility of the model clearly increases with the addition of
each new dataset, provided the data are of a comparable scale and attribute quality. In terms of
the specific datasets analyzed in this phase, it would be beneficial if all point data layers were to
9
be integrated instead as polygon layers, should this information become available. Some may
argue that the analysis should be limited to one vector data type, in the situation where similar
variables, (such as land-use activity), are being assessed. Our analysis allowed for differing
dataset types, (point and polygon), to be integrated into the same composite and representing the
same category of land-use pressure. This was done in the interest of providing as many variables
as possible given data availability.
Although we were able to test several iterations of weights and ranking for these composites and
the resulting decision set, the weight/ranking schema were informed by an individual, (along
with comparison with previous studies), rather than an expert or stakeholder group. A future
study might focus on an expert/stakeholder team approach to assessing the criteria, and then
provide a comparison with a study such as this which was individually-driven.
Phase I(b) - Integration of Datasets to District Level
While sixty-four districts are located entirely within this region of study, the conservation targets
identified in Phase I intersect with twenty-four of them. A map series was generated within the
detailed results set which represent various demographic and socioeconomic variables distributed
by district within the study region, for both census years of 1984 and 2000. Although the results
of this subset analysis of Phase I are not presented in detail within the context of this paper, the
full results set may be consulted in the final thesis publication (Buck, 2004). Given the
availability of variables at this district level, as well as the ability to target environmental
services programs and incentives to administrative districts, we present the framework of the
multicriteria decision-making and assessment model as a tool which can produced integrated
results for both biodiversity and human population/sustainable development analysis that are
scalable and can be generalized to spatial units more easily interpreted by decision-makers
focused on development and resource allocation within their administrative regions.
Phase II – Comparison with Mesoamerican Biological Corridor Proposed Designations
Background of the MBC:
The original roots of the Mesoamerican Biological Corridor project were initiated with a project
known as Paseo Pantera. In 1990, the Wildlife Conservation Society (WCS), in conjunction with
the Caribbean Conservation Corporation (CCC), began working together to promote the concept
of developing wildlife corridors throughout Central America, linking existing protected areas in
order to allow for freer movement of keystone species, such as the Florida panther. The concept
was first proposed by Archie (Chuck) F. Carr III of the WCS, who also coined the project name
of Paseo Pantera – or – Path of the Panther. The theory behind Paseo Pantera was based
primarily in ecological thought: that if it was possible to choose certain indicator species in a
region (often large migrating mammals), and develop corridors for those species, taking into
account their natural histories and movement patterns, then other species would also incorporate
into the use of these corridors, and eventually a restoration of biodiversity levels might be
accomplished. The US Agency for International Development (USAID) granted funding to both
WCS and CCC in that same year, to place towards a five year pilot project of Paseo Pantera. The
10
relative success in the efforts of those involved in Paseo Pantera, revealed itself in late 1994,
when the governments of Central America signed a treaty for the creation of the biological
corridor.
At the end of the project period in 1995, USAID put out a round of grants for bidding on the
Paseo Pantera project, and in quite a shock to the Wildlife Conservation Society and the
Caribbean Conservation Corporation, the grants were awarded instead to PROARCA (Programa
Ambiental Regional para Centroamerica – Regional Environmental Program for Central
America), in conjunction with the Nature Conservancy, the World Wildlife Fund, and the
University of Rhode Island. The project name was then changed to its current name of the
Mesoamerican Biological Corridor.
In an evaluation report, entitled “Defining Common Ground for the Mesoamerican Biological
Corridor” and published in October of 2001, the World Resources Institute (WRI) defines the
Mesoamerican Biological Corridor as having three specific aims:
Protect key biodiversity sites
Connect these sites with corridors managed in such a way as to enable the movement
and dispersal of animals and plants
Promote forms of social and economic development in and around these areas that
conserve biodiversity while being socially equitable and culturally sensitive.
(WRI, 2001).
This final objective is what most clearly separates the MBC from the Paseo Pantera work. While
the theory behind the Paseo Pantera project was based more strictly in ecological thinking, the
objectives set out by the MBC have incorporated a development component that did not
previously exist. WRI’s report explains that the Mesoamerican Biological Corridor involves a
social and economic development aspect due to prior concerns expressed by local groups over
the perceived goals of Paseo Pantera:
“The Paseo Pantera project proposal, which was defined mostly in terms of biological
outcomes, worried many local residents, especially indigenous groups, who feared
expropriation of their ancestral lands and the expansion of protected areas onto their
territory. The broadening of the MBC’s scope to incorporate socioeconomic goals was in
part a response to these fears” (WRI, 2001).
Conservationists, however, are skeptical and critical that by drawing in socioeconomic
development goals, the MBC programs are attempting to address problems which are beyond
their capabilities to solve, and in turn, sacrificing progress what could be made for conservation
in the name of political correctness.
The proponents of the Mesoamerican Biological Corridor program, however, say that it
exemplifies what is known as the “bioregional” approach, where land-management plans are
intended to develop strategies which “encompass entire ecosystems or bioregions, aiming to
protect and restore them so they can simultaneously conserve biodiversity and sustain farming,
forestry, fisheries, and other human uses” (WRI, 2001).
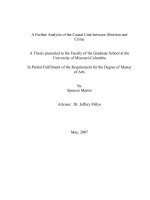
As noted in the background above, he Mesoamerican Biological Corridor concept and plan has
evolved dramatically over the past decade, as is reflected to some extent in the spatial
distribution of proposed corridor designations in various phases of the project. Three of these
11
phases were outlined in Figure 6 of this paper, and are overlaid with the resulting weighted
decision set of conservation targets in Figure 10.
Analysis Results:
The results of this simple overlay procedure reveal that the current proposed areas of the
Mesoamerican Biological Corridor have minimal representation in the study region.
Furthermore, there is significant change between the three phases, indicating changes in
direction, administration, and definition of the biological corridor proposals.
While the other two maintain a regional Central American context, Proyecto GRUAS was a plan
developed within Costa Rica, with the main objective of restructuring and expanding the existing
protected areas system to ensure the preservation of at least 90% of the country’s biodiversity
(SINAC-MINAE, 1996). The proposed designations of Proyecto GRUAS, as observed in
Figures 6 and 10, indicate the regions between the existing national parks where the proposal
hoped to provide connectivity between and expansion of the existing system.
The second phase, as labeled “PROARCA/CAPAS” in both figures, has in fact been published
by various sources, and is often accompanied by the disclaimer that it was merely a working
version of the Mesoamerican Biological Corridor project, as envisioned in 2000. Within this
conceptual map, we can observe that nearly the entire area outside of the national parks in this
study region was considered as potential area for a corridor designation.
The current version of the Mesoamerican Biological Corridor proposed corridor areas was
obtained from the offices of SINAC-MINAE, where each Conservation Area has taken on the
responsibility of identifying corridor regions to be located within each area. As can be clearly
observed in Figures 6 and 10, very little of the study region is assigned to a corridor designation,
presenting a drastic difference from both the Proyecto GRUAS and PROARCA/CAPAS
proposals.
CONCLUSION
While this study has presented only a subset of the potential complexity of a multicriteria
decision-making assessment and analysis, we conclude that this analytical tool, while allowing
for the integration of across-discipline variables, also creates a series of results which can be both
adapted to the context of administrative/political boundaries, as well as compared with current
conservation program target regions, such as the Mesoamerican Biological Corridor project.
Despite MINAE’s identified objective of purchasing more private land holdings within existing
protected areas in the study region, the Mesoamerican Biological Corridor continues to dominate
the sources of international funding, making it very difficult for national conservation agencies
and institutions to embark on conservation projects, without them being directly related to the
MBC.
Although still in its early stages of development, it is hard to ignore the extent to which the
Mesoamerican Biological Corridor has entered the vocabulary of conservationist and
12
development-related entities throughout the region. The name itself is attached to so many
environmental and sustainable development projects in each country that it is hard to say whether
or not the name represents an institution or program, or whether it represents a concept for
promoting conservation. However, the amount of money invested in the work since 1995 has
been so significant that one wonders why the Mesoamerican Biological Corridor is so difficult to
define.
Criticism continues to question whether the objectives of the MBC are too broad for its overall
work to be effective in any one area, especially that of conservation. Jim Barborak, when asked
recently to publicly comment on the MBC study published by the World Resources Institute, said
the following regarding the broadened scope of the MBC:
“We conservationists must certainly re-double our efforts to encourage increased national
investment and donor community action in order to attack the problems of health, land
tenure, credit, education, agricultural and forest production which afflict these marginal
areas – but not with our own scarce resources and personnel. There are other institutions
which have the responsibility and institutional capacity to attack these problems. To
reorient a high percentage of the limited available funds for biodiversity conservation
towards activities which aren’t the most significant in the short term to accomplish this
end will neither resolve the problems of poverty nor the problems of biodiversity
conservation” (as translated from Barborak, 2001).
This sentiment was echoed in the recent Mesoamerican Protected Areas Congress held in
Managua in March of 2003, (a precursor to the World Parks Congress held this past September).
The debate took place primarily between a conservation scientist community and the proponents
of the current Mesoamerican Biological Corridor. The conservationist community posed the
question: “Where has the biology gone in the Mesoamerican Biological Corridor?”. The MBC
community response was that consideration of the human population constitutes an important
part of the biology in the MBC.
While the purpose of our study has been neither to refute nor support either side of this debate,
we do acknowledge that the changing geospatial definition of the Mesoamerican Biological
Corridor has resulted in an apparent de-prioritization of this north-central region located within
the study area. Current MBC literature indicates that the three priority regions for Costa Rica are
located in the trans-boundary regions with Nicaragua and Panama (CCAD, 2002).
We also conclude that the establishment of biological corridors within this study region would
not satisfy the conservation targets and needs as identified, especially given the current lack of a
sound legal definition for the MBC within the context of Costa Rican law, (at this point in time
the authors are only aware of the development of a property tax incentive program for areas
formally placed in the MBC). Rather, there is strong indication that conservation in this study
region needs to be focused on the expansion of existing protected areas under strict
protection/management in order to combat the increasing level of forest cover fragmentation and
related biodiversity loss.
However, given the financial and personnel resources of the Mesoamerican Biological Corridor
program, as well as a strong presence within the programs of SINAC-MINAE and other
conservation institutions in Costa Rica and internationally, the opportunity exists for further
13
surveying and conservation targeting exercises to be implemented in regions throughout the
country. Such targeting exercises would allow for MINAE to more appropriately direct its
limited funds for the purchase of park in-holdings, increased management, and the eventual
expansion of existing national parks and biological reserves.
To this end, in the creation of a program for the identification of conservation targets, we
advocate the use of GIS and multicriteria decision-making and assessment models in the context
of national, regional and local analyses. As presented within this study, the proposed model
follows a simple and elegant framework, while complexity and quality generally increase with
addition of variables as data layers, as well as with the informed decisions of groups as opposed
to individuals. The current availability of new data sources, most notably of a national dataset of
high-resolution aerial photography and MASTER imagery produced by the CARTA Mission in
2003, will allow for national institutions to produce analyses across a broad range of scales.
Finally, the capacity of these models to adequately represent the interaction of socioeconomic
and demographic variables within the landscape is dependent upon the increased involvement of
the social science community. While general population prosperity and sustainable development
are a prominent consideration in the MBC and related programs, the actual modeling and
surveying of these objectives as related to conservation objectives remains nebulous. Given the
availability of scalable data, the malleable framework of the multicriteria decision-making
assessment model as used within a GIS allows for the rapid integration of these variables.
Without the collaboration of social scientists in the context of this analysis, the results will
remain too limited in their ability to be adapted into conservation management in this landscape
dominated by a web of human and natural resource interaction.
Acknowledgements
The authors would like to acknowledge the support of the Central American Small Grants
Program through the UCLA School of Public Health in providing funding for the research
portion of this study. We are grateful to the many Costa Rican institutions that cooperated in this
project, including the Centro Centroamericano de Población at UCR, Instituto Nacional de
Estadísticas y Censos (INEC), SINAC-MINAE, and the Ministerio de Agricultura y Ganadería
(MAG). Additional thanks to FUNDECOR and INBio for providing data related directly to the
study. Individual thanks to: Dr. Luis Rosero-Bixby (CCP), Roger Bonilla (CCP), Roger Moraga
(INEC), Allan Ramirez (INEC), Rodolfo Mendez (MAG), Francisco Gonzalez (SINACMINAE), Damaris Garita (SINAC-MINAE), Johnny Rodriguez (FUNDECOR), Marco Castro
(INBio), and Marta Aguilar (IGN).
14
Literature Cited
Barborak, James. 2001. En Busca de un Enfoque Común para el Corredor Biológico
Mesoamericano: Reflexiones de un Conservacionista. Mesoamerican and Caribbean
Program, Wildlife Conservation Society, Gainesville, Florida.
Buck, Margaret. 2004. Modeling the Population-Environment Interaction: A Geo-demographic
Analysis of North-central Costa Rica to Support Biological Corridor Designation,
Conservation Policy and Practice, M.Sc. Thesis, Land Resources Program, University of
Wisconsin-Madison, Madison, Wisconsin.
CCAD and MINAE. 2002. El Corredor Biológico Mesoamericano: Costa Rica, Serie Técnica 03.
Proyecto Para La Consolidación del Corredor Biológico Mesoamericano, Managua,
Nicaragua.
Evans, Sterling. 1999. The Green Republic: a conservation history of Costa Rica. University of
Texas Press, Austin, Texas.
Hopkins, L.D. 1984. Evaluation and Methods for Exploring IllDefined Problems. Environment
and Planning B: Planning and Design, 11:339348.
Leclerc, G. and J. Rodriguez-Chacón. 1998. Using a GIS to Determine Critical Areas in the
Central Volcanic Cordillera Conservation Area. In Savitsky and Lacher (Eds.). GIS
Methodologies for Developing Conservation Strategies: Tropical Forest Recovery and
Wildlife Management in Costa Rica. Columbia University Press, New York, NY.
Ley Forestal No. 7575. 1996. Gobierno de la República de Costa Rica, San José, Costa Rica.
Martin, David. 1996. Geographic Information Systems: socioeconomic applications, 2 nd edition.
Routledge, London, England.
Mass, Raul. 2003. Presentation in plenary session on Protected Areas Management at First
Mesoamerican Protected Areas Congress. Managua, Nicaragua.
Malczewski, Jacek. 1999. Spatial Multicriteria Decision Analysis. In Thill (Ed.). Spatial
Multicriteria Decision Making and Analysis: A geographic information sciences
approach, pp.11-48, Ashgate Publishing Ltd, Hants, England.
Obando Acuña, Vilma. 2002. Biodiversidad en Costa Rica: Estado del conocimiento y gestión.
Instituto Nacional de Biodiversidad, INBio, Santo Domingo de Heredia, Costa Rica.
CONARE, Programa Estado de la Nación. 2002. VIII Informe del Estado de la Nación. Pavas,
San José, Costa Rica (as available on-line: ).
Palloni, Alberto. 1994. The Relation Between Population and Deforestation: Methods for
Drawing Causal Inferences from Macro and Micro Studies. In Arizpe, Stone, and Major
15
(Eds.). Population and Environment: Rethinking the Debate. Westview Press, Boulder,
Colorado.
Palloni, Alberto and Luis Rosero-Bixby. 1999. Population and Deforestation in Costa Rica,
Center for Demography and Ecology, CDE Working Paper No.96-19, University of
Wisconsin-Madison, Madison, Wisconsin.
Sader, S.A., and A.T. Joyce. 1988. Deforestation Rates and Trends in Costa Rica, 1940 to 1983.
Biotropica. 20(1): 11-19.
Sánchez-Azofeifa, G.A., R.C. Raíz, and D.L. Skole. 2001. Deforestation in Costa Rica: A
Quantitative Analysis Using Remote Sensing Imagery. Biotropica. 33(3): 378-384.
Sánchez-Azofeifa, G.A., G.C. Daily, A.S. Pfaff, and C. Busch. 2003. Integrity and isolation of
Costa Rica’s national parks and biological reserves: examining the dynamics of landcover change. Biological Conservation. 109(2003): 123-135.
SINAC-MINAE, and Randall Garcia. 1996. Propuesta Técnica de Ordenamiento Territorial con
fines de conservación de biodiversidad: Proyecto GRUAS. Informe de Ps: Costa Rica,
Proyecto Corredor Biológico Mesoamericano. CCAD/PNUD/GEF. RLA/95/G41. San
José, Costa Rica.
SINAC-MINAE. 1999. Tenencia de la tierra en las áreas silvestre protegidas de Costa Rica, San
José, Costa Rica.
SINAC-MINAE. 2003. Informe Nacional sobre el Sistema de Áreas Silvestres Protegidas.
Gerencia de Áreas Silvestres Protegidas, Sistema Nacional de Áreas de Conservación,
Ministerio del Ambiente y Energía, San José, Costa Rica.
Vreugdenhil, Daan, Jan Meerman, Alain Meyrat, Luis Diego Gómez, and Douglas J. Graham.
2002. Map of the Ecosystems of Central America: Final Report. World Bank,
Washington, D.C.
World Resources Institute, Kenton Miller, Elsa Chang and Nels Johnson. 2001. Defining
Common Ground for the Mesoamerican Biological Corridor, Washington, D.C..
16
Figure 1. Study Region. Source: SINAC, INEC 2000.
Name
Braulio Carrillo
Volcán Poas
Volcán Irazú
Turrialba
Juan Castro Blanco
Area (hectares)
47,583
6,506
2,000
1,256
14,453
Year declared
1978
1971
1955
1955
1998
Figure 2. National Parks of Study Region, (SINAC 2000).
17
Management Category
National Parks
Biological Reserves
Natural Reserves
National Monuments
Protected Zones
Forest Reserves
National Wildlife Refuges
Wetlands
Total
# Protected Areas
25
8
2
1
31
11
50
23
151
Figure 3. Protected Areas of Costa Rica, (SINAC 2000).
18
Total Area (hectares)
567,941
21,648
1,420
232
157,094
282,660
175,466
84,678
1,291,139
Figure 4. Phase I Analysis Decision Diagram
19
Figure 5. Population Density, Thiessen Polygon Distribution. Original Data Source: CCP, 2002.
20
Figure 6. Evolution of MBC in Study Region. Sources as indicated: PROARCA (2000) and SINAC/MINAE
(1996 and 2003).
21
Class
range
(km²)
# of
Total
fragments forest
1986
area 1986
(km²)
0.02 – 0.1
226
10.75
0.1 – 0.5
128
27.64
0.5 – 1.0
27
19.15
1.0 – 5.0
16
35.97
≥ 5.0
4
1,652.38
Total
401
1745.89
# of
Total
fragments forest
2000
area 2000
(km²)
299
14.67
154
33.67
23
15.07
26
48.33
9
1,077.69
511
1189.43
Change in #
of fragments
(2000 - 1986)
73
26
-4
10
5
110
Change in
total forest
area (km²)
(2000 – 1986)
3.92
6.03
-4.08
12.36
-574.69
-556.46
Figure 7. Change in natural forest cover between 1986-2000 as function of fragment size. Source: Forest
cover data: FUNDECOR, 2000.
22
Figure 8. Forest Cover Change and Loss by Ecosystem.
23
Figure 9. Medium/High Adverse Effect and Overlap of Medium/High Adverse Effect with High Biodiversity
Significance
24
Figure 10. Series of Proposed Biological Corridors and Overlay with Conservation Targets.
25