Alignment Measurements of the Microwave Anisotropy Probe (MAP) Instrument in a ThermalVacuum Chamber using Photogrammetry
Bạn đang xem bản rút gọn của tài liệu. Xem và tải ngay bản đầy đủ của tài liệu tại đây (752.94 KB, 12 trang )
Alignment Measurements of the Microwave Anisotropy Probe (MAP)
Instrument in a Thermal/Vacuum Chamber using Photogrammetry
Michael D. Hill *a, Acey A. Herrera b, J. Allen Crane b, Edward A. Packard a, Carlos Aviado c,
Henry P. Sampler a
a
Goddard Space Flight Center, Greenbelt, MD
b
Swales Aerospace, Inc., Beltsville, MD
c
ManTech, Greenbelt, MD
ABSTRACT
The Microwave Anisotropy Probe (MAP) Observatory, scheduled for a late 2000 launch, is designed to
measure temperature fluctuations (anisotropy) and produce a high sensitivity and high spatial resolution (<
0.3° at 90 GHz.) map of the cosmic microwave background (CMB) radiation over the entire sky between
22 and 90 GHz. MAP utilizes back-to-back Gregorian telescopes to focus the microwave signals into 10
differential microwave receivers, via 20 feed horns. Proper alignment of the telescope reflectors and the
feed horns at the operating temperature of 90 K is a critical element to ensure mission success.
We describe the hardware and methods used to validate the displacement/deformation predictions of the
reflectors and the microwave feed horns during thermal/vacuum testing of the reflectors and the microwave
instrument. The smallest deformations to be resolved by the measurement system were on the order of +
0.030 inches (0.762 mm).
Performance of these alignment measurements inside a thermal/vacuum chamber with conventional
alignment equipment posed several limitations. A photogrammetry (PG) system was chosen to perform the
measurements since it is a non-contact measurement system, the measurements can be made relatively
quickly and accurately, and the photogrammetric camera can be operated remotely.
The hardware and methods developed to perform the MAP alignment measurements using PG proved to be
highly successful. The PG measurements met the desired requirements, enabling the desired deformations
to be measured and even resolved to an order of magnitude smaller than the imposed requirements. Viable
data were provided to the MAP Project for a full analysis of the on-orbit performance of the Instrument's
microwave system.
KEY WORDS: MAP, photogrammetry, thermal/vacuum, alignment
1.0 INTRODUCTION
The Microwave Anisotropy Probe (MAP) Observatory, designed and built by NASA Goddard Space Flight
Center in partnership with Princeton University, will measure temperature fluctuations (anisotropy) and
produce a high sensitivity and high spatial resolution map of the cosmic microwave background (CMB)
radiation over the entire sky between 22 and 90 GHz. The CMB radiation is the remnant radiant heat left
over from the Big Bang.
MAP will measure the anisotropy of the CMB radiation over the full sky with an angular resolution of at
least 0.3 degrees, a sensitivity of 20 uK per 0.3 degree square pixel, and with systematic effects limited to 5
uK per pixel. MAP will obtain and process differential temperature data, rather than sensing absolute
temperatures, to produce a differential temperature map of the sky. This will be accomplished by using two
back-to-back optical systems followed by a set of 10 differential microwave receivers and associated signal
processing electronics. The Observatory will have a compound scan with a spin rate of ~0.454 rpm and a
precession rate of ~1 revolution per hour. This allows MAP to collect data over a 45° x 180° swath of the
sky every hour. The microwave receivers will cool to ~95 K, while the reflectors will cool to ~40 K.
Proper alignment of the telescope reflectors and the receiver feed horns at the operating temperature of 90
K is a critical element to ensure mission success. The instrument components, made of various materials
(aluminum, copper, composite, etc.), were designed based on deformations predicted by thermal modeling.
In order to ensure that the hardware behaved as predicted at cold operating temperatures, alignment
measurements would have to be taken during the thermal/vacuum testing of the prototype and flight
hardware. These measurements would have to resolve the deformations of the critical instrument
components as the hardware reached it's operating temperature.
We describe the hardware and methods used to validate the displacement/deformation predictions of the
reflectors and the microwave feed horns during thermal/vacuum testing of the reflectors and the microwave
instrument. The smallest deformations to be resolved by the measurement system were on the order of +
0.030 inches (0.762 mm). The system chosen to perform these alignment measurements was the
photogrammetric camera system.
1.1
MAP Hardware Description
MAP is essentially a dual-telescope differential microwave receiver. The two telescopes are mounted backto-back such that each telescope can collect microwave signals simultaneously from different parts of the
sky as the Observatory spins about it's axis. The instrument is divided into two receivers, an A-side and a
B-side, each side having a telescope and it's associated microwave sensing systems. Differencing
assemblies then combine the signals collected by the two sides.
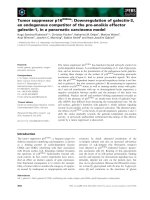
The two major subsystems involved in the PG measurements are the Thermal Reflector System (TRS) and
the Microwave System (MS). The TRS and the MS mount onto the spacecraft bus, as shown in the
exploded view of the MAP Observatory in Figure 1. The TRS and the MS, when assembled, comprise the
Instrument, as shown in Figure 2.
Thermal
Reflector
System
A-Side
B-Side
Secondary
Reflector
Primary
Reflector
Microwave
System
Figure 1 - MAP Systems - Exploded View
Figure 2 - MAP Instrument - Assembled View
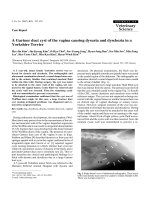
The TRS, shown in Figure 3, consists of a truss structure that is designed to support and maintain alignment
of the telescope reflectors, which focus the microwave energy into the MS. The reflectors were
manufactured by PCI of Anaheim, California, and are constructed of Korex Honeycomb composite with a
vapor deposited aluminum and SiOx coating.
The MS, shown in Figure 4, houses the microwave feed horns and the microwave amplifiers. The MS
consists of the Focal Plane Assembly (FPA) and the Receiver/Transceiver Box (RXB). The FPA supports
and aligns the 20 feed horns (10 feed horns/frequency bands per side) that collect the microwave sky
signals focused by the TRS telescopes, as well as the warm microwave components that amplify and detect
B-Side
A-Side
B- Side
A-Side
Secondary
Reflector
Primary
Reflector
Truss Structure
FPA
Figure 3 - TRS Structure
RXB
Figure 4 - Microwave System Assembly
these signals. The RXB houses the warm microwave amplifiers. The FPA, RXB, and feed horns are
constructed of aluminum. The feed horns feed the signal into copper waveguides and into the RXB.
1.2
Test Overview
The primary objective of these measurements was to validate the design displacement predictions of the
MAP hardware during thermal vacuum (T/V) testing. Two different test articles, the MS and the TRS,
would be tested. This required two separate T/V chamber sessions so that the test articles could be
swapped-out. Both of the test sessions were designed to perform the displacement measurements at the
mission operational temperature of ~ 60-90 K.
The primary objective of the MS test article configuration was to validate the feed horn displacement
predictions. Secondary objectives were to verify that there were no permanent deformations of the FPA
structure, and to observe displacement of targets placed on the Receiver/Transceiver Box (RXB) mounted
below the FPA. Deformations on the order of + 0.100 inches (2.540 mm) were expected on the MS test
article.
The TRS test article configuration would attempt to validate the TRS reflector displacement and distortion
predictions. Secondary objectives were to observe deformations of any FPA portions that were visible to
the camera, and to observe flange deformations on certain feed horns to determine if a gap between the
flange and inner bulkhead developed as the structures got cold. Deformations on the order of + 0.030
inches (0.762 mm) were expected on the TRS test article.
1.3
Photogrammetry Description
The PG system was chosen to perform these measurements because it could be converted to operate in a
hands-off capacity. Since the test articles would be enclosed in the T/V chamber during the thermal tests,
remote operation was an important capability.
Photogrammetry (PG) is a metrology method that uses digital photographs and the principals of
triangulation to obtain its results1,2. The PG system consists of the following components:
-
INtelligent digital CAmera (INCA) (modified Kodak DCS series camera)
-
Laptop with data analysis software (VSTARS) and a network connection to the INCA camera
-
Retro-reflective targets & scale bars of various lengths with a known coefficient of thermal
expansion (CTE)
PG measurements involve taking multiple digital photographs of the test object (targeted with the retroreflective targets) from various positions around the object (to obtain proper triangulation of the measured
target points). Triangulation is performed by the software, calculating the position of measured points.
Resection is then performed, calculating the position of the camera at the time each picture was taken. The
process of triangulation and resection by the software is referred to as a software bundle.
The accuracy of the measurements, and the ability of the software to bundle the shots, is a balance between
the targeting scheme (number and placement of targets on the test object), the number of shots
(photographs) taken, and the positions from which the shots were taken. The software provides indications
of the quality of the job after the bundle is completed. By verifying that these quality values are within an
acceptable range, the quality of a PG job can be assured.
Since PG measurements are inherently dimensionless, at least one known distance is required to scale the
measurement. Scale bars are placed in the PG targeting scheme to provide this known distance.
2.0
DEVELOPMENT EFFORTS
In order to operate the PG camera system remotely, various support equipment had to be developed to
allow the PG camera to interface with the T/V chamber and the testing hardware. Remote systems needed
to be developed to power, control, house, and move the camera.
The test articles would be surrounded by the helium shroud, which cools the test article during thermal
testing. Since the helium shroud completely encloses the test article, the modifications required to
accommodate the PG camera system would need to be made to the helium shroud.
The helium shroud structure supports twenty-eight cyropanels, providing a total area of ~ 300 square feet to
radiatively cool the test article. The structure is octagonal in shape, measuring 110 inches (2.79 m) across
and 182 inches (4.62 m) high. The cryopanels are plumbed into a recirculating helium skid that is capable
of providing over 1000 W of cooling at 20 K. The shroud is flooded with LN2 during cryogenic
operations. The helium shroud crown is lowered onto the helium shroud walls via a crane once the test
article has been placed inside the shroud. A cylindrical-shaped thermal blanket is used to closeout the
upper section of the helium shroud from the T/V chamber environment.
All support equipment developed had to be able to withstand and operate under the cryogenic temperatures
planned for the test.
2.1
Camera Power Supply and Network Interface.
Since the camera was to be enclosed inside the T/V chamber and operated remotely during testing, external
power and network capabilities were required in order to operate the camera system from outside the T/V
chamber. The PG system vendor specially designed and built a power supply/network module to provide
an external interface with the camera. The power interface fed the camera and the strobe-flash, while the
network connection established a link between the camera and a laptop computer outside the T/V chamber.
2.2
Camera Canister Development.
Since the PG camera system was designed for operation at room temperature, and measurements were to
performed with the camera inside the T/V chamber in vacuum and at temperatures of ~ 60-90 K, a
protective environment needed to be developed for the camera. The camera canister was developed to
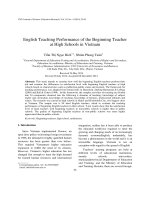
house the camera and provide a stable environment. Essentially a closed cylinder with a viewing window
(see Figure 5), the canister provides a pressurized, temperature-controlled environment for the PG camera.
The canister is equipped with heaters and a fan to offset the cryogenic temperatures in the T/V chamber. In
order to prevent flashback from the ring strobe (mounted on the front of the camera) off of the outer
window surface and back into the camera, the canister window was designed as a two-part window with
Canister
Stepper Motor
PG Camera
Viewport
Cable Feedthrough
Support Fixture
Figure 5 - Camera Canister
conical-shaped bonding. A bulkhead connector on the canister allows the power and network connections
to be made to the camera.
The camera canister also provided the ability to rotate the canister 90 degrees about the pointing angle of
the camera (shots at 0 and 90 degrees were required to satisfy camera self -calibration requirements). A
stepper motor mounted to the canister support frame provided the canister rotation capability.
2.3
Camera Carousel Development.
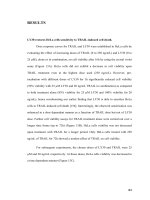
In order to measure a test article with PG, a method for moving the camera to various stations around the
test article while inside the T/V chamber was required. The camera carousel, shown in Figure 6, was
designed to allow the camera canister to move ~ 350 degrees around the perimeter of a test article.
Thermal Test Fixture
(Side View)
Thermal Test Fixture
(Top View)
Cable
Feedthrough
Carousel
Track
Carousel
Canister/PG
Camera
Helium
Shroud
Carousel
Drive/Motor
Figure 6 - Canister/Carousel Configuration
Essentially a circular chain-driven track (measuring ~ 110 inches (2.79 m) in diameter), the carousel would
be mounted on top of the helium shroud below the shroud crown. The camera canister would be mounted
to the track and transported around the test article by the carousel. The carousel would be remotely
operated from outside the T/V chamber via software control.
3.0
PG MEASUREMENT METHODOLOGY
Once PG was chosen as the metrology method and the support GSE was developed to allow PG to be used
remotely from outside the T/V chamber, efforts could be focused on how the measurements would be
taken. Significant efforts were expended to streamline the metrology procedures and ensure that the
measurement methodology was sound, since the measurements would be taken remotely during the T/V
chamber operations. Interruption or delay of a T/V test to make changes to the camera system or the
targeting would be relatively expensive.
3.1
Photogrammetric Targeting.
PG targets are used to define coordinate systems, help the PG software bundle the job, and provide
measurement values for points of interest. Development of a good targeting scheme design is driven by the
shape and size of the object itself, and the number of stations from which the PG photos will be taken. For
complex structures, various viewing angles (elevations) are usually required to see the targets. In the case
of the MS and TRS test articles, the camera was restricted to a single plane (defined by the canister on the
carousel), and the structures were quite complex. The number of possible carousel stations around the
objects were nearly unlimited, but changes in elevation could not be achieved. Proper design of the
targeting scheme for the T/V test was even more important since access to the test articles could not be
gained to add or adjust targets once the T/V chamber doors were closed.
The types of targets used in the MS and TRS test article targeting schemes are described below:
-
Coded Targets - A coded target consists of a series of retro-reflective dots that are uniquely patterned to
make it immediately identifiable to the PG software. The software uses the coded targets to correlate
the positions of the targets between photographs, helping it to identify the non-coded targets during the
bundling process.
-
Retro-Reflective Dot Targets - These targets, approximately 0.25 inches (6.35 mm) in diameter, were
used to target various points of interest on structures.
Figure 7 - 45 Degree Angled Target
-
45 Degree Angled Targets - These targets,
shown in Figure 7, consist of a retro-reflective
dot placed on a surface angled 45 degrees from
the shank centerline. The angled target and
offset these targets provide allow for greater
visibility than surface targets. A tooling hole is
required in the structure being measured for
these targets to be installed.
-
Tooling Hole Bosses (THB's) - Not a target
itself, a THB is a target holder that has been
bonded to the structure being measured. Any
variety of targets can be installed into the THB.
Analyses/simulations performed by the PG system vendor helped establish the best regions for targeting in
terms of expected accuracy. The final number and location of targets within those regions were determined
by GSFC. Test shots of the test article setups were performed to verify the targeting schemes and to build
the software template for the two test articles. Portions of the final targeting schemes for the MS and TRS
test articles are shown in Figures 8 and 9.
Target Legend:
THB_X = Tooling Hole Boss
C63
C68
C69
C67
C9 C64
C6
C66
C65
C57
C56
THB_17
C59
CX = Coded
C33
C58
C61 C62
C48
C60
THB_27
THB_30
FPA-X4
C45
C16
K1B-AP
THB_29
C29
C54
KaB-AP
C55
V1B-AP
THB_35
THB_28
C46
C26
THB_26
C19
C23
THB_25
THB_32
C18
C22
W1B-AP
W4B-AP
FPA-X6
C47
Q1B-AP
C14
C7
W2B-AP
FPA-X3
C27
W3B-AP
V2B-AP
Q2B-AP
FPA-X5
THB_34
C8
C13
FPA-X1
RXB-X2
C2 RXB-X1
-Y
THB_33
-X
FPA-X2
THB_5
THB_4
C25
C24
THB_6
Figure 8 - MS Targeting Scheme
THB_14
THB_15
C21
C20
THB_9
THB_8
THB_7
Figure 9 - TRS Targeting Scheme
Two aluminum scale bars were incorporated into each of the test article setups, which the PG software uses
to scale the job. Each scale bar provided three scaling distances (six targets). The effects of thermal
expansion and contraction of the scale bars needed to be accounted for since the T/V test environment
involved radical changes in temperature. A scale factor was calculated for each PG run, knowing the
temperature of the scale bars and the CTE of the scale bar material. The test article/scale bars could not be
deforming at the time of the PG measurement. A temperature change rate of < 1 o C per hour was required
before a PG run (series of PG shots) could be made. Thermal instrumentation (platinum resistance
thermometers were placed on various portions of the test article and on the scale bars) provided real-time
temperature data of the test article and the scale bars.. The rate of temperature change was verified before
each PG measurement. In addition, the scale bars were thermally isolated from the structure with blocks of
G-10 isolation material.
3.2
PG Software Template.
Due to the large number of PG runs planned for each test article, attempts were made to minimize the
processing time for each run and streamline the bundling process. To accomplish this, a template job was
developed for both the MS and TRS test article setups. A template file provides the following advantages:
1.
Automation of Bundling Process:
When a job is bundled, the software looks for points in the photographs and assigns its own labels to
the target points it identifies. Each of these labels must be manually changed to reflect the labels
defined by the targeting scheme. Normally, this process would be required for each set of pictures that
are bundled. Use of a template job limits this renaming process to only the first bundle. The template
job automates the bundling process by storing the name and location of desired targets. When using a
template job on a new set of pictures, the software looks for these targets stored in the template, and
automatically names them. The template job is created after the labels on the first set of pictures has
been renamed to be compatible with the targeting scheme. For measurements requiring multiple PG
runs of the same setup (as is the case with the MS and TRS test articles), the use of a template file
saves time and effort on the part of the PG operator.
Another advantage of a template is that it forces the software to look only for those points stored in the
template file. Without a template, the software searches for all possible targets in the pictures. This
can be a problem if there are non-targets such as glints or reflections in the pictures. Any
errant/mistaken targets would have to be manually removed during the bundling process. Again, use of
the template saves time and effort on the part of the operator.
2.
Establishing a Coordinate Reference Frame (CRF):
When a set of pictures is bundled, a default CRF is generated by the software. The bundle data needs
to be transformed from the local CRF to the test article CRF before data can be analyzed. The test
article CRF is defined by a subset of the measured points (that have known coordinates in the test
article CRF). Once collected, this design data is imported into the software template file. The
software then determines a best fit between the measured points and the design data. The end result is
a bundled job containing measured points that have been best fit and scaled to the design data.
In the case of the MS test article, 12 points along the sides of the FPA (6 per side) were used as design
data and were imported into the software template to define the instrument CRF. These same points
had previously been measured and valued in the CRF using two other metrology systems. When the
MS PG runs were bundled, the FPA targets were best-fit to the design data. The remaining targets
(coded, aperture, RXB, etc.) were allowed to “float” (the software did not include them in the best fit).
For the TRS test article the TRS CRF was defined by a subset of the THB targets mounted on the truss
structure. These targets had been previously measured and valued in the CRF by the manufacturer of
the TRS structure and GSFC using various metrology systems. The manufacturer data was imported
into the software template for the TRS test article as design data. As with the FPA test article
measurements, the remaining targets (coded, FPA, reflector, etc.) were allowed to float.
The development and use of a software template file for the MS and TRS test articles successfully
automated the processing of data for each of the PG runs, significantly reducing the amount of time
required to bundle each run.
3.3
Error Analysis.
An error analysis was required to ensure that the measurement requirements for the two parts of the T/V
test were met. It was determined that the camera system itself and the targeting were the major sources of
error for these measurements.
The measurement precision of the photogrammetric camera is + 0.002 inches (0.05 mm) at a range of 8 ft.
(2.44 m) (2 . The separation distance between the camera and the targets was less than 8 ft. for all of the
pictures taken in the T/V chamber.
The PG camera is self-calibrated as a byproduct of the measurement. There are three requirements to
achieve self-calibration. The first is to roll the camera 90 degrees for half of the pictures taken. Second,
there is a minimum number of pictures that must be taken from a minimum number of locations. Third,
there is a minimum number of well-distributed targets visible in each picture and for the entire test article.
All of these requirements were addressed during the development of GSE and the targeting scheme for the
T/V tests.
Through the process of bundling, the PG software provides indications of job quality and the occurrence of
errors. By carefully examining the software quality/error indicators and through proper use of the camera,
the worst-case error contribution from the PG camera itself is < + 0.002 inches (0.051 mm)
Target placement and target repeatability errors can be attributed to the PG targets used on the FPA during
the T/V test. The overall target error contribution (a combination of the these two errors) was calculates to
be < + 0.0015 inches (0.038 mm).
Taking all of the above errors into consideration, the total error for a given PG run can be established to be
< + 0.0035 inches (0.089 mm). This ensures that all measurements will be able to resolve the + 0.100 inch
(2.54 mm) and + 0.030 inch (0.762 mm) deformations that were predicted for the MS and TRS test articles,
respectively.
4.0
PG MEASUREMENTS/ANALYSIS
A PG run consisted of a series of pictures taken at various carousel stations around the test article. Two
pictures were required at each station to facilitate the camera self calibration - one with the canister at 0
degrees and the other with the canister at 90 degrees. The number and location of carousel stations was
predicted and tested during the pre-chamber targeting verification tests.
For each test article, the first PG run in the T/V chamber was performed at ambient temperature and
pressure to establish a pre-test baseline and to verify the carousel stations. As the first few PG runs
progressed, the number of carousel stations and their locations around the test article were modified slightly
to optimize the camera's view of the test article targeting.
4.1
PG Runs.
The final carousel station layout for the MS and TRS test articles are shown in Figures 10 and 11. A total
of 44 stations were used during the MS test article PG runs, resulting in 88 PG shots (camera at 0 and 90
degrees at each station). The TRS test article PG runs consisted of 42 carousel stations, resulting in 84 PG
shots. It took the camera operator and carousel operator ~ 30 minutes to obtain all of the shots in a PG run.
Station Location
23
Station Location
180
24
21
o
26
Helium Shroud
Walls
25
Walls
X = Camera Carousel
22
24
Helium Shroud
Carousel Camera
Stations
X = Camera Carousel
Carousel Camera
Stations
26
25
21
20
o
180
19
18
17
27
16
15
29
18
27
22
28
20
19
23
17
28
14
30
16
13
31
15
29
30
14
13
31
32
12
32
12
33
270
o
90
33
11
o
11
90 o
270 o
10
34
35
10
34
9
8
36
6
38
7
40
6
3
42
0
43
5
38
TRS Test
Article
2
o
39
44
FPA Test
Article
40
0
41
42
1
o
3
4
2
1
Station Angle
9
10
11
12
13
14
15
16
80 o
85
90
95
100
105
110
115
Station Angle
17
18
19
20
21
22
23
24
120 o
125
130
140
155
170
185
200
Station Angle
25
26
27
28
29
30
31
32
215 o
230
240
245
250
255
260
265
Station Angle
33
34
35
36
37
38
39
40
270o
275
280
285
290
295
300
305
Figure 10 - MS Carousel Layout
Canister
Parking Spot
Carousel
Dead Zone
Canister
Parking Spot
Carousel
Dead Zone
Station Angle
37
4
41
0o
30
40
50
60
65
70
75
8
36
5
39
1
2
3
4
5
6
7
8
9
35
7
37
Station Angle
41
42
43
44
310o
320
335
345
Station Angle
1
2
3
4
5
6
7
8
0o
5
20
25
30
35
50
60
Station Angle
9
10
11
12
13
14
15
16
70o
80
90
100
110
120
130
145
Station Angle
17
18
19
20
21
22
23
24
150o
155
160
170
175
180
185
190
Station Angle
25
26
27
28
29
30
31
32
200o
205
210
215
230
240
250
260
Station Angle
33
34
35
36
37
38
39
40
270 o
280
290
300
310
325
330
335
Station Angle
41
42
340o
345
Figure 11 - TRS Carousel Layout
Once the PG shots for a given PG run were taken, the run was bundled using the template job. Once the
bundle was deemed successful (~ 20 minutes of processing and analysis time by the operator on the laptop
computer), the PG operator would give concurrence for the test to proceed to the next test (temperature)
point.
A series of PG runs had been planned for the T/V testing as a baseline. However, the number of PG runs
and their timing was changed as the T/V testing progressed. A total of six PG runs were made for the MS
test article, while five PG runs were made for the TRS test article.
Each MS and TRS test article PG run was bundled using the template to automate the job bundle. Each job
was transformed into the appropriate coordinate reference frame via a best fit with design data (present
within the job template). An EXCEL™ program was used to determine the scale factors and CTE for the
scale bars at each temperature case. Once the job was scaled, the measured points were exported to an
EXCEL™ program in order to compare the runs. Data tables were developed to present the results of the
measurements. For each of the two parts of the test, each of the PG runs was compared to all of the other
runs to determine the target displacements from case-to-case.
5.0
PG MEASUREMENT RESULTS.
Both the MS and TRS test articles were thermally tested in the T/V chamber at cryogenic (~ 60-90 K)
temperatures. PG measurements were successfully made using the PG system remotely from outside the
T/V chamber. Brief summaries of the results of these measurements are provided in the sections below.
5.1
MS Test Article Results.
The primary measurement objective of the MS test article configuration was to validate the feed horn
displacement predictions. Secondary objectives were to observe any displacement/rotation of the RXB and
to verify that there were no permanent deformations of the FPA structure.
The following result summaries were derived from the data obtained during the six PG runs of the MS test
article:
Entrance Aperture Translations:
The feed entrance aperture translations were all within 10 percent of predictions. Translations were on the
order of + 0.100 inches.
RXB Motion:
RXB motions were determined by least squares fitting the warm positions to the cold positions. The
resulting translations and rotations of the RXB were as expected, based on hand calculations.
Post-Test Residuals:
The final ambient measurement data was compared to the initial ambient measurement data to identify
residual deformation of the structure. There were no apparent residual deformations due to thermal testing,
based on a comparison of 164 targets. The standard deviations for residuals in each coordinate axis were
0.001 inches (0.025 mm). The maximum residual was 0.004 inches (0.102 mm). The estimated PG
measurement error is + 0.0035 inches (0.089 mm).
5.2
TRS Test Article Results.
The primary measurement objectives of the TRS test article configuration were to validate the TRS
reflector displacement and distortion predictions and derive a CTE value for the composite truss structure.
Secondary objectives were to validate the gapping between the feed flanges and the FPA inner bulkhead
and to verify that there were no permanent deformations of the TRS structure.
The following result summaries were derived from the data obtained during the five PG runs of the TRS
test article:
Reflector Deformations/Position:
The measured reflector deformations confirmed measurements that were made previously on the Reflector
Engineering Unit (REU). Due to difficulties in accurately modeling the complex curved honeycomb
composite reflectors, measurements at temperature were relied on to determine the shape deformations.
Consistency in the results provided confidence in the shape values. Overall deformations, removing rigid
body motion, were on the order of + 0.030 inches for the primary reflectors and + 0.015 inches for the
secondary reflectors.
Reflector position changes due to cool-down revealed a discrepancy in the truss CTE values. The
secondary reflectors translated inward, where they were predicted to move outward, due to a negative truss
CTE.
Truss CTE:
The apparent CTE of the truss structure was +4.9E-7 in/in/K, based on the PG measurements. The
predicted CTE based on laminate properties was –5.1E-7 in/in/K. Although uncertainty was later placed on
both CTE values due to simplifying assumptions, the test revealed secondary reflector translations to be
opposite of that predicted and ultimately resulted in slight repositioning of replacement secondary
reflectors.
Flange gapping:
Targets were added to the FPA structure for measuring flange gapping during the TRS testing. Gaps of
0.002 - 0.006 inches were measured. The values compared well with the 0.005 inches predicted for the 4
feeds measured.
Post-Test Residuals:
The final ambient measurement data was compared to the initial ambient measurement data to identify
residual deformation of the structure. There were no apparent residual deformations due to thermal testing,
based on a comparison of 185 targets. The standard deviations for residuals in each coordinate axis were
0.002 inches (0.051 mm). The maximum residual was 0.007 inches (0.178 mm). The estimated PG
measurement error is + 0.0035 inches (0.089 mm).
6.0
CONCLUSION
The PG measurements under cryogenic T/V chamber conditions were a success based on the data that has
been analyzed and presented. The concept and design of the camera canister and carousel GSE worked
well, providing a flexible metrology platform for the PG camera. The targeting schemes that were
developed for each test article provided visibility of the regions in-question, as well as the accuracy
required to measure their distortions.
With the combined MS and TRS PG runs measurements were obtained for feed translations, flange
bulkhead gapping, RXB motion, reflector deformations, and reflector motion resulting from transition to
cryogenic temperatures. These measurements were successfully made in parallel with the thermal
performance test objectives.
Overall, the MAP optical measurement test objectives were met using these techniques in the
thermal/vacuum environment.
ACKNOWLEDGEMENTS
The authors would like to thank the PG System vendor, Geodetic Services Inc., for their hardware design
and development effort, as well as their support in getting the most out of the measurements. Our thanks
also go out to Mantech Services Inc. for the technical support in preparing and 24 hour operation of the T/V
chamber, to Dean Osgood of Mantech Services Inc. for the theodolite, laser tracker, and photogrammetry
measurement support, and to our Mechanical Systems Analysis & Simulation group for mechanical
systems analysis.
REFERENCES
1.
Elements of Photogrammetry, Paul R. Wolf, McGraw Hill 1983
2.
Automation in Digital Close-Range Photogrammetry, Clive S. Fraser, First Trans Tasman Surveyors
Conference, 12-18 April, 1997, New Castle