EFFECTS OF FLOOD CONTROL MEASURES AND CLIMATE CHANGE IN THE RHINE BASIN
Bạn đang xem bản rút gọn của tài liệu. Xem và tải ngay bản đầy đủ của tài liệu tại đây (957.38 KB, 11 trang )
4th International Symposium on Flood Defence:
Managing Flood Risk, Reliability and Vulnerability
Toronto, Ontario, Canada, May 6-8, 2008
EFFECTS OF FLOOD CONTROL MEASURES AND CLIMATE CHANGE
IN THE RHINE BASIN
A.H. te Linde1,2, J.C.J.H. Aerts1, and B.J.J.M. van den Hurk3
1. Institute for Environmental Studies, (IVM), Faculty of Earth and Life Sciences, Vrije Universiteit, De
Boelelaan 1087, 1081 HV Amsterdam, The Netherlands
2. Deltares, Rotterdamseweg 185, 2629 HD Delft, The Netherlands
3. Royal Netherlands Meteorological Institute (KNMI), Wilhelminalaan 10, 3732 GK De Bilt, The
Netherlands
ABSTRACT: Due to several flood events since the early 1990’s additional flood management strategies
are being developed in the Rhine basin. Together with the growing awareness that climate change does
significantly affect the runoff regime, the need arises to determine the effectiveness of flood control
measures under different climate change scenarios. In the current study, we considered implementation
of detention areas planned for the year 2020 and dike heightening, and used the recently developed
KNMI’06 climate change scenarios for the year 2050. The findings suggest that climate change has the
most profound increasing effect on extreme discharges and influences all peak events, instead of only the
most extreme values. Under climate change, it appears that flooding will occur more frequent and that
flood control measures planned for the year 2020 will more often be operational. We revealed, though,
that the effect of detention measures is minimal when compared to the simulated effect of both climate
change and upstream flooding.
Key Words: Extreme discharges, climate change, detention measures, stochastic rainfall generator.
1.
INTRODUCTION
Flood control and water resources management activities in the Rhine basin started already in the
beginning of the 19th century. As a result of several flood events since the early 1990’s, flood risk
management has gained increased attention in the region. This resulted for example in the Flood Action
Plan (ICPR, 1998) and the recently implemented EU Flood Directive (EU, 2007). Accurately simulating
effects of flood control measures under varying conditions to support decision-making, remains a
challenge.
Furthermore, there is a growing awareness that climate change does significantly affect weather patterns
and therefore the runoff regime. It is expected that climate change will have major implications for the
discharge regime of the Rhine basin. Seasonal discharge will shift to more discharge in winter and less
discharge in summer, and frequencies of floods and droughts are expected to increase (Kwadijk, 1993;
Middelkoop et al., 2001; Te Linde, 2007). Recent climate change research focuses on simulating changes
in the magnitude and frequencies of extreme flood events using different predictive models (Kundzewicz
1
et al, 2007). Based on these results, additional flood management strategies can be developed to cope
with both increased discharges and resulting potential damages.
The current paper displays a method to determine the effectiveness of flood control measures under
different climate change scenarios in the Rhine basin. The flood control measures under consideration
are implementation of detention areas and dike heightening, both in the Upper Rhine and the Lower
Rhine area. The effectiveness of flood control measures is very much dependent on the type of flood
event due to the heterogeneity of the Rhine catchment and wide variety of extreme meteorological events
(Lammersen, 2002). In order to assess effects of potential measures under a range of events, we use
resampling methods to describe future scenarios by time series up to 1000 years of meteorological data.
These are used as input to hydrological models and to derive a well described statistical distribution of
daily discharge values and their return periods. It is shown that analysing these scenarios will provide
insight in the heterogeneity and uncertainty of peak flow events and effectiveness of adaptation
measures, resulting in a robust way of intercomparison of these variables.
2.
BACKGROUND
2.1
Rhine basin
The entire Rhine basin is spread over multiple countries in NW-Europe and covers an area of 160,800
km2 upstream of Lobith, which is located at the Dutch-German border. Here, the river Rhine has an
average discharge of 2200 m 3/s. The discharge is influenced by the amount and timing of precipitation,
snow storage and snow melt in the mountain region the Alps, the evaporation surplus during the summer
period, and changes in groundwater and soil water storage (Pinter et al., 2006). The Rhine has a length of
863 km from Basel in Switzerland to Lobith. Kaub is located at the Middle Rhine at river kilometre 546.
2.2
Human impact
Human activity influenced flooding conditions since the beginning of the 19 th century, and at a very local
scale, even prior to that date. To force incision of the main Rhine branch with the aim to reduce flooding,
the Upper Rhine was straightened between 1817 and 1890. This also changed flooding conditions further
downstream. To aid shipping, further rectification and canalization was engineered until 1955. The
construction of weirs between 1955 and 1977 caused additional steepening of flood waves and
acceleration of flood wave propagation in the Rhine, increasing flood risk (Lammersen, 2002). Especially
in the Lower Rhine area, dikes were built to control peak flows. Safety levels of these embankments vary
from once in 200 to 500 years in Germany, while in the Netherlands the 1250-year flood is the base for
the design discharge of 16,000 m 3/s. To reduce flood risk in the Upper Rhine area, France and Germany
have agreed upon implementing flood detention areas. They are partly realised and implementation is
ongoing (Hooijer, 2004). Deforestation added to increased peak discharges, but during very extreme
events with wet antecedent soil conditions, the effect is minor (Pfister et al, 2004). Land use change along
the main Rhine branch, however, does significantly contribute to increased flood risk, especially due to
urbanisation in flood prone areas (Hooijer, 2004).
2.3
Historical floods
These measures did not prevent the Rhine from flooding. As a result of technical measures, flooding
occurred less frequently, but economic development increased potential flood damage. The flood of 1926
was catastrophic in both Germany and the Netherlands. More recent floods with major economic damage
and several fatalities occurred in 1993 and 1995 in the Lower Rhine. These floods were caused by heavy,
long lasting rainfall (Caspary, 1996) and originated in the uplands of the Middle and Lower Rhine, where
mild temperatures caused melting of snow and frozen soil, but there was hardly any contribution from the
2
Alps (Disse and Engel, 2001). Floods of 1990, 2005 and 2007 only reached extreme peak discharges in
the Upper Rhine area and originated mainly in the Alps as a result of snow melt and heavy rainfall. These
upstream floods caused less fatalities and damage than floods in the Lower Rhine area (Brakenridge and
Anderson, 2008).
3.
3.1
METHOD
Climate change scenarios
On 30 May 2006, the Royal Netherlands Meteorological Institute (KNMI) presented four new climate
scenarios for the Netherlands (Van den Hurk et al, 2006) which are referred to as KNMI’06 scenarios. The
four KNMI’06 scenarios are based on projections from five different General Circulation Models (GCMs).
The ensemble of GCM simulations shows variable changes in the strength of westerly winds in the area
around the Netherlands. A strong change of atmospheric circulation is expected to result in milder and
wetter winters due to more westerly winds, and in warmer and drier summer due to more easterly winds,
when compared to scenarios without atmospheric circulation change. Hence, besides temperature, the
atmospheric circulation is used as steering parameter to discriminate four climate change scenarios. The
scenarios are summarized in Table 1 and are all equally probable.
Table 1. Changes in precipitation and temperature corresponding to the KNMI’06 scenarios for the year
2050. G is moderate and W is warm. ‘+’ Indicates scenarios with a strong change of atmospheric
circulation.
Winter
Variable
Summer
G
G+
W
W+
G
G+
W
W+
Mean T (K)
+ 0.9
+1.1
+ 1.8
+ 2.3
+ 0.9
+ 1.4
+ 1.7
+ 2.8
Mean P (%)
+ 3.6
+ 7.0
+ 7.3
+ 14.2
+ 2.8
- 9.5
+ 5.5
- 19.0
Based on the KNMI’06 scenarios specific climate scenarios for the Rhine basin were constructed by
applying the so-called ‘delta change approach’ (Lenderink, 2007; Te Linde, 2007). The delta change
approach adds the expected temperature increase to the observed temperature record. Precipitation was
perturbed by a fraction. This method has some limitations. First, these rules leave the present day
variance of temperature and the coefficient of variation of precipitation unchanged. Also, changes in the
number of precipitation days are not considered. Finally, the transformation was applied to the whole
Rhine basin, not taking into account possible geographical differences. A historical data set for the period
of 1961-1995 of daily temperature and precipitation data is available at 36 stations in the Rhine basin. We
used the delta method to transform these 35 years of observed data according to decade values of the
change in precipitation and temperature provided by the KNMI’06 scenarios.
3.2
Hydrological models
The HBV model (Hydrologiska Byråns Vattenbalansavdelning) (Bergström, 1976; Lindström et al., 1997)
is a semi-distributed conceptual rainfall-runoff model that simulates discharge on a daily basis for 134
sub-basins of the Rhine. The model consists of different routines in which snowmelt is computed by a
day-degree relation, and groundwater recharge and actual evaporation are functions of actual water
storage in a soil box. Discharge formation is represented by three linear reservoir equations and the sub-
3
basins are linked together with a simplified Muskingum approach to simulate routing processes. The HBV
model was developed for the Rhine in 1999 (Eberle et al, 2005).
The routing scheme in HBV does not suffice at high discharges, because the Rhine is regulated river.
Yearly maximum peak flows were then re-calculated using the hydrodynamic model SOBEK, which
describes the main Rhine branch from Maxau downwards and parts of several side branches. SOBEK
allows for schematizing complex cross sections and implementing structures and measures like detention
areas, river widening or dike heightening (SOBEK-RE, 2005).
3.3
Stochastic rainfall generator
Using nearest-neighbour resampling and 35 years of historical data, the rainfall generator produces series
of 1000 years of synthetic precipitation and temperature values. For a detailed description of the method,
see (Beersma, 2001). We used these series as input data for hydrological modelling of the Rhine basin
producing multiple sets of 1000 years of daily discharges from which we filtered all yearly maxima. This
enabled us to produce long time series describing the effects of climate change and measures on 1000
different types of flood events.
3.4
Extreme value analysis
Current methods use an extreme value distribution fit on observed yearly maximum discharges to
estimate discharges with very low probabilities. This fit is then extrapolated to 1250 years, resulting in
very wide confidence intervals around the values of interest. This extrapolation method assumes that
there will be no upstream flooding. The re-sampling strategy that we have used in the current paper
produces 1000 yearly discharge maxima. Consequently, the period of simulation is in the same order as
the return period of the event of interest, which will reduce the confidence intervals of the extreme value
distribution fit on these data. At the gauging station of Lobith, the Gumbel distribution appears to fit best at
extreme discharge values and is used as generalized extreme value distribution. In Germany, LogPearson-3 is generally used for discharge stations in the Rhine basin (Lammersen, 2002). For
comparison reasons we used only the Gumbel distribution, both at the gauging stations of Lobith and
Kaub.
3.5
Measures
From historical events and model simulations, it is known that floods occur both in the Upper Rhine and
the Lower Rhine, when discharges of around 11,000 m 3/s are reached at Lobith (Lammersen, 2004). To
mitigate these floods, flood detention areas are planned up to the year 2020. We modelled the effect of
the proposed flood detention areas and one additional flood management strategy and compared these
with the current situation. Upstream flooding in Germany is in an ironic way beneficial for the Netherlands;
flooded water will not reach the Netherlands, or significantly delayed. Future flood management strategies
might result in dike heightening in Germany and that is why we want to test a scenario with infinite dike
heights. Each strategy was schematised in SOBEK. The assessed strategies are:
1) Current situation of the Rhine branch, including current dike heights, structures, detention areas
and potential flooding areas.
2) Infinite dike heights along the entire Rhine branch, which implies that no floods occur at any peak
discharge.
3) Planned detention measures for the year 2020.
4
4.
RESULTS
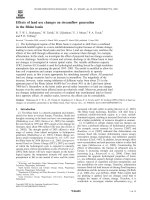
Figure 1 displays the predicted mean change in discharge at Lobith, both in absolute and relative values
as a result of the KNMI’06 climate change scenarios. The G and W+ scenarios represent the mildest and
the most extreme scenario, and by that means the spread of all four scenarios. It can be seen that the
simulated effect of climate change on mean discharges is considerate. The mean rise in discharge in the
winter months DJF increases with 200 m3/s (8%) for the G scenario to about 500 m 3/s (17%) for the W+
scenario. In the summer months JJAS, the discharge changes only minor in the G scenario. The W+
scenario, though, shows a decrease in mean discharge of 750 m 3/s (42 %), due to the strong changes of
atmospheric circulation in this scenario.
Figure 1: Mean change in discharge at Lobith, a) absolute values and b) relative values
The maximum observed discharge at Lobith is 12,600 m 3/s (1926). As mentioned in Sect 2.2, 16,000 m 3/s
at Lobith is the design discharge for dike heights in that area in the Netherlands, which has an assumed
return period of once in 1250 years. The black line in Figure 2 illustrates a synthetic discharge event that
will result in a peak discharge of 16,000 m 3/s at Lobith, in case no upstream flooding will occur. Detention
measures in Germany are designed for less extreme discharges. As can be seen from the left figure, the
simulated effect of the planned detention measures for 2020 is marginal for the displayed discharge. The
figure on the right, however, displays the effect of upstream flooding that will occur under current
conditions, which lowers the amount of water reaching Kaub and Lobith significantly.
Figure 2: Effect of detention measures and of upstream flooding on a synthetic discharge wave at Lobith
Figure 3 visualizes the narrowing effect the number of events has on the width of the confidence intervals
of the extreme value distribution fit. The Gumbel fit overestimates the most extreme discharge events,
because no threshold value is used here. In Figure 4 the Gumbel fits are not graphically visualized, but
5
noted in tables for return periods of 100, 500 and 1250 years. At Lobith 7000 m 3/s is used us a threshold
above which all values are used in the Gumbel fit and at Kaub the threshold value is 4000 m 3/s.
Figure 3 Gumbel plots of yearly maximum discharges at Lobith. The Gumbel fit is projected as a straight
line with 95 % confidence intervals. Displayed are 100 years of observed data (left) and 1000 years of resampled data (right).
To analyse the simulated effect of climate change, only the most extreme W+ scenario is plotted in Figure
4a. All yearly maxima are expected to increase, resulting in an average discharge increase of 20% at the
return periods displayed at Lobith and of 24% at Kaub. For Lobith, this means an increase of peak
discharge with a return period of 1250 years from 15,880 m 3/s to 19,250 m3/s. In Figure 4b the effect of
flooding is visible above 12,000 m3/s at Lobith and above 7800 m3/s at Kaub and it can be seen that the
flood volume increases with increasing discharge. This results in a downwards deflecting Gumbel plot.
The assumption of a straight line when fitting the Gumbel distribution is obviously not correct here, which
probably results in false estimates of discharges presented in the tables for the given return periods.
When flooding is simulated, discharges do not once reach 14,500 m 3/s at Lobith in a period of 1000
years.
To estimate the effect of the measures planned for the year 2020, model simulations were made with
current dike heights and thus potential flooding areas. Figure 4c shows that flooding will remain when
extreme discharges occur, both at Lobith and Kaub. The only difference is visible at discharges between
10,000 and 12,000 m3/s for Lobith and at discharges between 7000 and 7800 m 3/s for Kaub. These are
discharges with return periods between 25 and 100 years under current conditions; the peak discharges
these detention measures are designed for. Notable is the minimal change in discharge volume, when
compared to the simulated effect of climate change and of upstream flooding.
5.
DISCUSSION AND CONCLUSIONS
The goal of the current paper was to display a method to determine the effectiveness of flood control
measures under different climate change scenarios in the Rhine basin. The effect of climate change and
flood control measures is very much dependent on the type of flood event due to the heterogeneity of the
Rhine catchment and the wide variety of extreme meteorological events. To overcome this heterogeneity,
we used a rainfall generator and different hydrological models to produce multiple sets of 1000 years of
daily discharges. This enabled us to describe the effects of climate change and measures on 1000
6
different types of flood events. We have seen that the increased number of events significantly narrows
the width of the 95% confidence intervals around the extreme value distribution fit on yearly maximum
discharges.
7
8
Figure 4 Gumbel plots of 1000 years of re-sampled yearly maximum discharges at Lobith and Kaub, for
different climate change scenarios and measures. The tables display discharges for several return
periods resulting from Gumbel distribution fits (not graphically visualized)
Results have shown that the simulated effect of climate change is considerate, both on mean discharges
and on extreme events. According to the W+ scenario, mean winter discharges are expected to increase
with 17% and mean summer discharge to decrease with 42% at Lobith. When analysing extreme events,
it was shown that all yearly maxima are expected to increase, resulting in an average discharge increase
of 20% at the return periods at Lobith and of 24% at Kaub. For Lobith, this means an increase of peak
discharge with a return period of 1250 years from 15,880 m 3/s to 19,250 m3/s. Furthermore, we have
explained that the effect of flooding increases with increasing discharge, which results in a downwards
deflecting Gumbel plot. When flooding is simulated, discharges do not once reach 14,500 m 3/s at Lobith
in a period of 1000 years. By plotting and analysing the effect of measures planned for the year 2020 in
the same way, we revealed that the effect is minimal when compared to the simulated effect of climate
change and of upstream flooding. The detention measures do not show any effect on 1250-year flood
events because they are designed for more frequent events with return periods between 25 and 100
years; the detention areas will already be flooded during more extreme events.
This study revealed that flooding significantly lowers extreme events, which means that dike heightening
will increase downstream discharges of these events. But the findings suggest that climate change has a
more profound increasing effect on extreme discharges and influences all peak events, instead of only the
most extreme values. Under climate change, it appears that flooding will occur more frequent and that
flood control measures planned for the year 2020 will more often be operational. We are led to the
conclusion that the planned flood control measures for the year 2020 are not effective at extreme
discharges with return periods of 100 years or more, both under current conditions and under future
climate change scenarios.
We have shown that our method provides insight in the effectiveness of flood control measures under
climate change scenarios and results in a robust way of intercomparison of these variables. Additional
research is needed on simulating the combined effect of climate change, dike heightening and detention
measures. This can be obtained by more variation in hydrological model schematizations and more
simulations according to our proposed method. Also, we note that research is ongoing on creating more
statistically adapted and geographically varied climate change scenarios for the Rhine basin.
6.
REFERENCES
Beersma, J.J., Buishand, T.A., Wójcik, R., 2001. Rainfall generator for the Rhine basin; multi-site
simulation of daily weather variables by nearest-neighbour resampling. In: P. Krahe, Herpertz, D.
(Editor), Generation of hydrometeorological reference conditions for the assessment of flood hazard
in large river basins. International Commission for the Hydrology of the Rhine basin (CHR), Lelystad,
the Netherlands, pp. 69-77.
Bergström, S., 1976. Development and application of a conceptual runoff model for Scandinavian
catchments, Ph.D. thesis, University of Lund, Lund, Sweden.
Brakenridge, G.R. and Anderson,
/>
E.,
2008.
Darthmouth
Flood
Observatory,
Dartmouth,
Caspary, H.J., 1996. Recent Winter Floods in Germany Caused by Changes in the Atmospheric
Circulation Across Europe. Physics and Chemistry of the Earth, 20(5-6): 459-462.
9
Disse, M. and Engel, H., 2001. Flood events in the Rhine basin: Genesis, Influendes and Mitigation.
Natural Hazards, 23: 271-290.
Eberle, M., Buiteveld, H., Wilke, K. and Krahe, P., 2005. Hydrological Modelling in the River Rhine Basin
Part III - Daily HBV Model for the Rhine Basin. BfG-1451, Institute for Inland Water Management and
Wase Water Treatment (RIZA) and Bundesanstalt für Gewässerkunde (BfG), Koblenz, Germany.
EU, 2007. Directive 2007/60/EC of the European Parliament and of the Council of 23 October 2007 on
the assessment and management of flood risks. Directive 2007/60/EC, Commission of the European
communities (EU), Brussels.
Hooijer, A., Klijn, F., Pedroli, G.B.M., Van Os, A.G., 2004. Towards sustainable flood risk management in
the Rhine and Meuse basins: synopsis of the findings of IRMA-SPONGE. River Research and
Applications, 20: 343-357.
ICPR, 1998. Rhine Action Plan. ICPR/IKSR, Rotterdam.
Kundzewicz, Z.W. et al., 2007. Freshwater resources and their management. In: M.L. Parry, O.F.
Conziani, J.P. Palutikof, P.J. Van der Linden and C.E. Hanson (Editors), Climate Change 2007:
Impacts, Adaptation and Vulnerability. Contribution of Working Group II tot the Fourth Assessment
Report of the Intergovernmental Panel on Climate Change. Cambridge University Press, Cambridge,
UK, pp. 173-210.
Kwadijk, J.C.J., 1993. The impact of climate change on the discharge of the river Rhine, PhD Thesis,
University of Utrecht, Utrecht, The Netherlands.
Lammersen, R., 2004. Grensoverschrijdende effecten van extreem hoog water op de Niederrhein (In
Dutch). Ministerium für Umwelt und Naturschutz, Landwirtschaft und Verbraucherschutz des Landes
Nordrhein-Westfalen, Provincie Gelderland, Minsterie van Verkeer en Waterstaat, Arnhem.
Lammersen, R., Engel, H., Van den Langenheem, W. and Buiteveld, H., 2002. Impact of river training and
retention measures on flood peaks along the Rhine. Journal of Hydrology, 267: 115-1242.
Lenderink, G., Buishand, A. and Van Deursen, W., 2007. Estimates of future discharges of the river Rhine
using two scenario methodologies: direct versus delta approach. Hydrological Earth System
Sciences, 11(3): 1145-1159.
Lindström, G., Johansson, B., Persson, M., Gardelin, M. and Bergström, S., 1997. Development and test
of the distributed HBV-96 hydrological model. Journal of Hydrology, 201: 272-288.
Middelkoop, H. et al., 2001. Impact of climate change on hydrological regimes and water resources
management in the Rhine basin. Climatic Change, 49: 105-128.
Pfister, L., Kwadijk, J.C.J., Musy, A., Bronstert, A. and Hoffman, L., 2004. Climate change, land use
change and runoff prediction in the Rhine-Meuse basins. River Research and Applications, 20: 229241.
Pinter, N., Van der Ploeg, R.R., Schweigert, P. and Hoefer, G., 2006. Flood magnification on the River
Rhine. Hydrological Processes, 20: 147-164.
SOBEK-RE, 2005. SOBEK-RE 1DFLOW Technical Reference 2.52.005. Institute for Inland Water
Management and Waste Water Treatment (RWS-RIZA), WL | Delft Hydraulics report, Delft, The
Netherlands.
10
Te Linde, A.H., 2007. Effect of climate change on the discharge of the rivers Rhine and Meuse. Applying
the KNMI 2006 scenarios using the HBV model. Q4286, WL | Delft Hydraulics report, Delft, The
Netherlands.
Van den Hurk, B. et al., 2006. KNMI Climate Change Scenarios 2006 for the Netherlands. KNMI Scientific
Report WR 2006-01, KNMI, De Bilt, the Netherlands.
11