Beta A Statistical Analysis of a Stock’s Volatility Courtney Wahlstrom Iowa State University, Master of School Mathematics Creative Component Fall 2008
Bạn đang xem bản rút gọn của tài liệu. Xem và tải ngay bản đầy đủ của tài liệu tại đây (362.78 KB, 20 trang )
Beta
A Statistical Analysis of a Stock’s Volatility
Courtney Wahlstrom
Iowa State University, Master of School Mathematics
Creative Component
Fall 2008
Amy Froelich, Major Professor
Heather Bolles, Committee Member
Travis Sapp, Committee Member
Beta: A Statistical Analysis of a Stock’s Volatility
With recent economic uncertainty, discussion of the volatility of the stock market
is unavoidable. Describing the current market, finance professor at New York University
Robert Engle stated, "We have no idea where things are going. That is what high
volatility means,” (Merle, 2008). The value β portrays the volatility of an individual stock
compared to the market as a whole, usually represented by the S&P500. This β paints a
picture of how much an investor can expect a particular stock to increase or decrease in
price compared to the movement of the market as a whole. A high β value does not mean
that a stock is expected to increase in value; it means that it is much more volatile (likely
to increase or decrease at higher rates) than the market as a whole. Therefore, if the
market rises, one would expect a stock with a high β to rise at a higher rate. Likewise, if
the market falls, a stock with a high β should fall at a higher rate as well. On the contrary,
a stock with a relatively small β value maintains a much steadier price over time than the
market. This can be summarized in the following chart describing the potential values of
β for any given stock:
Table 1. Summary of Values of beta and the relationship to market movements.
β <0
β =0
0< β <1
β =1
β >1
The stock moves contrary to the market in an inverse relationship. As the
market increases, the value of this stock is expected to decrease. While this
relationship theoretically exists, few stocks possess a negative beta. One
example of an investment with negative beta is gold.
The stock’s returns are unrelated to market moves.
The stock is expected to move more slowly than the market. If the market
rises, this stock should also rise but not as drastically as the market; likewise
if the market falls, this stock is expected to be less volatile than the market.
The stock should move in a manner very similar to the market as a whole.
The stock has proven over time to be more volatile than the market. As the
market rises, this stock should rise at a higher rate. Likewise, a more severe
2
loss is anticipated in the event the market falls.
1. A Statistical Model for beta
Statistically, the beta value for a stock is thought of as the slope in the linear equation
between the percent of change in the market or index fund (the explanatory variable) to
the percent of change in the price of the individual stock (the response variable). The
relationship can be modeled with the following equation
y i xi ei
where
yi : represents the percent change in the stock
: represents the percent change in the stock if the percent change in the market
is zero
: represents the rate of change in the stock compared to the change in the
market
xi : the percent of change in the market as a whole
ei : the difference in the predicted compared to the observed for each coordinate
The values of alpha and beta can be estimated using the method of least squares. This
model can be expressed as
yˆ i ˆ ˆxi
where
yˆi : represents the predicted value of the percent change in the stock given the
percent change in the market
ˆ : represents the y-intercept of the least squares regression line
ˆ : represents the slope of the least squares regression line
xi : the percent of change in the market as a whole
3
Beta hat is then the estimate of the stock’s beta value. In order to find this least
squares regression line, the observed values are compared to the predicted values
determined by the model (regression line). This difference between the observed
coordinate and the predicted coordinate on the line is referred to as the error, or ei for
each coordinate, i. Therefore, the best line to represent the data is the line that minimizes
the sum of the square of these error terms (the square of the difference between the
predicted and the observed). Let yi represent the observed percent of change in stock
ˆ
value. Therefore, yi yˆi ei or yi ˆ ˆ xi ei . Thus, in order to determine ˆ and
e y ˆ ˆ x
, the following must be minimized:
n
i 1
2
i
n
i 1
i
2
i
To minimize, first take the derivative with respect to ˆ :
x
n
yi ˆ ˆ xi
ˆ i 1
n
2 yi ˆ ˆ xi
i 1
2
i
And setting that derivative equal to 0 in order to minimize:
4
n
2 xi yi ˆ ˆ xi
i 1
0
x y ˆ ˆ x 0
n
i 1
i
i
i
x y ˆ x ˆ x 0
n
2
i
i 1
i
i
n
i
n
n
x y ˆ x ˆ x
i 1
i
i
i 1
i
i 1
i
2
0
And solving for ˆ :
n
n
n
x y ˆ x
i 1
i
i
i 1
n
i
i 1
n
x y ˆ x
i 1
2
ˆ xi
i
i
i 1
n
x
i 1
2
i
ˆ
i
5
Similarly, taking the derivative with respect to ˆ :
ˆ
n
yi ˆ ˆ xi
i 1
n
2 yi ˆ ˆ xi
i 1
2
n
2 yi ˆ ˆ xi
i 1
1
0
y ˆ ˆ x 0
n
i
i 1
i
n
n
n
i 1
i 1
yi ˆ ˆ xi 0
i 1
n
n
y nˆ ˆ x
i 1
i
i 1
i
0
So, solving for ˆ :
n
n
i 1
i 1
n
n
yi ˆ xi nˆ
yi ˆ xi
i 1
i 1
n
ˆ
Therefore, substituting this equation into ˆ in the previously derived formula for ˆ :
6
n
n
ˆ x
y
i
i
n
i 1
i 1
xi yi
n
i 1
n
x
2
n
xi
i 1
ˆ
i
i 1
And multiplying numerator and denominator by n to simplify:
n
n
n
n
n xi yi yi ˆ xi xi
i 1
i 1
i 1
i 1 ˆ
n
2
n xi
i 1
Simplify to solve for ˆ :
2
n
n
n
n
n
2
n xi yi yi xi ˆ xi ˆ n xi
i 1
i 1
i 1
i 1
i 1
2
n
n
2
n xi yi yi xi ˆ n xi ˆ xi
i 1
i 1
i 1
i 1
i 1
n
n
n
n 2 n 2
ˆ
n xi yi yi xi n xi xi
i 1
i 1
i 1
i 1
i 1
n
n
n
n
n
n
n xi yi yi xi
i 1
i 1
i 1
2
2
n xi xi
i 1
i 1
n
n
ˆ
2. Implementation on TI Graphing Calculator
The task of turning this calculation process into an actual program on the
graphing calculator began with obtaining the historical prices of a stock and of the
S&P500. This data is easily obtained online, and I used the Yahoo! Finance page to
download this data into a spreadsheet. From there, data is copied, pasted, and saved into a
list in the TI-Connect data software (Texas Instruments, 2008). This transfer of data to the
calculator serves as the main input of the program. The program simply asks the user for
7
the ticker symbol of the index (in order to pull up the correct list of prices) and the ticker
symbol of the index (GSPC – for the S&P500) used to represent the market. Lastly, the
user inputs “n” the number of data points to be used.
First, the program uses each list of prices to calculate the percent of change in
prices for each day (or month, depending on the data) by a simple “for loop” of (dayi+1dayi)/dayi. These percent changes are stored into lists. The program then calculates and
i n
stores the individual pieces of the linear regression:
i 1
i n
xi ,
i 1
i n
xi * yi,
i 1
y i , and
i n
i 1
( x i ) 2 . Then, putting these pieces together, the program computes the slope of the least
squares line: m
n
x y x y
n x x
2
2
and outputs this value as β. Next, the program
graphically displays the data as a scatter plot with the percent changes in the S&P500
along the x-axis and the changes in the stock price along the y-axis and draws the least
squares line using the calculated β as its slope and the following calculated alpha as its y-
intercept:
y x .
n
The following screen captures display the code written for this program to calculate beta:
1:
2:
8
3:
4:
3. An Example of Estimating Beta for Texas Instruments.
The following displays an example through the program for the stock TXN (Texas
Instruments). First, the daily data from a two year history has been downloaded from the
Yahoo! Finance and stored into lists on the calculator:
Next, the opening screen obtaining the inputs, and then also displaying β:
Lastly, the calculator displays the scatter plot with the least squares line:
4. Discrepancies in the estimation of beta
9
In the example above using the TI calculator, the beta value of the stock is
estimated to be 0.91. This beta was estimated using market and stock daily values for a
two year history of prices; however, a survey of different business sites shows
discrepancies in the estimation of beta. For example, on September 6, 2008, the following
websites cited the β values for the Texas Instruments, Inc. (TXN) stock:
Table 2. Values for beta for Texas Instrument Stock
Financial Website
Beta Value
Yahoo
1.41
Reuters
1.77
CNBC
1.13
This chart clearly depicts the inconsistency associated with estimating β. For a
value that is commonly referred to in the investing world, there is no standard set of data
to be used for the estimation of β, so numerous possibilities exist such as daily prices for
the past two years, monthly prices for the past two years, weekly prices for five years,
etc. According to the websites, Yahoo! uses monthly data compared to the S&P500 over a
three year time period, and Reuters uses monthly data compared to the S&P500 over a
five year time period (CNBC’s method for calculating β is not available). These
differences would cause the estimates of beta for a stock to be different.
In order to more efficiently investigate this discrepancy, I used the statistical
package JMP (SAS Institute, 2008) in order to estimate β values for comparison of
multiple types of data for the same stock. I began by downloading the historical daily
values of the individual stock (TXN) and the market (GSPC) and then calculated the
percentage change for each. Once calculated, these data are easily transferred into JMP.
10
Once in JMP, the least squares regression line is determined and the estimate of beta
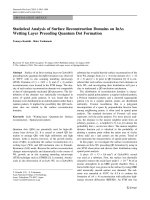
given. Below is an example of the scatter plot of the percentage change in the index
versus the percentage change in the Texas Instrument Stock using monthly prices for
Texas Instruments, Inc. over a five year period:
Figure 1. Scatter plot: Percent Change in S&P 500 to Percent Change in TXN
0.3
% Change in Stock
0.2
0.1
0
-0.1
-0.2
-0.1
-0.05
0
0.05
% Change in Index
The least squares regression line has the equation
(Predicted % Change in Stock) = -0.003842 + 1.7850076*(% Change in Index),
with an R-squared value of 33.0%. From the least squares equation, the estimate of β is
1.785. This suggests that the price of Texas Instruments, Inc. stock is approximately
78.5% more volatile than the market as a whole. The same process was used in order to
determine the β value using weekly and daily prices and dating back one year, two years,
and ten years for the Texas Instruments, Inc. stock. The following chart displays the
resulting β values and corresponding R-Squared values for each type of data:
Table 3. Beta estimates for Texas Instrument Stock using monthly, weekly or daily
values for a time period of 1, 2, 5 or 10 years.
11
Monthly
Weekly
Daily
1 Year
1.066
0.869
0.794
2 Years
R2=0.260
1.153
R2=0.282
0.945
R2=0.262
0.861
5 Years
R2=0.267
1.785
R2=0.262
1.343
R2=0.268
1.156
10 Years
R2=0.331
1.896
R2=0.287
1.605
R2=0.266
0.815
R2=0.285
R2=0.258
R2=0.071
From the table, we see that the frequency and amount of data used to calculate β
for a given stock greatly affects the value of β. Most drastically, the β values from some
sets of data (weekly and daily going back for one or two years; daily ten years) suggest
that TXN is less volatile than the market as a whole while the β values calculated from
the other sets of data suggest that TXN is more volatile than the market as whole. Even
beyond these drastically different results, even the β values that all suggest that TXN is
more volatile than the market vary significantly in the level of volatility. For instance,
when the change in the market increases by 1%, the monthly data going back one year
suggest that the individual stock would increase by 1.06%; however, for the same change
in the market, the monthly data going back ten years suggest that the individual stock,
TXN would increase by 1.896%.
12
One consideration for the type of data chosen to calculate β must be tradeoff
between accuracy and relevance. By using more data points (extending back more years),
the accuracy of β may rise, however, the relevance of those data points must be
questioned. Trends in data from ten years ago may have little bearing on trends seen
today for the same stock. Further, using daily or weekly price changes provides more data
points (and generally more accuracy), but monthly data may provide increased relevance
due to the nature of most investors’ needs (Deutsch, 2005).
The chart also includes the R-squared values for each of the corresponding
2
models. In general, R
variability of predicted
gives the percentage of total risk that is
variability of observed
systematic (market-related) in nature, which 1 R 2 gives the percentage of total risk that
is diversifiable (not market-related) in nature. While these values appear quite similar for
each of the models used to calculate β, the highest by far exists when using monthly data
that extends back five years.
5. The Role of beta in Investment Decisions
β serves many valuable purposes in investing. First, as previously mentioned, it
assesses the risk involved with an individual stock. This certainly plays a significant role
for investors. Some investors may be willing to invest in a stock with a large β with hopes
of a large payoff, understanding the larger risk involved with such a stock. Other
investors may be more inclined to invest in a safer stock with a smaller β to put less of
their investment at risk, understanding that their potential return will not be as high.
In addition to assessing the risk involved with an individual stock, β can also be
used in valuing a company (McClure, 2004). Determining the value of a company serves
13
in comparing its value to the price of the stock. Quite simply, if the calculated value is
less than the current stock price, the stock is most likely overpriced and should not be
purchased. In a similar fashion, if the calculated value is higher than the price, the stock
should be a good investment. β can be used in determining this value of the company as
evidenced in the following formula:
V a lu e
E x p e cted F u tu r eP a y o ff
1 R
F
R
M
R
F
t
Where R
F
And R
the expected return on the market as a whole (i.e., S&P500)
M
the risk-free rate of return (i.e., US Treasury bond)
The focus of this project is not on the other values involved in this calculation (they are
easily obtained or estimated) but rather on the important role that β plays in investment
decisions.
A simpler method of valuing a stock would be to look at , the y-intercept of the
least squares line used to find beta. If 0 , the asset is underpriced, and if 0 , then
the asset is overpriced. Another suggested use of beta is for an investor to calculate the
weighted average beta of an entire portfolio. As Tom Zwrilein, professor of finance at
University of Colorado at Colorado Springs suggests, “Beta doesn’t work well on the
individual stock level” (Pellet, 47, 2004). The average beta of the entire portfolio would
provide the investor with a larger picture of the anticipated volatility compared to that of
the market.
6. The Role of Beta in Mathematics Education
This concept of beta is certainly something my students in my Algebra II classes
could understand on an introductory level. We briefly study linear regression in Algebra
14
II in the chapter dealing with linear relationships. After reviewing writing equations of
lines, students learn to estimate the line of best fit or trend line for a scatter plot and also
to use the TI Graphing calculators to perform linear regression. Exploring the topic of
beta provides an opportunity for my students to be able to explore a real world context
with real world data that matters. To further enrich, this lesson could become a
collaborative lesson with an economics class during an introductory unit to the stock
market. Such a lesson would include (see Appendix A):
-
Brief introduction to stocks, volatility, beta, S&P 500/the market
(collaborated with economics teacher)
-
Review of calculating percent of change
-
Provide students with a table of data containing the percent of change of
the market and the percent of change of a stock (See Appendix B)
-
Students will enter the data into graphing calculator and create a scatter
plot.
-
Find the least squares line using the linear regression feature on the
calculator, graph this line on the calculator and copy down the equation
of the line, focusing on beta (the slope).
-
Graph the line y x and compare to the least squares line. Lead the class
in a discussion of slope (more/less steep) and the implications in this
context.
-
Possible extension: Have students choose their own stock, download the
historical prices, calculate the percent of change, use their calculator to
find the line (and therefore beta) and interpret.
15
Furthermore, this project has again reminded me of the importance of cross-referencing
and challenging information that is placed before me and presented as fact. Obviously,
this project is a perfect example of a case where the “facts” do not line up perfectly, and a
truly mathematical approach seeks a reason why. I want to teach my students to look at
the world around them with open, inquisitive minds. So often, mathematical education
unfortunately seems to revolve around set processes that are presented with few thoughtprovoking lessons. While some things in mathematics work this way, students need to
learn to question why something works the way it does and if something is correct
without blindly accepting it as fact.
From another perspective, I truly enjoyed this project because it revolved around a topic
that interests me and that sparked curiosity. I need to find ways to pull those types of
projects and topics more into my classroom. My students need to learn how to ask and
answer mathematical questions in topics that matter to them. While this presents a lofty
goal in the classroom, it certainly creates for valuable, meaningful education.
16
Appendix A
Algebra II
Beta Activity
Name: ________________________
1: We must first turn our scatter plots ON on our calculators:
[2nd ] [y = ]
(STAT PLOT)
Choose Plot 1: Highlight “ON” and push [ENTER]
Choose the Scatter Plot TYPE
XList: L1
YList: L2
2:Enter the data:
[STAT] Option 1: Edit
Enter data into the columns for L1 and L2.
(if there is already data present, you can clear it out by highlighting L1 or L2 and pushing
the CLEAR button – do not push the DEL button to do this, it will delete the list, not
just the data – or you can simply type over the existing data)
Enter the % Change in the market (x) into L1 and the % change in the stock (y) into L2
3:Make a scatter plot:
To set the window, you can push the [ZOOM] and choose the ZOOM STAT option (you
must scroll down to it).
→Sketch the scatter plot here:
17
→As the % change in the market (x) increases, what is the trend in the % change in the
stock?
4:Find line of best fit:
[STAT]- go over to option CALC –
choose option 4 LinReg
Push [ENTER]
→ Write down the equation (round to the nearest thousandth):
→ What is the slope of the line (ie. the beta value for this stock)?
→What does this mean in the given context?
→Graph the line on the scatter plot (type the equation in Y=). Draw a sketch.
→Graph the line
y = 1x in the same window. If this were the line of best fit, what
would it represent in the given context?
5: Another stock
Return to step #2 and repeat, changing the data in L2 to the General Motors data.
6: Comparison
Compare the beta values for TXN and GM. What expectations would you have for these
two stocks?
18
Appendix B
#1: TXN Data for Beta Activity
Date
S&P500
8-Nov
8-Oct
8-Sep
8-Aug
8-J ul
8-J un
8-May
8-Apr
8-Mar
8-Feb
8-J an
7-Dec
7-Nov
% Change (X) TXN
% Change(Y)
0.04
-0.02
1,005.75
19.09
-0.17
-0.09
968.75
19.56
-0.09
-0.12
1,164.74
21.5
0.01
0.01
1,282.83
24.51
-0.01
-0.13
1,267.38
24.38
-0.09
-0.13
1,280.00
28.16
0.01
0.11
1,400.38
32.48
0.05
0.03
1,385.59
29.16
-0.01
-0.06
1,322.70
28.27
-0.03
-0.03
1,330.63
29.96
-0.06
-0.07
1,378.55
30.95
-0.01
0.06
1,468.36
33.4
1,481.14
31.57
#2: GM Data for Beta Activity
19
References
Babson. (Fall 2004). Data Finder: Finding Beta. Retrieved July 2007 from
/>Deutsch, J. (2005). Stock beta calculation. Retrieved October 10, 2008, from
/>Harrington, D. (1983). Stock prices, beta, and strategic planning. Harvard Business
Review. May-June 1983, 157-159.
McClure, B. July 2007. Beta: Know the Risk. Retrieved 30 November 2004, from
.
Merle, R. October 2008. High levels of volatility show fear’s role in stock markets. The
Mercury News. Retrieved October 23, 2008, from
/>Pellet, J. (2004). Beta on it. Money. March 2004, 47.
Stock Beta Calculation. (2006) Stock Beta Calculation. Retrieved October 10, 2008, from
/>SAS Institute (2008). JMP Software (Version 7) [Software]. Available from
/>Texas Instruments (2008). TI Connect Software [Software]. Available from
/>Yahoo! Finance. (2008). Key Statistics. Retrieved September 2008 from
/>
20