Screening of a charged particle by multivalent counterions in salty water strong charge inversion
Bạn đang xem bản rút gọn của tài liệu. Xem và tải ngay bản đầy đủ của tài liệu tại đây (576.4 KB, 17 trang )
Screening of a charged particle by multivalent counterions in salty water: Strong
charge inversion
T. T. Nguyen, A. Yu. Grosberg, and B. I. Shklovskii
arXiv:cond-mat/0002305v3 [cond-mat.soft] 15 May 2000
Department of Physics, University of Minnesota, 116 Church St. Southeast, Minneapolis, Minnesota 55455
Screening of a macroion such as a charged solid particle, a charged membrane, double helix DNA
or actin by multivalent counterions is considered. Small colloidal particles, charged micelles, short
or long polyelectrolytes can play the role of multivalent counterions. Due to strong lateral repulsion
at the surface of macroion such multivalent counterions form a strongly correlated liquid, with the
short range order resembling that of a Wigner crystal. These correlations create additional binding
of multivalent counterions to the macroion surface with binding energy larger than kB T . As a result
even for a moderate concentration of multivalent counterions in the solution, their total charge at
the surface of macroion exceeds the bare macroion charge in absolute value. Therefore, the net
charge of the macroion inverts its sign. In the presence of a high concentration of monovalent salt
the absolute value of inverted charge can be larger than the bare one. This strong inversion of charge
can be observed by electrophoresis or by direct counting of multivalent counterions.
PACS numbers: 87.14.Gg, 87.16.Dg, 87.15.Tt
common sense fails for screening by Z-valent counterions
(Z-ions) with large Z, such as charged colloidal particles, micelles or rigid polyelectrolytes, because there are
strong repulsive correlations between them when they are
bound to the surface of a macroion. As a result, Z-ions
form strongly correlated liquid with properties resembling a Wigner crystal (WC) at the macroion surface.
The negative chemical potential of this liquid leads to an
additional ”correlation ” attraction of Z-ions to the surface. This effect is beyond the mean field PB theory, and
charge inversion is its most spectacular manifestation.
I. INTRODUCTION
Charge inversion is a phenomenon in which a charged
particle (a macroion) strongly binds so many counterions in a water solution that its net charge changes sign.
As shown below the binding energy of a counterion with
large charge Z is larger than kB T , so that this net charge
is easily observable; for instance, it is the net charge that
determines linear transport properties, such as particle
drift in a weak field electrophoresis. Charge inversion
is possible for a variety of macroions, ranging from the
charged surface of mica or other solids to charged lipid
membranes, DNA or actin. Multivalent metallic ions,
small colloidal particles, charged micelles, short or long
polyelectrolytes can play the role of multivalent counterions. Recently, charge inversion has attracted significant
attention1–9 .
Charge inversion is of special interest for the delivery
of genes to the living cell for the purpose of the gene
therapy. The problem is that both bare DNA and a cell
surface are negatively charged and repel each other, so
that DNA does not approach the cell surface. The goal
is to screen DNA in such a way that the resulting complex is positive10 . Multivalent counterions can be used
for this purpose. The charge inversion depends on the
surface charge density, so the cell surface charge can still
be negative when DNA charge is inverted.
Charge inversion can be also thought of as an overscreening. Indeed, the simplest screening atmosphere,
familiar from linear Debye-Hă
uckel theory, compensates
at any finite distance only a part of the macroion charge.
It can be proven that this property holds also in nonlinear Poisson-Boltzmann (PB) theory. The statement
that the net charge preserves sign of the bare charge
agrees with the common sense. One can think that this
statement is even more universal than results of PB equation. It was shown1–3 , however, that this presumption of
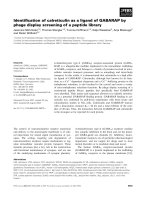
Let us demonstrate fundamental role of lateral correlations between Z-ions for a simple model. Imagine a
hard-core sphere with radius b and with negative charge
−Q screened by two spherical positive Z-ions with radius
a. One can see that if Coulomb repulsion between Z-ions
is much larger than kB T they are situated on opposite
sides of the negative sphere (Fig. 1a).
FIG. 1. a) A toy model of charge inversion. b) PB approximation does not lead to charge inversion.
If Q > Ze/2, each Z-ion is bound because the energy required to remove it to infinity QZe/(a + b) −
Z 2 e2 /2(a + b) is positive. Thus, the charge of the whole
complex Q∗ = −Q + 2Ze can be positive. For example,
Q∗ = 3Ze/2 = 3Q at Q = Ze/2. This example demonstrates the possibility of an almost 300% charge inversion.
It is obviously a result of the correlation between Z-ions
1
which avoid each other and reside on opposite sides of
the negative charge. On the other hand, the description
of screening of the central sphere in the PB approximation smears the positive charge, as shown on Fig. 1b and
does not lead to the charge inversion. Indeed, in this
case charge accumulates in spherically symmetric screening atmosphere only until the point of neutrality at which
electric field reverses its sign and attraction is replaced
by repulsion.
Weak charge inversion can be also obtained as a trivial result of Z-ions discreteness without correlations. Indeed, discrete Z-ions can over-screen by a fraction of the
”charge quantum” Ze. For example, if central charge
−Q = −Ze/2 binds one Z-ion, the net charge of the
complex is Q∗ = Ze/2. This charge is, however, three
times smaller than the charge 3Ze/2 which we obtained
above for screening of the same charge −Ze/2 by two correlated Z-ions, so that for the same Q and Z correlations
lead to stronger charge inversion.
Difference between charge inversion, obtained with and
without correlations becomes dramatic for a large sphere
with a macroscopic charge Q ≫ Ze. In this case, discreteness by itself can lead to inverted charge limited by
Ze. On the other hand, it was predicted3 and confirmed
by numerical simulations11 that due to correlation between Z-ions which leads to their WC-like short range
order on the surface of the sphere, the net inverted charge
can reach
Q∗ = 0.84 QZe,
(A brief preliminary version of this paper is given in Ref.
12).
Since, in the presence of a sufficient concentration of
salt, the macroion is screened at the distance smaller
than its size, the macroion can be thought of as an overscreened surface, with inverted charge Q∗ proportional
to the surface area. In this sense, overall shape of the
macroion and its surface is irrelevant, at least to a first
approximation. Therefore, we consider screening of a
planar macroion surface with a negative surface charge
density −σ by finite concentration, N , of positive Z-ions,
and concentration ZN of neutralizing monovalent coions,
and a large concentration N1 of a monovalent salt. Correspondingly, we assume that all interactions are screened
with Debye-Hă
uckel screening length rs = (8lB N1 )1/2 ,
where lB = e2 /(DkB T ) is the Bjerrum length, e is the
charge of a proton, D ≃ 80 is the dielectric constant of
water. At small enough rs , the method of a new boundary condition for the PB equation suggested in Ref. 2,3
becomes less convenient and in this paper we develop
more universal and direct theoretical approach to charge
inversion problem.
Our goal is to calculate the two-dimensional concentration n of Z-ions at the plane as a function of rs and N .
In other words, we want to find the net charge density of
the plane
σ ∗ = −σ + Zen.
(2)
In particular, we are interested in the maximal value of
the ”inversion ratio”, σ ∗ /σ, which can be reached at large
enough N . The subtle physical meaning of σ ∗ should be
clearly explained. Indeed, the entire system, macroion
plus overcharging Z-ions, is, of course, neutralized by the
monovalent ions. One can ask then, what is the meaning
of charge inversion? In other words, what is the justification of definition of Eq. (2) which disregards monovalent
ions?
To answer we note that under realistic conditions, every Z-ion, when on the macroion surface, is attached
to the macroion with energy well in excess of kB T . At
the same time, monovalent ions, maintaining electroneutrality over the distances of order rs , interact with the
macroion with energies less than kB T each. It is this
very distinction that led us to define the net charge of the
macroion including adsorbed Z-ions and excluding monovalent ions. Our definition is physically justified, it has
direct experimental relevance. Indeed, it is conceivable
that the strongly adsorbed Z-ions can withstand perturbation caused by the atomic force microscopy (AFM) experiment, while the neutralizing atmosphere of monovalent ions cannot. Therefore, one can, at least in principle, count the adsorbed Z-ions, thus directly measuring
σ ∗ . To give a practical example, when Z-ions are the
DNA chains, one can realistically measure the distance
between neighboring DNAs adsorbed on the surface. In
most cases, similar logic applies to an electrophoresis
experiment in a weak external electric field such that
(1)
i. e. can be much larger than the charge quantum Ze.
This charge is still smaller than Q because of limitations
imposed by the very large charging energy of the macroscopic net charge.
In this paper, we consider systems in which inverted
charge can be even larger than what Eq. (1) predicts.
Specifically, we consider the problem of screening by Zions in the presence of monovalent salt, such as NaCl,
in solution. This is a more practical situation than the
salt-free one considered in Ref. 2,3. Monovalent salt
screens long range Coulomb interactions stronger than
short range lateral correlations between adsorbed Z-ions.
Therefore, screening diminishes the charging energy of
the macroion much stronger than the correlation energy
of Z-ions. As a results, the inverted charge Q∗ becomes
larger than that predicted by Eq. (1) and scales linearly with Q. The amount of charge inversion at strong
screening is limited only by the fact that the binding energy of Z-ions becomes eventually lower than kB T , in
which case it is no longer meaningful to speak about
binding or adsorption. Nevertheless, remaining within
the strong binding regime, we demonstrate on many examples throughout this work, that the inverted charge, in
terms of its absolute value, can be larger than the original
bare charge, sometimes even by a factor up to 3. We call
this phenomenon strong or giant charge inversion and its
prediction and theory are the main results of our paper
2
n = σ/Ze (we approximate the hexagon by a disk). We
find that at rs ≫ R0
the current is linear in applied field. Sufficiently weak
field does not affect the strong (above kB T ) attachment
of Z-ions to the macroion. In other words, macroion
coated with bound Z-ions drifts in the field as a single
body. On the other hand, the surrounding atmosphere
of monovalent ions, smeared over the distances about rs ,
drifts with respect to the macroion. Presenting linear
electrophoretic mobility of a macroion as a ratio of effective charge to effective friction, we conclude that only
Z-ions contribute to the former, while monovalent ions
contribute only to the latter. In particular, and most importantly, the sign of the effect - in which direction the
macroion moves, along the field or against the field - is determined by the net charge σ ∗ which, once again, includes
Z-ions and does not include monovalent ones. Furthermore, for a macroion with simple (e.g., spherical) shape,
the absolute value of the net macroion charge can be also
found using the mobility measurements and the standard
theory of friction in electrolytes13 . This logic fails only
for the regime which we call strongly non-linear. In this
regime, majority of monovalent ions form a bound GouyChapman atmosphere of the inverted charge, and, while
surface charge as counted by AFM remains equal σ ∗ ,
the electrophoretic measurement yields universal value
e/2πlB rs , which is inverted but is smaller than σ ∗ . For a
macroion of the size smaller than rs , its size determines
the maximum inverted charge.
Now, as we have formulated major goal of the paper,
let us describe briefly its structure and main results. In
Sec. II - IV we consider screening of a charged surface by
compact Z-ions such as charged colloidal particles, micelles or short polyelectrolytes, which can be modeled as
a sphere with radius a. We call such Z-ions ”spherical”.
Spherical ions form correlated liquid with properties similar to two-dimensional WC (Fig. 2).
σ ∗ /σ = 0.83(R0 /rs ) = 0.83ζ 1/2 ,
where ζ =
Ze/πσrs2
(ζ ≪ 1)
(3)
2
= (R0 /rs ) . At rs ≪ R0
2πζ
σ∗
,
= √
σ
3 ln2 ζ
(ζ ≫ 1).
(4)
Thus σ ∗ /σ grows with decreasing rs and can become
larger than 100%. We also present numerical calculation
of the full dependence of the inversion ratio on ζ.
rs
rs
a)
111111
000000
000000
111111
000000
111111
000000
111111
000000
111111
000000
111111
000000
111111
000000
111111
000000
111111
000000
111111
000000
111111
000000
111111
000000
111111
000000
111111
000000
111111
000000
111111
000000
111111
000000
111111
000000
111111
000000
111111
000000
111111
A
1
0
b)
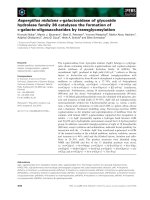
FIG. 3. Two models of a macroion studied in this paper.
Z-ions are shown by full circles. a) Thin charged plane immersed in water. The dashed lines show the position of effective capacitor plates related to the screening charges. b)
The surface of a large macroion. Image charges are shown by
broken circles.
In Sec. III we discuss effects related to finite size of Zion. It is well known14 that monovalent ions can condense
on the surface of a small and strongly charged spherical
Z-ion. As a result, instead of the bare charge of Z-ions
in Eqs. (3) and (4) one should use the net charge of Zions, which is substantially smaller. Thus, condensation
puts a limit for the inversion ratio. The net charge grows
with the radius a of the Z-ion. Therefore, we study in
this section the case when rs ≪ a ≪ R0 and showed that
the largest inversion ratio for spherical ions can reach a
few hundred percent.
Sec. IV is devoted to more realistic macroions which
have a thick insulating body with dielectric constant
much smaller than that of water. In this case each Zion has an image charge of the same sign and magnitude.
Image charge repels Z-ion and pushes WC away from the
surface. In this case charge inversion is studied numerically in all the range of rs or ζ. The result turns out
to be remarkably simple: at ζ < 100, the inversion ratio
is twice smaller than for the case of the charged sheet
immersed in water. A simple interpretation of this result
will be given in Sec. IV.
In Sec. V and VI we study adsorption of long rod-like
Z-ions with negative linear charge bare density −η0 on
a surface with a positive charge density σ. (We changed
the signs of both surface and Z-ion charges to be closer to
Ê
FIG. 2. Wigner crystal of Z-ions on the background of surface charge. A hexagonal Wigner-Seitz cell and its simplified
version as a disk with radius R are shown.
In Sec. II we begin with screening of the simplest
macroion which is a thin charged sheet immersed in water
solution (Fig. 3a). This lets us to postpone the complication related to image potential which appears for a more
realistic macroion which is a thick insulator charged at
the surface (Fig. 3b). We calculate analytically the dependence of the inversion ratio, σ ∗ /σ, on rs in two limiting cases rs ≫ R0 and rs ≪ R0 , where R0 = (πσ/Ze)−1/2
is the radius of a Wigner-Seitz cell at the neutral point
3
ing (rs ≪ A) when screening of both the charged surface
and the polyelectrolyte can be treated in Debye-Hă
uckel
approximation6. The result of Ref. 6 can be obtained if
we replace the net charge ηc by the bare charge η0 in Eq.
(5) .
In Sec. VI we study the adsorption of DNA rods in
the case of weak screening by monovalent salt, rs ≫ A0 .
In this case, screening of the overcharged plane by monovalent salt becomes strongly nonlinear, with the GouyChapman screening length λ = e/(πlB σ ∗ ) much smaller
than rs . Simultaneously, the charge of macroion repels
monovalent coions so that some of them are released from
DNA. As a result the absolute value of the net linear
charge density of a rod, η, is larger than ηc . We derived
two nonlinear equations for unknown σ ∗ and η. Their
solution at rs ≫ A0 gives:
the practical case when DNA double helices are adsorbed
on a positive surface.) Due to the strong lateral repulsion, charged rods tend to be parallel to each other and
have a short range order of an one-dimensional WC (Fig.
4). In the Ref. 15 one can find beautiful atomic force microscopy pictures of almost perfect one-dimensional WC
of DNA double helices on a positive membrane. The
adsorption of another rigid polyelectrolyte, PDDA, was
studied in Ref. 16. Here we concentrate on the case of
DNA.
σ∗
ηc
=
exp −
σ
πaσ
FIG. 4. Rod-like negative Z-ions such as double helix DNA
are adsorbed on a positive uniformly charged plane. Strong
Coulomb repulsion of rods leads to one-dimensional crystallization with lattice constant A.
η = ηc
It is well known that for DNA, the bare charge density, −η0 is four times larger than the critical density
−ηc = −DkB T /e of the Onsager-Manning condensation17 . According to the solution of nonlinear PB equation, most of the bare charge of an isolated DNA is compensated by positive monovalent ions residing at its surface so that the net charge of DNA is equal to −ηc . The
net charge of DNA adsorbed on a charged surface may
differ from −ηc due to the repulsion of positive monovalent ions condensed on DNA from the charged surface.
We, however, show that in the case of strong screening, rs ≪ A0 (A0 = ηc /σ), the potential of the surface
is so weak that the net charge, −η, of each adsorbed
DNA is still equal to −ηc . Simultaneously, at rs A0
the Debye-Hă
uckel approximation can be used to describe
screening of the charged surface by monovalent salt. In
Sec.V, these simplifications are used to study the case of
strong screening. We show that the competition between
the attraction of DNA to the surface and the repulsion of
the neighbouring DNAs results in the negative net surface charge density −σ ∗ and the charge inversion ratio,
similar to Eq. (4):
σ∗
ηc /σrs
=
,
σ
ln(ηc /σrs )
(ηc σ/rs ≫ 1)
ln
A0
rs
ln
a
2πa
ln(rs /a)
ln(A0 /2πa)
,
.
(6)
(7)
At rs ≃ A0 we get η ≃ ηc , λ ≃ rs and σ ∗ /σ ≃ 1 so that
Eq. (6) matches the strong screening result of Eq. (5).
Since η can not be smaller than ηc , the fact that η ≃ ηc
already at rs ≃ A0 proves that at rs ≪ A0 , indeed, η ≃ ηc
In Sec. VII we return to spherical Z-ions and derive
the system of nonlinear equations which is similar to one
derived in Sec. VI for rod-like ones. This system lets us
justify the use of Debye-Hă
uckel approximation for screening of overcharged surface ( Sec. II) at rs smaller than rm ,
where rm = a exp(R0 /1.65a) is an exponentially large
length. We show that even at rs ≫ rm nonlinear equations lead only to a small correction to the power of rs in
Eq. (3).
In Sec. I-VII we assume that the surface charges of
a macroion are frozen and can not move. In Sec. VIII
we explore the role of the mobility of these charges. Surface charge can be mobile, for example, on charged liquid
membrane where hydrophilic heads can move along the
surface. If a membrane surface has heads with two different charges, for example, 0 and -e, the negative ones can
replace the neutral ones near the positive Z-ion, thus accumulating around it and binding it stronger to the surface. We show that this effect enhances charge inversion
substantially. We conclude in Sec. IX.
(5)
Thus the inversion ratio grows with decreasing rs as in the
spherical Z-ion case. At small enough rs and σ, the inversion ratio can reach 400%. This is larger than for spherical ions because in this case, due to the large persistence
length of DNA, the correlation energy remains large and
WC-like short range order is preserved at smaller σrs .
An expression similar Eq. (5) has been recently derived
for the case of polyelectrolyte with small absolute value
of the linear charge density, η0 ≪ ηc , and strong screen-
II. SCREENING OF CHARGED SHEET BY
SPHERICAL Z-IONS
Assume that a plane with the charge density −σ is immersed in water (Fig. 3a) and is covered by Z-ions with
two-dimensional concentration n. Integrating out all the
4
monovalent ion degrees of freedom, or, equivalently, considering all interactions screened at the distance rs , we
can write down the free energy per unit area in the form
F = πσ 2 rs /D − 2πσrs Zen/D + FZZ + Fid ,
where N0 = Ns exp(−|µW C |/kB T ) is the concentration
of Z-ions in the solution next to the charged plane.
which plays the role of boundary condition for N (x) when
x → 02,3 . It is clear that when N > N0 , the net charge
density σ ∗ is positive, i.e. has the sign opposite to the
bare charge density −σ. The concentration N0 is very
small because |µW C |/kB T ≫ 1. Therefore, it is easy to
achieve charge inversion. According to Eq. (12) at large
enough N one can neglect second term of the right side
of Eq. (11). This gives for the maximal inverted charge
density
(8)
where the four terms are responsible, respectively, for the
self interaction of the charged plane, for the interaction
between Z-ions and the plane, for pair interactions between Z-ions and for the entropy of ideal two-dimensional
gas of Z-ions. Using Eq. (2) one can rewrite Eq. (8) as
F = π(σ ∗ )2 rs /D + FOCP ,
(9)
σ∗ =
where FOCP = Fc + Fid is the free energy of the same
system of Z-ions residing on a neutralizing background
with surface charge density −Zen, which is conventionally referred to as one component plasma (OCP), and
Fc = −π(Zen)2 rs /D + FZZ
(10)
ε(n) = −(2 − 8/3π)Z 2 e2 /RD ≃ −1.15Z 2e2 /RD, (15)
where R = (πn)−1/2 is the radius of a Wigner-Seitz cell.
A more accurate calculation18 gives slightly higher energy:
ε(n) ≃ −1.11Z 2e2 /RD = −1.96n1/2Z 2 e2 /D.
(11)
µW C =
∂ [nε(n)]
Z 2 e2
= −1.65ΓkB T = −1.65
.
∂n
RD
(17)
We see now that µW C is negative and |µW C | ≫ kB T ,
so that Eq. (14) is justified. Substituting Eq. (17) into
Eq. (14), we get σ ∗ = 0.83Ze/(πrs R). At rs ≫ R, charge
density σ ∗ ≪ σ, and Zen ≃ σ, one can replace R by
R0 = (σπ/Ze)−1/2 . This gives
(12)
where Ns ∼ n/a is the bulk concentration of Z-ions at
the plane. Then Eq. (11) can be rewritten as
2πσ ∗ rs Ze/D = kB T ln(N/N0 ),
(16)
One can discuss the role of a finite temperature on
WC in terms of the inverse dimensionless temperature
Γ = Z 2 e2 /(RDkB T ). We are interested in the case of
large Γ. For example, at a typical Zen = σ = 1.0 e/nm2
and at room temperature, Γ = 10 for Z = 4. Wigner
crystal melts19 at Γ = 130, so that for Γ < 130 we deal
with a strongly correlated liquid. Numerical calculations,
however, confirm that at Γ ≫ 1 thermodynamic properties of strongly correlated liquid are close to that of
WC20 . Therefore, for an estimate of µc we can still write
Fc = nε(n) and use
As we show below, in most practical cases the correlation effect is rather strong, so that µc is negative and
|µc | ≫ kB T . Furthermore, strong correlations imply that
short range order of Z-ions on the surface should be similar to that of triangular Wigner crystal (WC) since it
delivers the lowest energy to OCP. Thus one can substitute the chemical potential of Wigner crystal, µW C , for
µc . One can also write the difference of ideal parts of the
bulk and the surface chemical potentials of Z-ions as
µb − µid = kB T ln(Ns /N ),
(14)
Eq. (14) has a very simple meaning: |µW C |/Ze is the
”correlation” voltage which charges two above mentioned
parallel capacitors with ”distance between plates” rs and
total capacitance per unit area D/(2πrs ).
To calculate the correlation voltage |µW C | /Ze, we
start from the case of weak screening when rs is larger
than the average distance between Z-ions. In this case,
screening does not affect thermodynamic properties of
WC. The energy per Z-ion ε(n) of such Coulomb WC at
T = 0 can be estimated as the energy of a Wigner-Seitz
cell, because quadrupole-quadrupole interaction between
neigbouring neutral Wigner-Seitz cells is very small. This
gives
is the correlation part of FOCP . The transformation from
Eq. (8) to Eq. (9) can be simply interpreted as the addition of uniform charge densities −σ ∗ and σ ∗ to the
plane. The first addition makes a neutral OCP on the
plane. The second addition creates two planar capacitors
with negative charges on both sides of the plane which
screen the inverted charge of the plane at the distance
rs (Fig. 3a). The first term of Eq. (9) is nothing but
the energy of these two capacitors. There is no cross
term corresponding to the interactions between the OCP
and the capacitors because each planar capacitor creates
a constant potential, ψ(0) = 2πσ ∗ rs /D, at the neutral
OCP.
Using Eq. (10), the electrochemical potential of Z-ions
at the plane can be written as µ = Zeψ(0) + µid + µc ,
where µid and µc = ∂Fc /∂n are the ideal and the correlation parts of the chemical potential of OCP. In equilibrium, µ is equal to the chemical potential, µb , of the ideal
bulk solution, because in the bulk electrostatic potential
ψ = 0. Using Eq. (9), we have:
2πσ ∗ rs Ze/D = −µc + (µb − µid ).
D |µW C |
.
2πrs Ze
σ ∗ /σ = 0.83ζ 1/2 ,
(13)
5
(ζ ≪ 1),
(18)
√
where A = (2/ 3)1/2 n−1/2 is the lattice constant of this
WC. Minimizing this free√energy with respect to n one
gets A ≃ rs ln ζ, R ≃ (2π/ 3)1/2 rs ln ζ and
where ζ = Ze/πσrs2 is the dimensionless charge of a Zion. Thus, at rs ≫ R or ζ ≪ 1, inverted charge density
grows with decreasing rs . Extrapolating to rs = 2R0
where screening starts to modify the interaction between
Z-ions substantially, we obtain σ ∗ = 0.4σ.
Now we switch to the case of strong screening, rs ≪ R,
or ζ ≫ 1. It seems that in this case σ ∗ should decrease
with decreasing rs , because screening reduces the energy
of WC and leads to its melting. In fact, this is what
eventually happens. However, there is a range of rs ≪ R
where the energy of WC is still large. In this range, as rs
decreases, the repulsion between Z-ions becomes weaker,
what in turn makes it easier to pack more of them on the
plane. Therefore, σ ∗ continues to grow with decreasing
rs .
Although we can continue to use the capacitor model
to deal with the problem, this model loses its physical
transparency when rs ≪ R, because there is no obvious
spatial separation between the inverted charge σ ∗ and its
screening atmosphere. Therefore, at rs ≪ R, we deal directly with the original free energy (8). The requirement
that the chemical potential of Z-ion in the bulk solution
equals that of Z-ions at the surface now reads
∂F
= µid − µb ,
∂n
σ∗
2πζ
=√
,
σ
3 ln2 ζ
(24)
It is clear from Eq. (24) that at rs ≪ R, or ζ ≫ 1 the
distance R decreases and inverted charge continues to
grow with decreasing rs . This result could be anticipated
for the toy model of Fig. 1a if the Coulomb interaction
between the spheres is replaced by a strongly screened
one. Screening obviously affects repulsion between positive spheres stronger than their attraction to the negative
one and, therefore, makes it possible to keep two Z-ions
even at Q ≪ Ze.
Above we studied analytically two extremes, rs ≫ R
and rs ≪ R. In the case of arbitrary rs we can find σ ∗ numerically. Indeed, minimizing the free energy (20) with
the help of Eq. (22) one gets
(19)
1
=
ζ
where
F =−
(ζ ≫ 1).
2πσrs Zen
+ FZZ
D
r i =0
3 + ri /rs −ri /rs
e
8 ri /rs
,
(25)
(20)
is the interaction part of the total free energy (8) apart
from the constant self-energy term πσ 2 rs /D. According
to Eq. (12), at large N when
µb − µid = kB T ln(Ns /N ) ≪ 2πσrs Ze/D ,
where the sum over all vectors of WC lattice can be evaluated numerically. Using Eq. (25) one can find the equilibrium concentration n for any given value of ζ. The
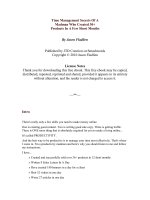
resulting ratio σ ∗ /σ is plotted by the solid curve in Fig.
5.
(21)
we can neglect the difference in the ideal part of the free
energy of Z-ion at the surface and in the bulk. Therefore, the condition of equilibrium (19) can be reduced
to the problem of minimization of the free energy (20)
with respect to n. This direct minimization has a very
simple meaning: new Z-ions are attracted to the surface,
but n saturates when the increase in the repulsion energy
between Z-ions compensates this gain. Since this minimization balances the attraction to the surface with the
repulsion between Z-ions, the inequality (21) also guarantees that thermal fluctuations of Z-ions around their
WC positions are small. Therefore, FZZ can be written
as
Ê
ắ
ẵ
ẳ
ẳ
ắ
2
FZZ =
r i =0
(Ze) −ri /rs
e
Dri
,
(22)
FIG. 5. The ratio σ ∗ /σ as a function of the dimensionless charge ζ = Ze/πσrs2 . The solid curve is calculated for a
charged plane by a numerical solution to Eq. (25), the dashed
curve is the large rs limit, Eq. (18). The dotted curve is calculated for the screening of the surface of the semispace with
dielectric constant much smaller than 80. In this case image
charges (Fig. 3b) are taken into account (See Sec. IV).
where the sum is taken over all vectors of WC lattice. At
rs ≪ R, one needs to keep only interactions with the 6
nearest neighbours in Eq. (22). This gives
F =−
(Ze)2
2πσrs Zen
+ 3n
exp(−A/rs ),
D
DA
(23)
6
this situation, our theory needs a couple of modifications.
Specifically, in the first term of Eq. (23) we must take into
account the fact that only a part of a Z-ion interacts with
the surface, namely the segment which is within the distance rs from the surface. Therefore, at rs ≪ a results
depend on the shape of ions and distribution of charge.
If the bare charge of Z-ion is uniformly distributed on
the surface of a spherical ion this adds small factor rs /2a
to µW C and the right side of Eq. (27). This gives
III. CONDENSATION OF MONOVALENT
COIONS ON Z-ION. ROLE OF FINITE SIZE OF
Z-ION.
We are prepared now to address the question of maximal possible charge inversion. How far can a macroion
be overcharged, and what should one do to achieve that?
We see below that to answer this questions one should
take into account the finite size of Z-ions.
Fig. 5 and Eq. (24) suggest that the ratio σ ∗ /σ continues to grow with growing ζ. However, the possibilities
to increase ζ are limited along with the assumptions of
the presented theory. Indeed, there are two ways to increase ζ = Ze/πσrs2 , namely to choose a surface with a
small σ or to choose Z-ions with a large Z. The former
way is restricted because, according to Eq. (21), Z-ion
remains strongly bound to the charged plane only as long
as 2πrs σZe/D ≫ kB T s where
s = ln(Ns /N )
ζmax = Z 2 lB /sa .
One should also take into account that at a ≫ rs Eq. (29)
should be replaced by
Z = a2 /rs lB ,
ζ ≪ ζmax = 2Z lB /srs .
(26)
ζmax =
(27)
(28)
where Ze2 /aD is the potential energy of a monovalent
coion at the external boundary of the condensation atmosphere (”surface”) of Z-ion and kB T ln(N1,s /N1 ) is
the difference between the chemical potentials of monovalent coions in the bulk and at the Z-ion’s surface,
N1,s ∼ Z/a3 is the concentration of coions at the surface layer. Eq. (28) gives
Z = (2a/lB ) ln (rs /a) .
(29)
rm = a exp(R/3.3a).
Using Eq. (29) and Eq. (27), we arrive at
ζmax
rs
8a2
ln
=
slB rs
a
2
, (rs ≫ a).
2a3
, (rs ≪ a).
slB rs2
(33)
˚, rs = 10˚
For a = 20A
A, lB = 7˚
A and s = 3 we get
ζmax ≃ 8 so that the inversion ratio can be as large as 3.
Let us consider now a special case of the compact Zion when it is a short rod-like polyelectrolyte of length
L < R and radius a < rs . Such rods lay at the surface of
macroion and form strongly correlated liquid reminding
WC, so that one can still start from Eq. (27). In this
case, however, Eqs. (29) and (32) should be replaced by
Z ∼ Lηc /e = L/lB . Thus, ζmax = 2R2 /slB rs and can be
achieved at L ∼ R.
We conclude this section going back to spherical Z-ions
and relatively weak screening. Until now we used everywhere the Debye-Hă
uckel approximation for description
of screening of surface charge density σ ∗ by monovalent
salt. Now we want to verify its validity. Theory of Sec.
II requires that the correlation voltage applied to capacitors |µW C |/Ze is smaller than kB T /e. Using Eqs. (14)
and (17) one can rewrite this condition as Z < R/1.65lB .
Substituting Z from Eq. (29) we find that one can use
linear theory only when rs < rm , where
Therefore, the latter way, which is to increase Z, is really the most important one. The net charge Z of a Z-ion
is, however, restricted because at large charge Z0 of the
bare counterion monovalent coions of the charged plane
(which have the sign opposite to Z-ions) condense on the
Z-ion surface14 . Assuming that Z-ions are spheres of the
radius a, their net charge, Z, at large Z0 can be found
from the equation
Ze2 /aD = kB T ln(N1,s /N1 ),
(32)
which follows from the condition that potential at the
surface of Z-ion Ze2 /aD − Ze2 /(a + rs )D is equal to
kB T ln(N1,s /N1 ). Substituting Eq. (32) to Eq. (31) we
find that ζmax is larger than that given by Eq. (30),
namely
is the entropy loss (in units of kB ) per Z-ion due to its
adsorption to the surface. This gives for ζ:
2
(31)
(34)
For a large R/2a, the maximal screening radius of linear
theory, rm , is exponentially large. Nonlinear theory for
rs > rm is given in Sec. VII.
(30)
In the theory presented in Sec. II, the radius of Z-ion, a,
was the smallest length, even smaller than rs . Therefore,
the largest a we can substitute in Eq. (30) is a = rs . For
rs = a = 10˚
A and s = 3 we get ζmax ≃ 4 so that the
inversion ratio can be as large as 2.
Since charge inversion grows with increasing a we are
tempted to explore the case rs ≪ a ≪ R0 . To address
IV. SCREENING OF A THICK INSULATING
MACROION BY SPHERICAL Z-IONS: ROLE OF
IMAGES.
In Sec. II and III we studied a charged plane immersed
in water so that screening charges are on both sides of the
7
can be solved numerically and the results are plotted in
Fig. 5. A remarkable feature of this plot is that, within
2% accuracy, the ratio σ ∗ /σ for the image problem is
equal to a half of the same ratio for the charged plane
immersed in water (for which there are no images). If
we try to interpret this result using Eq. (14) of the capacitor model (Sec. II) we can say that image charges
do not modify the ”correlation” voltage |µW C |/Ze. The
only substantial difference between two cases is that for
the thick macroion, instead of charging two capacitors,
one has to charge only one capacitor (on one side of the
surface) with capacitance per unit area D/4πrs
The fact that image charges do not modify the ”correlation voltage” can be explained quite simply in the case
of weak screening rs ≫ R0 . In this limit, expanding the
free energy (37) to the first order in d/rs , we get
plane (Fig. 3a). In reality charged plane is typically a
surface of a rather thick membrane whose (organic) material has the dielectric constant D1 much less than that
of water D1 ≪ D. It is well known in electrostatics that
when a charge approaches the interface separating two
dielectrics, it induces surface charge on interface. The
potential created by these induced charges can be described as the potential of an image charge sitting on the
opposite site of the interface (Fig. 3b). At D1 ≪ D,
this image charge has the same sign and magnitude as
the original charge. Due to repulsion from images, Zions are pushed off the surface to some distance, d. One
can easily find d in the case of a single Z-ion near the
charged macroion in the absence of screening (rs = ∞).
The d-dependent part of the free energy of this system is
F = 4πσZed/D + (Ze)2 /4Dd.
(35)
F = nε(n) +
Here the first term is the work needed to move Z-ion
from the surface to the distance d, and the second term
is the energy of image repulsion. The coefficient 4π (instead of 2π) in the first term accounts for the doubling of
the plane charge due to the image of the plane. The ion
sits at distance d = d0 which minimizes the free energy
of Eq. (35). Solving ∂F/∂d = 0, one gets
d0 =
1
4
R0
Ze
=
.
πσ
4
The physical meaning of this equation is quite clear. The
first two terms are energies of the WC and of its interaction with the image WC (φW C (n, 2d) is the potential
of a WC with charge density Zen at the location of an
image of Z-ion.) The third term is the capacitor energy
created by the charge of WC and the plane charge. And
the final term is the usual energy of a capacitor made by
the WC and the screening atmosphere.
At σ ∗ /σ ≪ 1 minimization of Eq. (39) with respect
to d gives the optimum distance d0 = 0.3R0 , which is a
little larger than the estimate (36). Minimization with
respect to n gives an equation similar to Eq. (14)
(36)
In the presence of other counterions on the surface, the
repulsive force is stronger, therefore one expects that d0
is a little larger than R0 /4.
To consider the role of all images and finite rs , let us
start from the free energy per unit area describing the
system:
4πσrs Zen −d/rs n
+
e
F =−
D
2
+
n
2
2
(Ze)
ri
D
ri2
+
4d2
σ∗ =
2
(Ze) −ri /rs
e
Dri
r i =0
e−
√
ri2 +4d2 /rs
,
∂F
= 0,
∂n
D |µW C |
,
4πrs Ze
(40)
where µW C differs from the corresponding value in the
case of immersed plane (Eq. (17)) only by:
(37)
δµW C =
where, as in Eq. (22), the sums are taken over all vectors of the WC lattice. The four terms in Eq. (37) are
correspondingly the self energy of the plane, the interaction between the plane and the Z-ions, the interaction
between Z-ions (the factor 1/2 accounts for the double
counting), and the repulsion between Z-ions and the image charges (the factor 1/2 accounts for the fact that
electric field occupies only half of the space).
At large concentration of Z-ions in the bulk, the difference in the ideal parts of the free energy of Z-ion in
solution and at the surface can be neglected, therefore,
one can directly minimize the free energy (37) to find
the concentration of Z-ions, n, at the surface and the
optimum distance d. The system of equations
∂F
=0,
∂d
2πσ 2 d 2π(σ ∗ )2 rs
n
ZeφW C (n, 2d) +
+
.
2
D
D
(39)
∂ n
ZeψW C (n, 2d0 ) .
∂n 2
(41)
It is known that ψW C (x) decreases exponentially with
x when x > A/2π. Since 2d0 /(A/2π) ≃ 1.8, the potential ψW C (n, 2d0 ) ∝ exp(−2d0 2π/A) and δµW C /|µW C | ≃
(1 − d0 2π
A ) exp(−2d0 /(A/2π)) ≃ 0.02. Thus, at rs ≫
R0 the chemical potential µW C remains practically unchanged by image charges.
In the opposite limit rs ≪ R0 one can calculate the ratio σ ∗ /σ by direct minimization of the free energy, without the use of the capacitor model. Keeping only the
nearest neighbour interactions in Eq. (37) one finds
d0 = rs ln
ζ
8
,
2πζ
πζ
σ∗
≃√
≃ √ 2 .
2 2
σ
3 ln (ζ /10(d/rs ))
2 3 ln ζ
(38)
8
(42)
the other hand, the ”bare” surface charge of DNA is
very large, and its corresponding Gouy-Chapman length
is much smaller than rs . As the result, one needs nonlinear theory for description of the net charge of DNA. It
leads to Onsager-Manning conclusion that positive monovalent ions condense on the surface of DNA reducing its
net charge, −η, to −ηc = −DkB T /e. Far away from
DNA, the linear theory can be used. When DNA rods
condense on the plane, we can still use −ηc as the net
charge density of DNA, because as we will see later, the
strongly screened potential of plane only weakly affects
condensation of monovalent ions on DNA.
Therefore, we can write the free energy per DNA as
Comparing this result with Eq. (24) for the case of immersed plane (no image charges), one gets
ln 10
1
(σ ∗ /σ)image
1+
=
∗
(σ /σ)no image
4
ln ζ
.
(43)
Eq. (43) shows that in the limit ζ → ∞, the ratio
σ ∗ /σ for the image problem actually approaches 1/4 of
that for the problem without image. However, due to
the logarithmic functions, it approaches this limit very
slowly. Detailed numerical calculations show that even
at ζ = 1000, the ratio (43) is still close to 0.5. In practice, ζ can hardly exceed 20, and this ratio is always close
to 0.5 as Fig. 5 suggested.
Although at a given ζ, image charges do not change
the results qualitatively, they, as we show below, reduce
the value of ζmax substantially. As in Sec. III, we find
ζmax from the condition that the bulk electrochemical
potential of Z-ions can be neglected. When images are
present, according to Eq. (37), one need to replace the
right hand side of Eq. (21) by 2πσrs Ze exp(−d0 /rs ). Using Eq. (42), this condition now reads
ζ ≪ ζmax = 4
Z 2 lB /srs
∞
f =−
2πσrs Lηc
2Lηc2
1
+
K0
D
2 i = −∞ D
iA
rs
,
(45)
i=0
where K0 (x) is the modified Bessel function of 0-th order. The first term of Eq. (45) describes the interaction energy of DNA rods with the charged plane, the
second term describes the interaction between DNA rods
arranged in one-dimensional WC, the factor 1/2 accounts
for the double counting of the interactions in the sum.
Since the function K0 (x) exponentially decays at large
x, at rs ≪ A one can keep only the nearest neighbour
interactions in Eq. (45). This gives
(44)
Using Eq. (44) instead of Eq. (27) and using Eq. (29) for
Z we get ζmax ≃ 5 at rs = a = 10˚
A and s = 3. Therefore,
according to the dotted curve of Fig. 5 which was calculated for the case of image charges, the inversion ratio
for a thick macroion can be as large as 100%.
f ≃−
2πσrs Lηc
2Lηc2
+
D
D
πrs
exp(−A/rs ) ,
2A
(46)
which is similar to Eq. (23). To find A, we minimize
the free energy per unit area, F = nf , with respect to n,
where n = 1/LA is the concentration of DNA helices at
the charged plane. This yields:
√
2πσrs
= A/rs exp(−A/rs ).
(47)
ηc
V. LONG CHARGED RODS AS Z-IONS. STRONG
SCREENING BY MONOVALENT SALT.
As we mentioned in Introduction the adsorption of long
rod-like Z-ions such as DNA double helix on an oppositely charged surface leads to the strong charge inversion. In this case, correlations between rods cause parallel ordering of rods in a strongly correlated nematic liquid. In other words, in the direction perpendicular to the
rods we deal with short range order of one-dimensional
WC (Fig. 4).
Consider the problem of screening of a positive plane
with surface charge density, σ, by negative DNA double helices with the net linear charge density −η and the
length L smaller than the DNA persistence length Lp so
that they can be considered straight rods. For simplicity,
the charged plane is assumed to be thin and immersed in
water so that we can neglect image charges. Modification
of the results due to image charges is given later. Here,
the strong screening case rs ≪ A is considered (A is the
WC lattice constant). The weak screening case, rs ≫ A,
is the topic of the next section.
We show below that at rs ≪ A screening radius rs
is smaller than the Gouy-Chapman length for the bare
plane. Therefore, one can use Debye-Hă
uckel formula,
(0) = 2rs /D, for the potential of the plane. On
Calculating the net negative surface charge density,
−σ ∗ = −ηc /A + σ, we obtain for the inversion ratio
ηc /σrs
σ∗
≃
σ
ln(ηc /σrs )
(rs ≪ A).
(48)
As we see from Eq. (47), the lattice constant A of WC decreases with decreasing rs and charge inversion becomes
stronger.
Let us now address the question of the maximal charge
inversion in the case of screening by DNA. Similar to
what was done in Sec. III, the charge inversion ratio is
limited by the condition that the electrochemical potential of DNA in the bulk solution can be neglected and
therefore, DNA is strongly bound to the surface. Using
Eq. (46) and (47), this condition can be written by an
equation similar to Eq. (21)
kB T s ≪ 2πσrs Lηc /D or ηc /σrs ≪ 2πL/slB ,
9
(49)
f (x) ≃ −
2πσrs ηc L 2Lηc2
+
D
D
πrs
cosh
2A
x
rs
£
where s = ln(Ns,DN A /NDN A ) is the entropy loss (in
units of kB ) per DNA due to its adsorption to the surface. Ns,DN A and NDN A are correspondingly the threedimensional concentration of DNA at the charged surface
and in the bulk. Inequality (49) also guarantees that
WC-like short range order of DNA helices is preserved.
To show this, let us assume that the left and right nearest
neighbour rods at the surface are parallel to each other
and discuss the amplitude of the thermal fluctuations of
the central DNA along the axis x perpendicular to DNA
direction (in the limit rs ≪ A, we need to deal only with
two nearest neighbours of the central DNA). At x = 0,
the free energy of the rod is given by Eq. (46). At x = 0
the free energy of the central DNA is
ắ
ẵ
ẳ
ẳ
ẵẳ
ẵ
ắẳ
ệì
FIG. 6. The ratio / as a function of ηc /σrs . The solid
curve is calculated for a charged plane by numerical solution
to Eq. (45). The dotted curve is calculated for the screening
of the surface of the semi-space with dielectric constant much
smaller than 80. In this case image charges are taken into
account.
e−A/rs .
(50)
One can numerically minimize the free energy (45) at
all rs ≤ A to find σ ∗ /σ. The result is plotted by the solid
curve in Fig. 6.
Let us now move to the more realistic case of a thick
macroion, so that repulsion from image charges must be
taken into consideration. As in the spherical Z-ion case,
image charges push the WC off the surface to some distance d. The free energy per DNA rod can be written
as
Using Eqs. (50) and (47), we find the average amplitude, x0 , of the fluctuations of x from the condition
f (x0 ) − f (0) ≃ kB T . This gives x0 ≃ rs ln(Ae/2πσrs2 L).
The inequality (49) then gives:
∞
ηc
ηc
A
≪ A ≃ rs ln
.
x0 < rs ln ≃ rs ln ln
rs
σrs
σrs
4πσrs Lηc −d/rs 1
2Lηc2
f =−
+
e
K0
D
2 i = −∞ D
(51)
iA
rs
i=0
∞
+
1
2Lηc2
K0
2 i=−∞ D
(iA)2 + 4d2
rs
,
(52)
where the three terms on the right hand side are correspondingly the interaction between the plane and the
DNA, between the different DNAs and between the
DNAs and their images.
The equilibrium distance d0 and A can be obtained by
minimizing the free energy per unit area F = nf with
respect to d and n = 1/LA:
Thus, DNA helices preserve WC-like short range order
when the condition (49) is met.
This condition obviously puts only a weak restriction
on maximum value of σ ∗ /σ. At L = Lp = 50 nm and
s = 3, the parameter ηc /σrs can be as large as 75 and, according to Eq. (48) the ratio σ ∗ /σ can reach 15. Therefore, we can call this phenomenon strong charge inversion.
∂F
=0,
∂d
This limit can be easily reached at a very small σ. On
the other hand, if we want to reach it making rs very
small we have to modify this theory for the case when rs
is smaller than the radius of DNA. In a way, this is similar to what was done in Sec. 3 for spherical Z-ions. At
rs ≪ a one replaces the net charge of DNA, ηc by ηc a/rs
and adds small factor (rs /π 2 a)1/2 to the first term of Eq.
(46). This modification changes only logarithmic term
of Eq. (48) and does not change our conclusion about
strong charge inversion.
∂F
= 0,
∂n
(53)
This system of equations is solved numerically. The result for σ ∗ /σ is plotted by the dotted curve in Fig. 6. It is
clear that in the case of DNA, at a given value of ηc /σrs ,
image charges play even smaller role than for spherical
Z-ions. The ratio σ ∗ /σ in the case of a thick macroion is
close to 70% of σ ∗ /σ for the charged plane immersed in
water, instead of 50% as in Fig. 5 for spherical Z-ions.
However, like in the case of spherical Z-ions, image
charges modify the maximal possible value of ηc /σrs significantly. When images are present, according to Eq.
10
(52), one need to replace in Eq. (49) 2πσrs Lηc /D by
2πσrs Lηc exp(−d0 /rs ). Therefore, the condition that the
bulk ideal chemical potential can be neglected and, therefore, DNA is strongly bound at the surface has the form
kB T s ≪ 2πσrs Lηc exp(−d0 /rs ) .
(54)
Similarly to what was done above for the problem of
charged plane immersed in water one can show that Eq.
(54) guarantees, also, WC-like short range order of DNA
helices. In the limit ηc ≫ σrs , keeping only the nearest
neighbour interactions in the free energy (52) and minimizing with respect to d one gets d0 ≃ rs ln(ηc /4σrs ).
Substituting d0 into Eq. (54) we arrive at the final form
for the condition of Eq. (49):
ηc /σrs ≪
8πL/slB ,
(L ≤ Lp ).
FIG. 7. A long charged worm-like rods spirals around an
oppositely charged cylinder to screen it. Locally, the picture
resembles that of an one-dimensional WC
In this case, an DNA double helix spirals around the
cylinder. Neighbouring turns repel each other so that
DNA forms an almost perfect coil which locally resembles one-dimensional WC. As a result, the cylinder charge
inverts its sign: density of DNA charge per unit length of
the cylinder becomes larger than the bare linear charge
density of the cylinder. At small rs this charge inversion can be as strong as we discussed above. If cylinder diameter is smaller than DNA persistent length one
should add elastic energy to the minimization problem.
This, of course, will make charge inversion weaker than
for wider cylinders, but still it can be quite large. We
leave open the possibility to speculate on the relevance
of these model systems to the fact that DNA overcharges
a nucleosome by about 15%4 .
A similar problem of wrapping of a weakly charged
polyelectrolyte around oppositely charged sphere was recently studied in the Debye-Hă
uckel approximation in
Ref. 7. A strong charge inversion was found in this case
as well. Charge inversion for a charged sphere screened
by an oppositely charged flexible polyelectrolyte was previously observed in experiment8 and numerical simulations9 .
(55)
It is clear that the maximal ηc /σrs and maximal inversion
ratio grow with L. For L = Lp = 50 nm and s = 3, the
maximal ηc /σrs = 25. Therefore, according to the dotted
curve in Fig. 6, the inversion ratio for a thick macroion
σ ∗ /σ can reach 4. Such inversion can still be considered
as strong.
Until now we talked about relatively short DNA, L ≤
Lp , which can be considered as a rod. For DNA doublehelices of a larger length (L ≫ Lp ) the maximum inversion ratio saturates at the value obtained above at
L = Lp . This happens because even a long DNA can not
be adsorbed at the surface if for L = Lp inequality (55) is
violated. (See the theory of adsorption-desorption phase
transition, for example, in Ref. 21).
On the other hand, if inequality (55) holds at L = Lp ,
i. e. at ηc /σrs ≪ 8πLp /slB , the adsorption of a long
DNA is so strong that DNA lays flat on the charged
surface. Since repulsion between neighbouring parallel
DNA is balanced with attraction to the surface, interactions between parallel DNA helices are so strong that the
same inequality guarantees WC-like short range order at
the length scale Lp , even though DNA length is much
larger than Lp . One can verify this statement studying
lateral fluctuations of a DNA segment with length Lp
similarly to the calculation presented above for the problem of charged plane immersed in water (See Eqs. (50)
and (51)). Thus, our theory and the plots of Fig. 5 are
applicable for a long DNA and, therefore, for any flexible
polyelectrolyte.
VI. LONG CHARGED RODS AS Z-IONS. WEAK
SCREENING BY MONOVALENT SALT
In this section, we consider screening of a positively
charged plane by DNA rods in the case of weak screening,
when rs ≫ A. We saw in Sec. II that when the screening
radius is larger than the lattice constant of WC, the capacitor model provides a transparent description of the
charge inversion. Here we adopt this model, too. However, we find out that in the case of rods, the inversion
charge σ ∗ is so large that its screening by monovalent salt
is nonlinear. In other words, at rs ≫ A, the capacitors
described in Sec. II becomes nonlinear. Correspondingly
in this case one has to use the solution of the nonlinear
PB equation for the plane potential:
To conclude this section, we would like to mention another charge inversion problem similar to the problem
we considered here. Giant charge inversion can be also
achieved if a single very long DNA double helix screens
a long and wide positively charged cylinder with radius
greater or about the double helix DNA persistence length
(Fig. 7).
ψ(0) ≃ −(2kB T /De) ln(rs /λ).
11
(56)
where λ = e/πσ ∗ lB is the Gouy-Chapman length. It is
shown below that A ≪ λ ≪ rs so that the use of Eq.
(56) is justified.
The weak screening of the plane potential has also another important consequence. The net charge density of
DNA, −η, ceases to be equal to to the Onsager-Manning
critical density −ηc . The charge of the plane forces DNA
to release some of monovalent coions condensed on it, so
that η becomes larger than ηc . Thus, in this case, we have
to deal with a nonlinear problem with two unknowns, η
and σ ∗ .
One can find these unknowns from the two following
physical conditions of equilibrium. The first one requires
that the chemical potential of positive monovalent ions
(coions) in the bulk of solution is equal to the chemical
potential of coions condensed on the surface of DNA rods
which, in turn, are adsorbed on the plane. The second
condition requires that the chemical potentials for DNA
rods in the bulk solution and DNA rods of the surface
WC are equal. Let us write the first condition as
kB T ln
2eη
N1,s
= −eψ(0) +
ln(A/2πa),
N1
D
voltage ψ(0). The new second and third terms on the
right hand side are due to the change in the net charge
of DNA, when it condenses on the plane. Specifically,
the second term is the gain in the entropy of monovalent
salt released and the third term is the loss in the self
energy of DNA when its net charge changes from −ηc in
the bulk solution to −η at the plane surface. Here λ is
the screening length near the plane surface. (This can
be seen from the fact that the three-dimensional concentration of monovalent salt at the surface is of the order
N1,s ∼ σ ∗ /2eλ and the corresponding screening length
rs,surf = (4πN1,s lB )−1/2 ∼ (2λe/πσ ∗ lB )1/2 ∼ λ.)
A formal derivation of Eq. (60) is given in the end of
this section.
The free energy per DNA of the one-dimensional WC
of DNA rods at the surface can be written similarly to
Eq. (45) with the screening length rs replaced by λ,
f =−
(57)
N1,s
2eηc rs
=
ln .
N1
D
a
≃−
rs
rs
A
= ηc ln + η ln
.
a
λ
2πa
iA
λ
(61)
Lη 2 2πλ
∂[nf ]
≃−
ln
,
∂n
D
A
(62)
where n = 1/LA is the concentration of DNA at the
charged surface.
Substituting Eqs. (56), (58), and (62) into Eq. (60),
we arrive at the second equation for η and λ
2ηηc ln
(58)
rs
rs
A
rs
= −ηc2 ln − η 2 ln
+ 2ηc η ln .
λ
a
2πa
a
(63)
Solving Eqs. (59) and (63) together with A = η/(σ +σ ∗ ),
we get
η ≃ ηc
(59)
ln
Lηψ(0) = |µW C | +
−
i=−∞, i=0
2η
K0
D
Lη
2πλ
ln
.
D
A
µW C =
The equality of the chemical potential of DNA in the
bulk and of DNA condensed on the plane can be written
in the form similar to Eq. (14)
Lη − Lηc
N1,s
kB T ln
e
N1
2
2
Lη
λ Lηc
rs
.
ln −
ln
D
a
D
a
Lη
This result can be interpreted as the interaction of DNA
with its Wigner-Seitz cell (a stripe with length L, width
A and charge density η/A).
The chemical potential µW C can be easily calculated:
Excluding ln(N1,s /N1 ) from Eqs. (57) and (58) and using Eq. (56) we can write the first equation for λ (which
represents σ ∗ ) and η as
ηc ln
∞
2
where N1 and N1,s are the concentrations of monovalent coion in the bulk and at the DNA surface respectively. The left-hand side of Eq. (57) is the entropy
loss and the right-hand side is the potential energy gain
when monovalent salt condenses on the DNA surface (the
potential at the surface of DNA is the sum of ψ(0), of
the nonlinear plane capacitor made and the potential of
the DNA charged cylinder with radius a and the linear
charge density −η, screened at the distance A/2π, by
neigbouring DNA). Far from the charged plane, DNA
net charge regains its value −ηc , the condition of equilibrium of condensed monovalent coions on isolated DNA
rod with those in the bulk can be written in a way similar
to Eq. (57):
kB T ln
1
2π(η/A)λ
Lη +
D
2
λ
≃
a
ln(rs /a)
,
ln(A0 /2πa)
(64)
rs
A0
ln
,
a
2πa
(65)
ln
where A0 = ηc /σ.
Eq. (65) shows that the theory is self consistent: when
rs ≫ A0 , one has rs ≫ λ ≫ A0 . This justifies the use of
nonlinear potential for the plane. Eq. (64) demonstrates
that η ≫ ηc as we anticipated. Eq. (64), of course, is
valid only if η ≤ η0 , where η0 is bare linear charge density
of DNA.
(60)
As in Eq. (14), we see that a ”correlation voltage”,
|µW C |/Lη, charges two capacitors consisting of the overcharged plane and its screening atmosphere to a finite
12
The ratio σ ∗ /σ can now be easily calculated by substituting λ = e/πσ ∗ lB into Eq. (65). One arrives at Eq. (6)
which shows that the ratio σ ∗ /σ increases as rs decreases,
but remains smaller than unity. When rs ∼ A0 one finds
from Eqs. (64) and (65) that η ∼ ηc , λ ∼ rs ∼ A0 , and
σ ∗ /σ ∼ 1, what matches the Eq. (48) obtained for the
strong screening limit (rs ≪ A).
Let us now present a derivation of Eq. (60). To calculate the free energy of the system we use the standard
charging procedure described, for example, in Ref. 22 and
used for DNA in Ref. 23,24. First, let us start by calculating the electrostatic free energy of a DNA dissolved
in solution, which can be written as the work needed to
charge the DNA up to the bare value η0 per unit length
and nonlinear charging regime is played by the net charge
η. We calculate the total free energy of the system by
first charging the plane surface to σ and DNA to η respectively, then continue charging the DNA from η to
the final value η0 . The first charging process leads to the
standard contribution
Lηψ(0) + µW C +
to the chemical potential of DNA, where the three terms
result from, correspondingly, the capacitor energy of the
screening atmosphere, the correlation energy of DNA and
the self energy of DNA. The second charging process
builds up the condensation layer around each DNA and
gives a contribution
η0
φ(η ′ )dη ′ ,
f =L
(66)
η0
0
φ(η)dη =
η
where φ(η ′ ) is the self consistent surface potential of DNA
when its charge is η ′ per unit length. Following Ref. 24,
let us divide this charging process in two steps. First,
the DNA is charged from 0 up to ηc . In this step, one
can use for ( ) the linear (Debye-Hă
uckel) potential
φ(η ′ ) =
Lη 2 λ L2ηc η0
a
ln +
ln
D
a
D
Λ(η0 )
L2ηc
rs
+
(η0 − η) ln .
(70)
D
a
Lηψ(0) + µW C +
2η
2η K0 (a/rs )
≃
ln(rs /a), (rs ≫ a).
D K1 (a/rs )a/rs
D
(67)
Equating this expression to the chemical potential of
DNA in the bulk (Eq. (69)) one gets the desired Eq.
(60).
So far, we have dealt only with the screening of charged
surface by DNA double helices which are highly charged
polyelectrolytes. The situation is simpler if one deals
with weakly charged polyelectrolytes whose bare charge
density η0 is much smaller than ηc . In this case, there
is no condensation on the polyelectrolyte. Therefore η0
plays the role of the net charge ηc . In the weak screening
case, rs ≫ η0 /σ, this brings about small changes in Eq.
(60), which now reads:
In the next step, DNA is charged from ηc to η. In this
step, one has to use nonlinear potential for φ(η ′ ). It can
be written as a sum
φ(η ′ ) = 2
kB T
a
2ηc rs
ln
+
ln
,
′
De
Λ(η )
D
a
(68)
where the first term is the contribution of the interval
2a > r > a of the distances r from the DNA axis. In this
interval potential can be approximated by that of the
charged plane with charge density η ′ /2πa. It has GouyChapman form with the corresponding Gouy-Chapman
length Λ(η ′ ) = aηc /η ′ < a. The second term in Eq. (68)
is the contribution of interval ∞ > r > 2a, where we deal
with a cylinder of radius a and linear net charge density
−ηc . Now, we can calculate the free energy of a DNA
rod (which is also the chemical potential of DNA in the
bulk solution, apart from an ideal part):
=
0
2
Lηc
D
Lη0 ψ(0) = |µW C | −
λ ≃ rs exp
φ(η ′ )dη ′
φ(η ′ )dη ′ + L
Lη02 λ Lη02 rs
ln −
ln
D
a
D
a
.
(71)
Substituting Eq. (56) and (62) into Eq. (71), and solving
for λ, we get
η0
ηc
f =L
2ηc η0
a
2ηc
rs
ln
+
(η0 − η) ln
D
Λ(η0 )
D
a
where the nonlinear potential of Eq. (68) was used.
The chemical potential of DNA on the charged surface
is the sum of the two above contributions:
′
′
Lη 2 λ
ln
,
D
a
η0
η0
ln
ηc σrs
(rs ≫ η0 /σ).
(72)
ηc
ln
Nonlinear effects are important when λ ≪ rs , or when
the exponent in the above expression becomes less than
−1. This gives the minimal rs at which nonlinear effects
are still important.
rs
L2ηc η0
a
L2ηc
rs
+
ln
+
(η0 − ηc ) ln .
a
D
Λ(η0 )
D
a
(69)
In the Onsager-Manning condensation theory, one can
think of the last two terms in the above expression as
the free energy of the condensation layer.
When DNA rods are adsorbed on the surface of the
macroion, the role of ηc as a border between the linear
rm = (η0 /σ) exp(ηc /η0 ) .
(73)
As we see, rm is exponentially large at ηc /η0 ≫ 1.
This makes this weak screening case practically unimportant. At smaller, more realistic value of rs , one can
13
use Debye-Hă
uckel linear theory to describe the potential
of the plane. For rs < η0 /σ, this has been done in Ref. 6.
The result is an expression similar to Eq. (48) with the
net charge ηc replaced by the bare charge η0 .
at the charged surface and in the bulk solution are equal.
In the close analogy with Eq. (60) of Sec. VI, we can
write
N1s
Ze ψ(0) = |µW C | + (Z − Zc )kB T ln
N1
2
2 2
(Z − Z )e
+ b
.
(77)
2aD
The second and third terms on the right-hand side account for the fact that monovalent ions are released when
Z-ions condense on the plane surface (so that their entropy is gained) and simultaneously the self energy of
the Z-ion is reduced. Using Eqs. (17), (56) and (74) we
obtain the second equation for Z and λ
VII. NONLINEAR SCREENING OF A CHARGED
SURFACE BY SPHERICAL Z-IONS.
Let us now return to the screening of the charged plane
by spherical Z-ions in the case when screening by monovalent salt is very weak. Our goal is to understand what
happens when screening radius is larger than rm (see Eq.
(34)), so that Debye-Hă
uckel approximation of Sec. II for
the description of screening of surface charge density σ ∗
by monovalent salt fails and a nonlinear description is
necessary.
The nonlinearity of screening leads to two important
changes in the theory in Sec. II. First, the monovalent
coions condense on the surface of the Z-ion and reduce its
apparent charge. We discussed this condensation in Sec.
III, but used for the net charge of Z-ion the value obtained for isolated Z-ion in the bulk solution (Eq. (28)).
In this section we call this charge Zc (this quantity plays
a similar role as ηc in previous section) and save notation
Z for the net charge of Z-ion absorbed at the charged surface as a part of the WC. When positive Z-ions condense
on the negative surface, a fraction of monovalent negative ions, condensed on the Z-ions is released. Therefore,
strictly speaking, Z > Zc . The charge Zc can be found
from Eq. (28), which in the revised notation reads
Zc e
N1,s
e
.
= kB T ln
aD
N1
rs
1.65(Ze)2 (Z − Zc )Zb e2
=
+
λ
RD
aD
(Zb2 − Z 2 )e2
.
+
2aD
Solving Eqs. (76) and (78) we get
2kB T Z ln
0.56 a
Z
≃1+
Zc
R
2.2 Ze
+ ψ(0)
RD
= kB T ln
λ = rs exp −
ln
.
(80)
N1s
rs
= 2 ln
.
N
a
Therefore
λ = rs exp −
1.65a rs
ln
R
a
.
(81)
Nonlinear effects are important when λ ≪ rs , or when
the exponent in the above expression becomes less than
−1. This gives the minimal rs at which nonlinear effects
are still important
rm = a exp(R/1.65a),
(82)
which matches the estimate Eq. (34) obtained from the
side of the linear regime.
The ratio σ ∗ /σ can be easily calculated from Eq. (80)
(75)
σ∗
1.65a rs
e
exp −
=
ln
σ
πσlB rs
R
a
−1.65a/R
e
rs
=
∝ rs−(1+1.65a/R) .
πσlB rs a
The term in the parentheses is the total potential of the
plane and other adsorbed Z-ions at the considered Z-ion.
This potential is the sum of the negative potential of WC
and the potential due to the positive net charge σ ∗ of
the plane given by Eq. (56). Excluding kB T ln(N1,s /N1 )
from Eqs. (74) and (76) we obtain the first equation for
two unknowns Z and λ, which is similar to Eq. (59):
Ze2
2.2 Ze2
Zb e2
−
+ 2kB T ln(rs /λ) =
.
aD
RD
aD
1.65a N1s
ln
2R
N1
Approximating N1,s as N1,s ∼ Z/a3 , we get
(74)
N1,s
.
N1
(79)
and
Here, as in Sec. III, N1,s is the concentration of monovalent negative ions at the external boundary of the condensation atmosphere of the isolated spherical Z-ion. The
net charge of a Z-ion in WC, Z, can be found from the
condition of equilibrium of monovalent negative ions condensed on a Z-ion of the WC and those in the bulk solution
Ze2
−e
aD
(78)
(83)
Once again, this ratio increases as rs decreases25. Comparing Eq. (83) to Eq. (18), we see that nonlinear effects
change the exponent in the dependence of σ ∗ /σ on rs by
1.65a/R ≪ 1. Taking into account the fact that it is
important only when rs is greater than an exponentially
large critical value rm (see Eq. (82)), one can conclude
from this section that, in practical situation, non-linear
effects in the problem of screening of a charged surface
by spherical Z-ions are not important.
(76)
To write the second equation for these unknowns we start
from the condition that the chemical potentials of Z-ion
14
counterion is a disk with radius R = (π/n)1/2 . The negative heads concentrate around the counterion and make
a negative disk with radius R− < R and charge density
2
−σ− where σ− = σ/nπR−
≥ σ. The rest of the cell
is occupied by neutral heads (Fig. 5). The fraction of
2
negative heads f 2 = R−
/R2 is fixed for each membrane.
The uniform charge case is recovered when there are no
neutral heads so that R− = R and f = 1.
Let us consider the weak screening case rs ≫ R. Under
the transformation mentioned above, we add a disk with
radius R, density −σ ∗ to the Wigner-Seitz cell to neutralize it. Now, the total energy of a Wigner-Seitz cell is
the sum of the interactions of the Z-ion with two disks of
radiuses R− and R, the self energy of the two disks and
the interaction between the disks:
VIII. SCREENING OF A MACROION WITH A
MOBILE SURFACE CHARGE.
So far we have assumed that the bare surface charges
of the macroion are fixed and can not move. For solid
or glassy surfaces, colloidal particles and even rigid polyelectrolytes, such as double helix DNA and actin, this
approximation seems to work well. On the other hand,
for charged lipid membranes it can be violated. The
membrane can have a mixture of neutral and, for example, negatively charged hydrophilic heads. In a liquid
membrane heads are mobile so that negative ones can
accumulate near the positive Z-ion and push the neutral
heads outside (see Fig. 8). Since the background charges
are now closer to the counterion, one can immediately
predict that the energy of the WC is lower and charge
inversion is stronger than that for the case of an uniform
distribution of negative heads.
R_
R
3
2πZeσ− R−
2πZeσ∗ R 8π (σ− )2 R−
−
+
D
D
3
D
∗ 2 3
σ− σ ∗
8π (σ ) R
drdr ′
+
+
. (84)
3
D
D|r − r ′ |
(R− ) (R)
ε(n) = −
1111111
0000000
0000000
1111111
0000000
1111111
Z
0000000
1111111
0000000
1111111
0000000
1111111
0000000
1111111
The integrations in the last term are taken over the disks
with radius R− and R respectively. This last term can
be written as
drdr ′
(R− )
(R)
3
2πσ− σ ∗ R−
σ− σ ∗
=
G(f ),
D|r − r ′ |
D
(85)
where G(f ) is a function of f only and can be evaluated numerically for each value of f (it decreases monotonically from 8/3 at f = 1 to 0 at f = 0). Using
Zen = σ + σ ∗ and Eq. (85), one gets from Eq. (84):
FIG. 8. A Z-ion and its Wigner-Seitz cell with radius R are
shown. The negative heads are concentrated in the shaded
area with radius R− . The rest of the Wigner-Seitz cell is
occupied by the neutral ones.
8
2πσ 2 R3 4
4
(Ze)2
2−
+
+ − f G(f )
RD
3π
D
3f
3
1
f G(f )
8
2πσZeR
− +
1−
.
(86)
+
D
3π f
π
ε(n) = −
To simplify the calculation of the free energy, and gain
more physical insight in the problem, let us use the same
transformation as in the beginning of section II, namely
we simultaneously add uniform planar charge densities
−σ ∗ and σ ∗ to the plane. The first addition makes a
neutral WC on the plane. While the second addition
creates the two planar capacitors. The free energy can
be written as the sum of the energy of WC and two capacitors, in the same way as Eq. (9). Therefore, σ ∗ is
given by Eq. (14).
We use below the Wigner-Seitz approximation to calculate µW C . This approximation gives the energy per ion
of WC as the energy of one Wigner-Seitz cell and neglects
the quadrupole-quadrupole interaction between WignerSeitz cells. It provides 5% accuracy for the energy of the
standard WC on an uniform immobile background (see
Eq. (16)). In the case of mobile charges, as one sees from
Fig. 7, the quadrupole moment of the Wigner-Seitz cell is
even smaller than that for WC on an uniform background
with the same average charge density σ. Therefore, in the
case of mobile charge, the accuracy of the Wigner-Seitz
approximation is even better.
For simplicity, we assume the Wigner-Seitz cell of a
The last two terms is the correction to ε(n) due to the mobility of the surface charge. In the uniform limit, f = 1,
G(f ) = 8/3, these two terms vanish and one gets back the
usual formula for the energy per ion of WC in WignerSeitz cell approximation, Eq. (15).
The chemical potential for a counterion in the mobile
charge case, µW C,m , can be easily calculated as
µW C,m =
∂[nε(n)]
(Ze)2
≃−
∂n
RD
2+
1
4
2f G(f )
+
−
f
3πf
π
(87)
Here σ is approximated by Zen, because at rs ≫ R, the
ratio σ ∗ /σ ≪ 1.
The ratio between chemical potential µW C,m for the
mobile charges and the chemical potential µW C for the
immobile charges has been evaluated numerically as function of the fraction f 2 of the negative heads. The result
is plotted in Fig. 9.
15
.
IX. CONCLUSION
¾
We would like to conclude with another general physical interpretation of the origin of charge inversion. To
do so, let us begin with brief discussion of a separate
physical problem, namely, let us imagine that, instead
of a macroion, a neutral macroscopic metallic particle is
suspended in water with Z- and mono-valent ions. In
this case, each ion creates an image charge of opposite
sign inside the metal and thus attracts to the metal.
Obviously, this effect is by a factor Z 2 stronger for Zions than for monovalent ones. While directly at the
metal surface, energy of interaction of Z-ion with image, −(Ze)2 /4a, is much larger than kB T . Therefore Zions are strongly bound to the metallic surface, making
it effectively charged, while monovalent ions are loosely
correlated with the surface, providing for its screening
over the distances of the order of rs . We can determine
the net charge of metallic particle with bound Z-ions using the ”capacitor model” discussed above. Namely, the
attraction of the Z-ions to their images plays the role of
correlation part of the chemical potential µc and provides
for the voltage Ze/4a which charges a ”capacitor” with
the width rs between metal surface and the bulk solution.
This leads to the result that metal surface is charged with
the net charge density σ ∗ = Zen = Ze/(16πars ). Note
that metallic particle becomes charged due to interactions, or correlations, between Z-ions and their images,
even though the particle itself was neutral in the first
place.
ẽ
ẹ
ẽ
ẵ
ẳ
ẳ
ẳắ
ẳ
ẳ
ẳ
ẵ
ắ
FIG. 9. The ratio between the chemical potentials µW C,m
for the mobile charge case and µW C for the immobile charge
case as a function of the fraction of charged heads f 2 .
Obviously, as f decreases, µW C,m grows as expected.
According to Eq. (14) this means that the inversion ratio
σ ∗ /σ grows with decreasing f , too. We do not continue
the plot in Fig. 9 to very small f 2 because in this case,
the entropy of negative heads plays important role and
screening by negative heads of the membrane can be described in Debye-Hă
uckel approximation26. We do not
consider this regime here.
Let us now move to the limit of strong screening,
rs ≪ R. In this limit, it is more convenient to directly
minimize the free energy, instead of using the capacitor
model. Since rs ≪ R, one needs to keep only the nearest neighbour interactions in the free energy. Assuming
rs ≪ R− , one can write the free energy per unit area as
F = −2πσ− rs Zen + 3n Ze −
σ
n
2
exp(−A/rs )
,
A
(88)
Major results of the present paper can be now interpreted using a similar language of images2,3 . Although
now we consider a macroion with an insulating body, it
has some bare charge σ on its surface, which leads to
adsorption of certain amount of Z-ions. The layer of adsorbed Z-ions plays the role of a metal. Indeed, consider
bringing a new Z-ion to the macroion surface which has
already some bound Z-ions. New Z-ion repels nearest
adsorbed ones, creating a correlation hole for himself. In
other words, it creates an image with the opposite charge
behind the surface. Image attracts the Z-ion, thus providing for the negative µc in Eq. (11) and therefore leading to the charge inversion.
where Ze − σ/n = σ ∗ /n is the charge of one WignerSeitz cell. In Eq. (88), the first term is the interaction of Z-ion with the negative background (the disk
with charge density σ− ), the second term is the interaction between neighbouring Wigner-Seitz cells. As usual,
the quadrupole-quadrupole interaction between WignerSeitz cells is neglected.
Minimizing the free energy (88) with respect to n, one
gets A ≃ rs ln(f 2 ζ) and
σ∗
2πζ
, (ζ ≫ 1).
=√
σ
3 ln2 (f 2 ζ)
(89)
where ζ = Ze/πσrs2 . Comparing to Eq. (24), one can see
that, as in the weak screening case, the inversion ratio
increases due to the mobility of the surface charge.
Theory of this section is based on the assumption that
the charge of Z-ion is so large that it is screened nonlinearly by the disk of opposite charge. One can easily generalize this calculations to rod-like polyelectrolytes and
study the role of a similar stripe of positive hydrofilic
heads attracted by strongly negative DNA. Note that
the idea of nonlinear concentration of charge in membranes with two types of heads has been used recently in
a theory of DNA-cationic lipid complexes27 .
The analogy between the adsorbed layer of Z-ions and
a metal surface holds only at length scales larger than
some characteristic length. In WC this latter scale is
equal to Wigner-Seitz cell radius R. This is why for WC
µc ∼ −(Ze)2 /R (see Eq. (17)). To make |µc | ≫ kB T ,
small enough radius R is needed. This explains why a
significant bare charge σ is necessary to initiate adsorbtion of Z-ions and to create a metallic layer with images
which can lead to charge inversion. From formal point of
view, charge inversion in this case can be characterized
by the ratio σ ∗ /σ, as we did throughout the paper, while
for a neutral metallic particle such ratio is infinite.
16
2
In this paper, we considered adsorption of rigid Z-ions
with the shapes of either small spheres or thin rods. The
concept of effective metallic surface and image based language is perfectly applicable in both cases. It appears
also applicable to the other problem, not considered in
this paper, namely, that of adsorption of a flexible polyelectrolyte on an oppositely charged dielectric macroion
surface28 . To our mind, this idea was already implicitly
used in Ref. 5, which assumes that Coulomb self-energy of
a polyelectrolyte molecule in the adsorbed layer is negligible. This means that charge of the polyelectrolyte
molecule is compensated by the correlation hole, or image. It is the image charge that attracts a flexible polyelectrolyte molecule to the surface. Interestingly, conformations of both the polymer molecule and its image
change when the molecule approaches the surface.
A similar role of images and correlations is actually well
known in the physics of metals. In the Thomas-Fermi approximation (which is similar to PB one) the work function of a metal is zero29 (the work function is an analog
of µc ). The finite value of the work function is known to
result from the exchange and correlation between electrons. For a leaving electron it can be interpreted as
interaction with its image charge in the metal29 .
We believe that interaction with image or, in other
words, lateral correlations of Z-ions in the adsorbed layer
is the only possible reason for a charge inversion exceeding one Z-ion charge (of course, we mean here purely
Coulomb systems and do not speak about cases when
charge inversion is driven by other forces, such as, e.g.,
hydrophobicity). In the Poisson-Boltzmann approximation, when charge is smeared uniformly along the surface,
no charging of neutral metal or overcharging of charged
insulating plane is possible.
V. I. Perel and B. I. Shklovskii, Physica A 274, 446 (1999).
B. I. Shklovskii, Phys. Rev. E60, 5802 (1999).
4
E. M. Mateescu, C. Jeppersen and P. Pincus, Europhys.
Lett. 46, 454 (1999); S. Y. Park, R. F. Bruinsma, and W.
M. Gelbart, Europhys. Lett. 46, 493 (1999);
5
J. F. Joanny, Europ. J. Phys. B 9 117 (1999); P. Sens, E.
Gurovitch, Phys. Rev. Lett. 82, 339 (1999).
6
R. R. Netz, J. F. Joanny, Macromolecules, 32, 9013 (1999).
7
R. R. Netz, J. F. Joanny, Macromolecules, 32, 9026 (1999).
8
Y. Wang, K. Kimura, Q. Huang, P. L. Dubin, W. Jaeger,
Macromolecules, 32 (21), 7128 (1999).
9
T. Wallin, P. Linse, J. Phys. Chem. 100, 17873 (1996);
101, 5506 (1997).
10
P. L. Felgner, Sci. American, 276, (6) 102 (1997).
11
R. Messina, C. Holm, K. Kramer, Private communication.
12
T. T. Nguyen, A. Yu. Grosberg, B. I. Shklovskii, condmat/9912462.
13
R. J. Hunter, Foundations of colloid science, Vol. 1, Oxford
University Press (1986).
14
M. Gueron, G. Weisbuch, Biopolymers, 19, 353 (1980); S.
Alexander, P. M. Chaikin, P. Grant, G. J. Morales, P. Pincus, and D. Hone, J. Chem. Phys. 80, 5776 (1984); S. A.
Safran, P. A. Pincus, M. E. Cates, F. C. MacKintosh, J.
Phys. (France) 51, 503 (1990).
15
Ye Fang, Jie Yang, J. Phys. Chem. B 101, 441 (1997).
16
R. J. Mashl, N. Grứnbech-Jensen, M. R. Fitzsimmons, M.
Lă
utt, DeQuan Li, J. Chem. Phys. B 110, 2219 (1999).
17
G. S. Manning, J. Chem. Phys. 51, 924 (1969).
18
L. Bonsall, A. A. Maradudin, Phys. Rev. B15, 1959 (1977).
19
R. C. Gann, S. Chakravarty, and G. V. Chester, Phys. Rev.
B 20, 326 (1979).
20
H. Totsuji, Phys. Rev. A 17, 399 (1978).
21
A. Yu. Grosberg, A. R. Khokhlov, Statistical Physics of
macromolecules, AIP Press, New York (1994).
22
H. S. Harned, B. B. Owen, Physical chemistry of electrolytic
solutions, Reinhold, New York (1963).
23
M. Fixman, J. Chem. Phys. 70, 4995 (1979).
24
M. Gueron, J.-Ph. Demaret, J. Chem. Phys. 96, 7816
(1992).
25
For a charged plane charge inversion vanishes when rs →
∞. This conclusion, however can not be applied to a finite
size macroion
√ for which excessive charge saturates at the
value 0.84 QZe when rs exceeds the size of the macroion3 .
26
R. Menes, N. Grønbech-Jensen, P. Pincus, condmat/9910223
27
R. Bruinsma, Eur. Phys. J. B 4, 75 (1998).
28
M. Rubinstein, Private communication.
29
N. D. Lang, Solid state physics, Vol. 28, Edited by H.
Ehrenreich, F. Seitz, and D. Turnbull, Academic Press,
New York, 1973
3
ACKNOWLEDGMENTS
We are grateful to R. Podgornik and I. Rouzina for useful discussions. This work was supported by NSF DMR9985985.
1
J. Ennis, S. Marcelja and R. Kjellander, Electrochim. Acta,
41, 2115 (1996)
17