Production of reactive oxygen species by monocyte-derived macrophages from blood of healthy donors and patients with ischemic heart disease
Bạn đang xem bản rút gọn của tài liệu. Xem và tải ngay bản đầy đủ của tài liệu tại đây (84.33 KB, 7 trang )
ISSN 1990-7508, Biochemistry (Moscow) Supplement Series B: Biomedical Chemistry, 2009, Vol. 3, No. 1, pp. 64–70. © Pleiades Publishing, Ltd., 2009.
Original Russian Text © M.V. Bilenko, Yu.A. Vladimirov, S.A. Pavlova, Nguyen Thi Thu Thuy, Tran Thi Hai Yen, 2009, published in Biomeditsinskaya Khimiya.
EXPERIMENTAL
STUDIES
Production of Reactive Oxygen Species by Monocyte-Derived
Macrophages from Blood of Healthy Donors and Patients
with Ischemic Heart Disease
M. V. Bilenkoa*, Yu. A. Vladimirovb, S. A. Pavlovaa, Nguyen Thi Thu Thuya, and Tran Thi Hai Yena
a Orekhovich
Institute of Biomedical Chemistry, Russian Academy of Medical Sciences,
Pogodinskaya ul. 10, Moscow, 119121 Russia; phone: +007 495 246-6980, fax: +007 495 245-0857,
e-mail:
b Faculty of Basic Medicine, Moscow State University, Moscow, 119992 Russia
Received June 23, 2007
Abstract—Production of reactive oxygen species (ROS) by macrophages derived from blood monocytes of
healthy donors (MPN) and patients with ischemic heart disease (IHD) (MPIHD) before, during, and after their
incubation with low-density lipoprotein (LDL) isolated from blood plasma of healthy donors (LDLN) and
patients with a high cholesterol level (LDLH) was investigated by the method of luminol-dependent (spontaneous) and stimulated chemiluminescence (CL) using opsonized zymosan (OZ) or phorbol-12-myristate-13-acetate (PMA) as the CL stimulators. It was shown that proper, luminol-dependent, and zymosan–or PMA-stimulated chemiluminescence of MPIHD was 1.4-, 1.8-, 2.7-, and 1.6-fold higher than the same types of chemiluminescence of MPN, respectively, (p < 0.05–0.01). Although the effect of OZ on MPN and MPIHD was more potent
than that of PMA (by 4.3- and 3.2-fold, respectively), but it appeared in 2.5-3.0 times slower than that of PMA.
LDLN and LDLH incubated with MPN for the first 15 and 60 min caused the 1.4- and 2.5-increase of the luminol-dependent CL of MPN; the same treatment of MPIHD did not influence ROS production by these cells.
Repeated increase in the OZ-stimulated CL of MPN was also observed after preincubation for 15–180 min with
LDLN and LDLH followed by LDL removal, subsequent MPN washing and addition of Hanks solution and OZ;
the repeated increase in OZ-stimulated CL of MPN was only observed after incubation with LDLH than with
LDLN. No increase of CL was observed in experiments with MPIHD. Thus, more intensive chemiluminescence
of macrophages obtained from blood of patients with IHD suggests their in vivo stimulation. LDLN and LDLH
may cause both primary and secondary (after preincubation) stimulating effect on CL of MPN but not of MPIHD.
Thus, the analysis of macrophage chemiluminescence is a sensitive test for evaluation the degree of macrophage
stimulation; it may be effectively used for monitoring of effectiveness of medical treatment of patients.
Key words: human blood monocyte-derived macrophages, ROS, LDL, chemiluminescence, ischemic heart disease, atherosclerosis.
DOI: 10.1134/S1990750809010090
Abbreviations: CL—chemiluminescence; IHD—
ischemic heart disease; LDL—low density lipoproteins; LDLH—LDL from the blood plasma of hypercholesterolemic patients; LDLN—LDL from blood
plasma of healthy donors; MP—macrophages obtained
from human blood; MPIHD macrophages from IHD
patients; MPN—macrophages from healthy donors;
OZ—opsonized
zymosan;
PMA—phorbol-12myristate-13-acetate; ROS—reactive oxygen species;
TBARS—thiobarbituric acid-reactive substances
LDL uptake and metabolism resulting in early atherosclerotic changes in a vascular wall [1, 2]. However, it
is known that both oxidation and uptake of LDL by
macrophages is possible after macrophage stimulation
caused by humoral and physical factors (TNF-α, IL 1-6,
oxLDL, ROS, ischemia, etc.), which may occur both in
vivo and in vitro [3–5]. We have earlier demonstrated
that macrophages derived from blood monocytes of
IHD patients (MPIHD) exhibited more active oxidation
and uptake of LDL than monocyte-derived macrophages from blood of healthy donors (MPN); used of
direct methods provided convincing evidence that the
monocyte-derived macrophages are in vivo stimulated
in IHD patients [6, 7]. Using a chemiluminescent
method, which evaluates initial step and time course of
ROS production by cells (cell) stimulation has also
INTRODUCTION
Macrophages are the major cause of oxidation modification of LDL and they are primarily responsible for
*To whom correspondence should be addressed.
64
ROS PRODUCTION BY BLOOD MACROPHAGES OF HEALTHY DONORS AND IHD PATIENTS
been found in polymorph nuclear leukocytes obtained
from patients and experimental animals with inflammatory and ischemic diseases [8, 9]. However, initial
period and ability for increased ROS production by
macrophages derived from blood monocytes of IHD
patients have not been basically investigated by means
of the CL method.
In this study we have investigated the time-course of
ROS production by macrophages obtained from blood
monocytes of healthy donors and IDH patients (MPN
and MPIHD, respectively). The study employed the CL
method used before, during and after macrophage incubation with LDLN and LDLH. We gave also compared
time course of ROS production by macrophages with
earlier investigated LDL oxidation and macrophage
viability.
MATERIALS AND METHODS
Blood was taken (into plastic tubes containing heparin, 50 U of heparin per 10 ml of blood) before meal
from cubital vein of 19 healthy donors and 15 IHD
patients at the Department of Blood Transfusion, AllRussian Research Center of Surgery, Russian Academy
of Medical Sciences (RRSC). The mean age of healthy
donors and IHD patients was 44 years (the range from
21 to 59 years) and 57 years (the range from 36 to
74 years), respectively. Male patients with IHD represented 93%.
Angina pectoris was diagnosed in 12 patients
(including 7 patients with stable angina pectoris). Its
severity was assessed according to the Canadian Cardiovascular Classification System of Angina Pectoris.
Accompanying arterial hypertension and preceding
myocardial infarction were diagnosed in 7 and 9 patients,
respectively. Left ventricle aneurysm was found in one
patient. All diagnoses were made at the RRSC Cardiology Department.
Monocytes were isolated by centrifugation of blood
layered onto Ficoll-Paque (3 : 5) at 400 g (a Janetzki
K23 centrifuge) for 20 min. The interphase was aspirated and centrifuged for 15 min under the same conditions. Resultant cells, mainly monocytes, were washed
with PBS, diluted with a “growth” medium (RPMI1640 medium supplemented with 10% fetal calf serum,
300 U/ml gentamicin, 2 mM L-glutamine, 1 mM
sodium pyruvate, pH 7.4), and aliquoted (500 µl) into
tubes (d = 10 mm, h = 54 mm). The tubes with cells
were incubated in a CO2 (5% CO2 + 95% air; Assab,
Sweden) at 37°C for 20 h under conditions of high
humidity. LDL preparations (d = 1.019–1.065 g/ml)
were obtained from blood plasma of 12 healthy donors
(LDLN; total plasma cholesterol ranged from 2.6 to
4.4 mM) and 12 patients with hypercholesterolemia
(LDLH, total plasma cholesterol ranged from 6.20 to
8.54 mM). The LDL fractions were isolated by sequential (flotation) ultracentrifugation in NaBr + EDTA gra26
dients (the first gradient: d = 1.019, n D = 1.3363; the
65
26
second gradient: d = 1.065, n D = 1.3445) two times for
2 h at 111000 g using a L8-80 ultracentrifuge and a
Ti-90 rotor (Beckman, USA). The day before use the
LDL preparations containing NaBr and EDTA were
dialyzed against 6000 volumes of 10 mM phosphate
buffer, pH 7.4, without EDTA and antioxidants for 18 h
at +4°C using membrane sacs (Serva, Germany).
Resultant preparations were sterilized by ultrafiltration
through microfilters with a pore size of 0.45 µm (Serva,
Germany). Protein was determined by the method of
Lowry.
The cell cultures of MPN and MPIHD cultivated for
20 h were used for incubation with LDLN or LDLH
(200 µg per 500 µl of medium). Before LDL addition
the “growth” medium was replaced by the “incubation”
medium (RPMI 1640 supplemented with 1 mM sodium
pyruvate and 300 U/ml gentamicin) and after LDL
addition samples were incubated for 15, 60, 180, and
360 min. For CL measurement in freshly prepared MP
cultures the “incubation” medium was replaced for
Hanks solution; in the case of CL measurement during
macrophage incubation with LDLN or LDLH the “incubation” medium was not replaced. For CL measurement in macrophages after certain time intervals of
their incubation with LDLN or LDLH the “incubation”
medium containing LDLN or LDLH was aspirated, macrophages were washed with PBS and Hanks solution
was then added into tubes.
Chemiluminescence was evaluated by means of a
chemiluminometer Lum-5773 (InterOptica, Russia);
data collection and calculation employed a Power
Graph program. In each sample we assayed proper CL
(without additions), luminol-dependent CL (with addition of 20 µM luminol into the incubation medium),
and stimulated CL (after addition of stimulants:
opsonized zymosan (OZ; 0.1 mg/ml) or phorbol-12myristate-13-acetate (PMA; 1 ng/ml)). Chemiluminescence was evaluated by maximal amplitude (V) and
coefficients: luminol-dependent coefficient (ratio of
luminol-dependent CL to proper CL), stimulation coefficient (ratio of OZ-stimulated CL or PMA-stimulated
CL to luminol-dependent CL), and LDL-dependent
coefficient (ratio of LDLN or LDLH-stimulated CL to
luminol-dependent CL).
Thiobarbituric acid-reactive substances (TBARS)
were determined using a Beckman DU-7 spectrophotometer at the absorption maximum wavelength of
532 nm. The content of TBARS was expressed as
amount of malondialdehyde (MDA) using a molar
absorbtion coefficient of 156000 M–1 cm–1. The results
were expressed as nmol of MDA per mg LDL protein
[10].
The number of viable macrophages was estimated
by the number of cells that remained attached to the
tube walls after certain incubation period [11]. The
cells were detached from the tube walls and counted in
a Goryaev chamber.
BIOCHEMISTRY (MOSCOW) SUPPLEMENT SERIES B: BIOMEDICAL CHEMISTRY
Vol. 3
No. 1
2009
66
BILENKO et al.
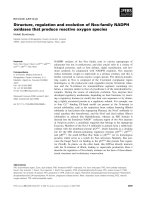
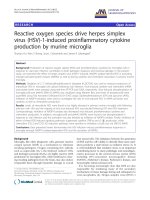
The dependence of OZ-stimulated CL on type and number of macrophages
MP number and CL activity (V)
MP type
100 × 103
200 × 103
0.9 ± 0.29
MPN
3.4 ± 0.85
5.1 ± 1.27
MPIHD
400 × 103
14.5 ±
9.7 ± 1.91*
3.43*##
23.83 ±
2.65**##
1000 × 103
19.9 ± 8.26*
69.7 ± 0.327**##
Notes: Statistical significance between CL activity of particular number of macrophages compared with previous one: * p < 0.05;
** p < 0.01.
Statistical significance between CL activity of MPN and MPIHD using the same number of cells: ## p < 0.01; n (number of independent experiments) is 3.
Experimental data were treated statistically by calculating mean, standard error of the mean (±SEM) and
Students t criterion for small-paired sets.
RESULTS AND DISCUSSION
1. Comparative Analysis of Various Types of CL
in Freshly Prepared Cultures of MPN and MPIHD
Before Their Incubation with LDLN and LDLH.
Table shows CL activity of MPN and MPIHD in
dependence of source and number of cells. At cell number of 200 × 103, 400 × 103, and 1000 × 103 the
CL intensity, V/400 × 103 cells, %
#
oo
40
35
30
oo
25
#
oo
10
oo
5
0
oo
1
2
##
3
MPN
4
1
##
oo
2
3
MPIHD
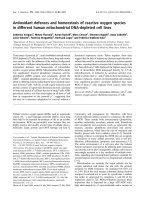
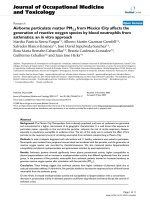
In the first part of this study (Fig. 1) we have compared the values of proper (1), luminol-dependent (2),
PMA-stimulated (3), and OZ-stimulated (4) CL in MPN
and MPIDH without incubation with LDL. These values
of CL (V) were 0.09 ± 0.003; 0.53 ± 0.06; 5.58 ± 1.47;
23.72 ± 2.25, respectively in MPN and 0.13 ± 0.01;
0.96 ± 0.18; 11.61 ± 1.79; 36.87 ± 4.89, respectively in
MPIHD. Thus, these types of CL were 1.4-, 1.8-, 2.7-,
and 1.6-fold higher in MPIHD compared with MPN (#p <
0.05, ##p < 0.01). The coefficients of luminol-dependent
CL in MPN and MPIHD were 5.9 and 7.4 (oop < 0.01), the
coefficients of PMA-stimulated CL were 10.5 and 12.1
(oop < 0.01), and the coefficients of OZ-stimulated CL
were 44.8 and 38.4 (oop < 0.01) for MPN and MPIHD,
respectively.
OZ (0.1 µg/ml) was more potent stimulator of both
MPN and MPIHD and than PMA (1 ng/ml). However,
even this much lower concentration of PMA caused the
more rapid maximal increase of the CL curve (within
10–12 min) compared with OZ (within 30–40 min).
20
15
OZ-stimulated CL of MPIHD was 4.3, 2.5, and 3.5-fold
higher than the OZ-stimulated CL of the same number
of MPN cells, respectively (in all cases ##p < 0.01). The
number of cells of 400 × 103 was sufficien and enough
sensitive and significantly differed from previous and
subsequent cell numbers. The number of MP (of 400 ×
103) was used in all subsequent experiments.
4
Fig. 1. Comparison of intensity of proper (1), luminoldependent (2), PMA-stimulated (3), and OZ-stimulated (4)
chemiluminescence of macrophages isolated from blood of
healthy donors (MPN) and IHD patients (MPIHD) before
their incubation with LDL (V). Note: Statistical significance between the same types of chemiluminescence of
MPIHD and MPN: #p < 0.05; ##p < 0.01. Statistical significance between luminol-dependent and proper CL, activated
types of CL and luminol-dependent CL of MPN and
MPIHD: oop < 0.001. n (number of independent experiments) is 6.
More intensive but slower stimulation of CL by OZ
(compared with PMA) may be attributed to different
mechanisms responsible for their effects on a macrophage. It is known that PMA easily diffuses through
a plasma membrane and irreversibly activated cytosolic protein kinase C, which in its turn activates
NADPH-oxidase; in this case macrophage activation
occurs irrespectively to intracellular concentration of
Ca2+ ions [4, 12]. In contrast to PMA the effects of
zymosan involve its binding to the complement C3
receptors of plasma membrane and macrophage stimulation is realized via the full regulatory cycle, including
changes in intracellular concentration of Ca2+, activation of protein kinase C, tyrosine kinase, and finally
activation of NADPH-oxidase [13]. In subsequent
experiments we stimulated CL only with OZ.
BIOCHEMISTRY (MOSCOW) SUPPLEMENT SERIES B: BIOMEDICAL CHEMISTRY
Vol. 3
No. 1
2009
ROS PRODUCTION BY BLOOD MACROPHAGES OF HEALTHY DONORS AND IHD PATIENTS
2. Comparative Evaluation of Intensity
of the Luminol-dependent CL of MPN and MPIHD
during Their Incubation with LDLN (1) and LDLH (2) for
15–360 min; Comparison of CL
with the Degree of Oxidative Modification of LDL
and Macrophage Viability
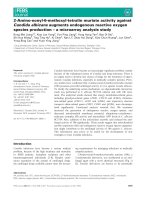
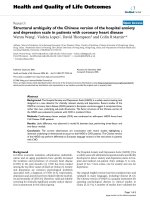
Figure 2 shows results of the second part of this
study. In the absence of MP (control) in the “incubation” medium LDLN (I, 3) and LDLH (I, 4) caused weak
luminol-dependent CL, which remained basically
unchanged or weakly decreased during incubation
within 15–360 min. Before addition of LDLN and
LDLH MPN and MPIHD caused marked luminol-dependent CL (of 0.25 ± 0.04 and 1.08 ± 0.23 V, respectively)
and these values were defined as control (100%). After
addition of LDLN or LDLH to the medium containing
MPN, the increase of luminol-dependent CL was
observed already after incubation for 15 min and significant increase was observed after incubation for 60 min
(by 1.4- and 2.5-fold higher versus control, 1 and 2 lines,
*p < 0.05). Thus, for MPN the coefficients of LDLNand LDLH-stimulated CL were 1.4 and 2.5, respectively. Incubation of MPIHD with LDLN or LDLH for
15–60 min insignificantly influenced the luminoldependent CL and so in contrast to MPN in the case of
MPIHD the coefficients of LDLN- and LDLH-stimulated
CL were basically equal to zero.
Starting from the 180 min incubation of LDLN or
LDLH with MPN and from the 60 min incubation of
LDLN or LDLH with MPIHD there was the decrease in
CL, which was significantly lower than control both in
experiments with MPN (by 2.2–2.6-fold, **p < 0.01)
and with MPIHD (by 4–7-fold, **p < 0.01). The evaluation of the ROS-producing function of macrophages by
the CL method during MP incubation with LDLN or
LDLH was complicated by possible ROS interaction
with both LDL and luminol [14].
Thus, incubation of MPN or MPIHD with LDLN or
LDLH revealed early but transient activation of the
ROS-producing function only in the case of MPN.
LDLH caused more pronounced increase in the macrophage CL than LDLN; this may be attributed to higher
initial oxidability of LDLH [15] and therefore more
potent activating effect on macrophages [16, 17].
Lack of the increase in the luminol-dependent CL of
MPIHD incubated with LDLN or LDLH was accompanied by earlier recognized [7] increase in the content of
TBARS in LDL. During the first 60 min of MPIHD incubation with LDLN and especially with LDLH this
parameter exceeded initial level by 1.6- and 1.7-fold,
respectively (Fig. 2, II, **p < 0.01). Thus, the results of
the luminol-dependent CL MPIHD and TBARS production in LDLN and LDLH were oppositely directed; this
could be attributed to ROS interaction with LDLN or
LDLH and also by lower resistance of LDLH to oxidation due to decreased content of vitamins A and E [18].
On the other hand it is also possible that lack of the
stimulating effect of LDLN or LDLH on the luminol-
67
dependent CL of MPIHD may be mediated by the presence of scavenger receptors on the surface of in vivo
activated macrophages; these receptors may lead to
uptake of both LDLN and LDLH [19]. Unlimited scavenger receptor mediated uptake of LDLH by macrophages obtained from IHD patients as well as ability of
these receptors for partial uptake of LDLN [2] not only
decreases CL but also results in formation of foam cells
(due to increased phagocytosis) followed by subsequent macrophage death.
Indeed, according to our data [7] the number of viable macrophages after 1 h of their incubation with
LDLN or LDLH decreased by 1.2- and 1.5-fold (*, **p <
0.05–0.01) and 1.6- and 2.4-fold (**p < 0.01) in experiments with MPN and MPIHD, respectively (Fig. 2, III).
Thus, the decrease in intensity of the luminol-dependent CL of MPN and MPIHD at later (after 360 min) time
intervals of their incubation with LDLN or LDLH may
be also depended on the number of viable macrophages.
Reasons for the decrease in TBARS in the “incubation” medium after 30 min (experiments with MPN) or
60 min (experiments with MPIHD especially incubated
with LDLH) may be determined by LDLH accumulation
by macrophages and lack of growth or the significant
decrease in TBARS during MPN incubation with LDLN
or LDLH may be explained by a dual role of MPN during interaction with LDL: MPN may both oxidize and
decreased LDL oxidability due to macrophage antioxidant systems [20].
3. Comparative Evaluation of Intensity
of the OZ-stimulated CL of MPN and MPIHD After Their
Preincubation with LDLN or LDLH for 15–360 min
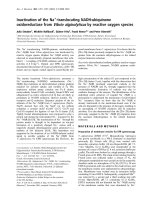
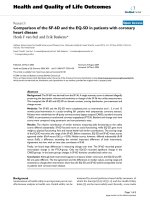
Figure 3 shows results of the third part of this study.
The values of the OZ-stimulated CL of control MPN
and MPIHD were 24.4 ± 3.77 and 40.4 ± 9.84 (V),
respectively. These values were defines as 100% for
each type of macrophages (control). The intensity of
the OZ-stimulated CL of control MPN and MPIHD moderately (but statistically insignificantly) decreased during the incubation for 15–360 min (curves 3). Preincubation of MPN and MPIHD with LDLN or LDLH for 15,
60, 180, or 360 min followed by media with LDL
removal. Macrophages then were washed and tubes
were filled with Hanks medium in which OZ
(0.1 µg/ml) was added.
After preincubation of MPN with LDLN for 15, 60,
and 180 min repeated OZ-stimulated CL increased by
1.5-, 1.5-, and 1.2-fold versus control and after preincubation of MPN with LDLH for the same time intervals
this parameter increased by 1.8-, 1.76, and 1.5-fold
(Fig. 3, curves 1 and 2, p* < 0.05, **p < 0.01). In the
case of experiments with MPIHD their preincubation
with LDLN or LDLH did not influence repeated growth
of OZ-stimulated CL of macrophages. Preincubation
with LDLN or LDLH for 360 min caused either moder-
BIOCHEMISTRY (MOSCOW) SUPPLEMENT SERIES B: BIOMEDICAL CHEMISTRY
Vol. 3
No. 1
2009
68
BILENKO et al.
CL intensity, V/400 × 103 cells, %
I
300
*
250
200
150
*
100
1
2
3
50
0
2
*
4
15′ 60′
3
4
**
1
**
360′ 15′ 60′
180′
**
*
360′
*
**
180′
II 200
TBARS, nmol MDA/
mg of LDL protein, %
**
150
**
100
50
0
1
**
*
1
*
2
**
2
15′ 60′
180′
360′ 15′ 60′
180′
360′
Number of viable cells, %
III
100
*
80
60
40
*
1
**
**
**
1
**
**
2
**
2
**
**
20
0
**
15′ 60′
180′
Incubation time, min
MPN
**
360′ 15′ 60′
180′
Incubation time, min
MPIHD
360′
Fig. 2. Incubation of MPN and MPIHD with LDLN (1) or LDLH for 15–360 min: Evaluation of intensity of the luminol-dependent
CL of MPN and MPIHD (I, V/400 × 103 cells, %), oxidation degree of LDLN and LDLH during their incubation with MPN and
MPIHD (II, nmol MDA/mg of LDL protein, %), time-course of viable macrophages (III, %). Note. I—Intensity of the luminoldependent CL of MPN and MPIHD before addition of LDLN (1) or LDLH (2) was considered as the initial (and was defined as 100%
for each type of MP); the initial luminol-dependent CL of LDLN or LDLH (defined as 100%) was used as controls for LDLN (3) or
LDLH (4). II—TBARS content in LDLN (1) or LDLH (2) before their incubation with macrophages was considered as initial one
and was defined as 100%. III—The number of viable MPN or MPIHD (of 400 × 103 cell) before their incubation with LDLN or
LDLH was defined as control (100%). Statistical significance with control: * p < 0.05; ** p < 0.01. n (number of independent
experiments) is 6.
BIOCHEMISTRY (MOSCOW) SUPPLEMENT SERIES B: BIOMEDICAL CHEMISTRY
Vol. 3
No. 1
2009
ROS PRODUCTION BY BLOOD MACROPHAGES OF HEALTHY DONORS AND IHD PATIENTS
Intensity of OZ-activated CL,
V/400 × 103 cells
200
**
69
*
2
150
*
1
*
*
1
3
100
*
3
2
50
0
*
15′ 60′
180′
Type of macrophages
MPN
360′
15′ 60′
180′
Type of macrophages
MPIHD
360′
Fig. 3. Evaluation of the OZ-stimulated CL of macrophages from healthy donors (MPN) and IHD patients (MPIHD) after their preincubation with LDLN (1) or LDLH (2) for 15–360 min (V, % to control). Note. After preincubation with macrophages LDLN or
LDLH were removed with the medium by centrifugation; macrophages were washed, the incubation medium was replaced
for Hanks medium. Intensity of the OZ-stimulated CL of MPN and MPIHD before addition of LDLN or LDLH was considered
as the initial (control) one and was defined as 100% for each type of MP. Statistical significance with control: *p < 0.05; **p < 0.01.
n (number of independent experiments) is 6.
ate (LDLN) or marked (LDLH) decrease of OZ-stimulated CL of both types of macrophages.
Thus, investigation of intensity of OZ-stimulated
CL of macrophages preincubated with LDLN or LDLH
for 15, 60, 180, and 360 min and subjected subsequent
wash (removing LDL), change of medium and zymosan addition revealed moderate secondary activation of
only MPN. It is possible that functional capacities of
MPIHD were exhausted during their preincubation with
LDL; this resulted (in contrast to MPN) in lack of their
secondary stimulation by zymosan.
SUMMARY
In this study freshly prepared cultures of MPN and
MPIHD were analyzed for their spontaneous ROS production, as well as luminol-, OZ- (opsonized zymosan),
PMA- (phorbol-13-myristate-12-acetate)- and LDL(low density lipoproteins) isolated from blood of
healthy donors (LDLN) and hypercholesterolemic Lum
5773 (InterOptica, Russia) patients (LDLH) stimulated
ROS production.
It was shown that the stimulated CL depends on the
number of macrophages studied and may characterized
the number of viable cells in the sample; an identical
cell number (400 × 103) all types of CL of MPIHD were
significantly higher (p < 0.05–0.01) than the corresponding types of CL of MPN: proper, and luminoldependent CL (1.4- and 1.8-fold), as well as OZ- and
PMA-stimulated CL (1.6- and 2.7-fold). CL-stimulator,
opsonized zymosan, in the used concentrations exhibited more potent effect than PMA, but the development
of OZ effect occurred 2–3-fold slower. Incubation of
MPN with LDLH or LDLH caused transient (15–60 min)
increase of the luminol-dependent CL (1.4- and 2.5-fold)
compared with control; this increase was then changed
for its significant decrease; incubation of MPIHD with
LDLN or LDLH did not cause the increase in CL, which
then gradually decreased.
Preincubation of MPN with LDLN or LDLH for 15,
60, and 180 min followed by subsequent removal of
LDLN or LDLH and MPN washing was accompanied by
secondary OZ-activated CL; this reaction was more
pronounced in the case of LDLH than LDLN.
Preincubation of MPIHD with LDLN or LDLH for 15,
60, and 180 min did not lead to the secondary OZ-stimulation of MPIHD. This may be attributed to more active
oxidation and uptake of LDLN and LDLH by macrophages during their preincubation, resulted in exhaustion
of cell resources and/or significant decrease in the number of viable MPIHD.
CONCLUSIONS
(1) Proper, luminol-dependent, and stimulated (by
OZ- or PMA) CL of the 20 h-culture of macrophages
derived from monocytes obtained from blood of IHD
patients (MPIHD) were significantly higher in vitro than
the same types of CL of the macrophage cultures
derived from monocytes obtained from blood of
healthy donors (MPN).
(2) Incubation of the 20 h-culture of MPN with
LDLN or LDLH for 15 and 60 min was accompanied by
the increase in luminol-dependent CL of MPN; LDLH
BIOCHEMISTRY (MOSCOW) SUPPLEMENT SERIES B: BIOMEDICAL CHEMISTRY
Vol. 3
No. 1
2009
70
BILENKO et al.
exhibited more pronounced stimulating effect than
LDLN. Incubation of MPIHD with LDLN or LDLH did
not cause the increase in luminol-dependent CL, but in
contrast to MPN this was accompanied by the increase
in LDLN and LDLH TBARS and in more pronounced
decrease in viability of MPIHD.
(3) Preincubation of MPN with LDLN and especially
with LDLH for 15, 60, and 180 min, followed by subsequent removal of the medium with LDLN or LDLH,
macrophage wash and addition of OZ, resulted in
1.5-(LDLN) or 1.8-fold (LDLH) increase in the secondary OZ-stimulated CL (p < 0.05–0.01). Preincubation
of MPIHD with LDLN or LDLH, removal of medium
with LDLN or LDLH and washing MPIHD, did not result
in the secondary OZ-stimulation.
(4) The method of the luminol-dependent CL is now
used by us as the express test for estimation of initial
level of macrophage stimulation as well as for monitoring of effectiveness of therapy, screening of pro- and
antiinflammatory drugs, initiators and inhibitors of free
radical processes.
ACKNOWLEDGMENTS
The study was supported by Russian Foundation for
Basic Research (grant nos. 06-04-48451, 06-04-, 0504-49765-a, and 08278-ofi).
6.
7.
8.
9.
10.
11.
12.
13.
14.
15.
16.
REFERENCES
1. Parthasarathy, S., Steinberg, D., and Witztum, J.L.,
Annu. Rev. Med., 1992, vol. 43, pp. 219–225.
2. Takahashi, K., Takeya, M., and Sakashita, N., Annu. Rev.
Med., 2002, vol. 35, no. 4, pp. 179–203.
3. Bilenko, M.V., Khil’chenko, A.V., and Shmit’ko, N.A.,
Byull. Eksp. Biol. Med., 2003, vol. 135, no. 4, pp. 410–
413.
4. Klebanov, G.I. and Vladimirov, Yu.A., Usp. Sovrem.
Biol., 1999, vol. 119, pp. 461–474.
5. Bilenko, M.V., Ischemia and Reperfusion of Various
Organs: Injury Mechanisms, Methods of Prevention and
17.
18.
19.
20.
Treatment, Boriotti, S. and Dennis, D., Eds., Huntington:
Nova Science Publishers, Inc., 2001.
Bilenko, M.V., Khilchenko, A.V., and Nikitina, N.A.,
J. Mol. Cell. Cardiol., 2004, vol. 37, no. 1, pp. 242–243.
Bilenko, M.V., Khilchenko, A.V., Nikitina, N.A., and
Aksenov, D.V., Biochemistry (Moscow) Supplement
Series B: Biomedical Chemistry, 2008, vol. 2, pp. 395–
405.
Klebanov, G.I., Kreinina, M.V., Pozin, V.M., Skuratovskaya, S.G., Pocheptsova, G.A., and Vladimirov, Yu.A.,
Byull. Eksp. Biol. Med., 1988, vol. 106, no. 9, pp. 297–
299.
Filipov, A.E., Chechetkin, A.V., Danil’chenko, V.A., Danil’chenko, V.V., Kas’yanov, A.N., and Vaschenko, V.I.,
Terra Medica Nova, 2004, vol. 1, no. 3, pp. 33–37.
Uchiyama, M. and Mihara, M., Anal. Biochem., 1978,
vol. 86, pp. 271–278.
Morel, D.W., Hessler, J.R., and Chisolm, G.M., J. Lipid
Res., 1983, vol. 24, pp. 1070–1076.
Nanda, A. and Grinstein, S., Proc. Natl. Acad. Sci. USA,
1991, vol. 88, pp. 10816–10820.
Tohyama, Y.I. and Yamamura, H., IUBMB Life, 2006,
vol. 58, pp. 304–308.
Witztum, J.L. and Steinberg, D., J. Clin. Invest., 1991,
vol. 88, pp. 1785–1792.
Lavy, A., Brook, G.J., Dankner, G., Ben Amotz, A., and
Aviram, M., Metabolism, 1991, vol. 40, pp. 794–799.
Handberg, A., Levin, K., Hojlund, K., Beck-Nielsen, H.,
Circulation, 2006, vol. 114, pp. 1169–1176.
Kopprasch, S., Pietzsch, J., and Graessler, J., Luminescence, 2003, vol. 8, pp. 268–273.
Voevoda, M.V., Ragino, Yu.I., Semaeva, E.V., Kashtanova, E.V., Ivanova, M.V., Chernyavskii, A.M., and
Nikitin, Yu. P., Byull. SB RAMS, 2003, vol. 109, no. 3,
pp. 47–50.
Calvo, D., Gómez-Coronado, D., Suárez, Y., Lasunción, M.A., and Vega, M.A., J. Lipid Res., 1998, vol. 39,
777–788.
Hultén, L.M., Ullström, C., Krettek, A., Van Reyk, D.,
Marklund, S.L., Dahlgren, C., and Wiklund, O., Lipids
Health Dis., 2005, vol. 4, no. 1, pp. 6–17.
BIOCHEMISTRY (MOSCOW) SUPPLEMENT SERIES B: BIOMEDICAL CHEMISTRY
Vol. 3
No. 1
2009