Extent of Dental Disease in Children Has Not Decreased, and Millions Are Estimated to Have Untreated Tooth Decay pptx
Bạn đang xem bản rút gọn của tài liệu. Xem và tải ngay bản đầy đủ của tài liệu tại đây (2.53 MB, 46 trang )
United States Government Accountabilit
y
Office
GAO
Report to Congressional Requesters
MEDICAID
Extent of Dental
Disease in Children
Has Not Decreased,
and Millions Are
Estimated to Have
Untreated Tooth
Decay
September 2008
GAO-08-1121
What GAO Found
United States Government Accountability Office
Why GAO Did This Study
Highlights
Accountability Integrity Reliability
September 2008
MEDICAID
Extent of Dental Disease in Children Has Not
Decreased, and Millions Are Estimated to Have
Untreated Tooth Decay
Highlights of
GAO-08-1121, a report to
congressional requesters
In recent years, concerns have
been raised about the adequacy of
dental care for low-income
children. Attention to this subject
became more acute due to the
widely publicized case of
Deamonte Driver, a 12-year-old boy
who died as a result of an
untreated infected tooth that led to
a fatal brain infection. Deamonte
had health coverage through
Medicaid, a joint federal and state
program that provides health care
coverage, including dental care, for
millions of low-income children.
Deamonte had extensive dental
disease and his family was unable
to find a dentist to treat him.
GAO was asked to examine the
extent to which children in
Medicaid experience dental
disease, the extent to which they
receive dental care, and how these
conditions have changed over time.
To examine these indicators of oral
health, GAO analyzed data for
children ages 2 through 18, by
insurance status, from two
nationally representative surveys
conducted by the Department of
Health and Human Services (HHS):
the National Health and Nutrition
Examination Survey (NHANES)
and the Medical Expenditure Panel
Survey (MEPS). GAO also
interviewed officials from the
Centers for Disease Control and
Prevention, and dental associations
and researchers.
In commenting on a draft of the
report, HHS acknowledged the
challenge of providing dental
services to children in Medicaid,
and cited a number of studies and
actions taken to address the issue.
Dental disease remains a significant problem for children aged 2 through 18 in
Medicaid. Nationally representative data from the 1999 through 2004 NHANES
surveys—which collected information about oral health through direct
examinations—indicate that about one in three children in Medicaid had
untreated tooth decay, and one in nine had untreated decay in three or more
teeth (see figure). Projected to 2005 enrollment levels, GAO estimates that
6.5 million children aged 2 through 18 in Medicaid had untreated tooth decay.
Children in Medicaid remain at higher risk of dental disease compared to
children with private health insurance; children in Medicaid were almost
twice as likely to have untreated tooth decay.
Receipt of dental care also remains a concern for children aged 2 through
18 in Medicaid. Nationally representative data from the 2004 through 2005
MEPS survey—which asks participants about the receipt of dental care for
household members—indicate that only one in three children in Medicaid
ages 2 through 18 had received dental care in the year prior to the survey.
Similarly, about one in eight children reportedly never sees a dentist. More
than half of children with private health insurance, by contrast, had received
dental care in the prior year. Children in Medicaid also fared poorly when
compared to national benchmarks, as the percentage of children in Medicaid
who received any dental care—37 percent—was far below the Healthy People
2010 target of having 66 percent of low-income children under age 19 receive a
preventive dental service.
Survey data on Medicaid children’s receipt of dental care showed some
improvement; for example, use of sealants went up significantly between the
1988 through 1994 and 1999 through 2004 time periods. Rates of dental
disease, however, did not decrease, although the data suggest the trends vary
somewhat among different age groups. Younger children in Medicaid—those
aged 2 through 5—had statistically significant higher rates of dental disease in
the more recent time period as compared to earlier surveys. By contrast, data
for Medicaid adolescents aged 16 through 18 show declining rates of tooth
decay, although the change was not statistically significant.
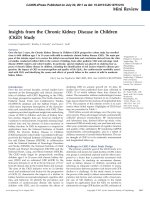
Proportion of Children in Medicaid Aged 2 through 18 with Tooth Decay, Untreated Tooth
Decay, and Untreated Tooth Decay in Three or More Teeth, 1999-2004
Source: GAO analysis of 1999 through 2004 NHANES survey data.
About one in
three children
(33%) had
tooth decay
that had not
been treated
Close to one in nine
children (11%) had
untreated tooth decay in
three or more teeth, which
can be a sign of a severe
oral health problem or
higher levels of unmet
need
About three in
five children
(62%) had
experienced
tooth decay
To view the full product, including the scope
and methodology, click on
GAO-08-1121.
For more information, contact James
Cosgrove at (202) 512-7114 or
Contents
Letter 1
Results in Brief 4
Background 5
Dental Disease and Inadequate Receipt of Dental Care Remain
Significant Problems for Children in Medicaid 8
Concluding Observations 18
Agency Comments 19
Appendix I NHANES Analysis 21
Appendix II MEPS Background and Analysis 28
Appendix III Comments from the Department of Health and
Human Services 33
Appendix IV GAO Contact and Staff Acknowledgments 39
Related GAO Products 40
Tables
Table 1: Percentage of Children Aged 2 through 18 Who Have
Experienced Tooth Decay, by Health Insurance Status,
1988-1994 and 1999-2004 23
Table 2: Percentage of Children Aged 2 through 18 with Untreated
Tooth Decay, by Health Insurance Status, 1988-1994 and
1999-2004 24
Table 3: Percentage of Children Aged 2 through 18 with Untreated
Tooth Decay in Three or More Teeth, by Health Insurance
Status, 1988-1994 and 1999-2004 25
Table 4: Percentage of Children Aged 6 through 18 with Dental
Sealants, by Health Insurance Status, 1988-1994 and 1999-
2004 26
Page i GAO-08-1121 Medicaid Dental Services for Children
Table 5: Percentage of Children Aged 2 through 18 with an Urgent
Need for Dental Care, by Health Insurance Status, 1999-
2004 27
Table 6: Percentage of Children Aged 2 through 18 Who Had
Received Dental Care in the Previous Year, by Health
Insurance Status, 1996-1997 and 2004-2005 30
Table 7: Percentage of Children Aged 2 through 18 Who Never See
a Dentist, by Health Insurance Status, 1996-1997 and 2004-
2005 31
Table 8: Percentage of Children Aged 2 through 18 Who Were
Unable to Access Necessary Dental Care, by Health
Insurance Status, 2004-2005 32
Table 9: Reasons for Children’s Inability to Access Necessary
Dental Care, by Health Insurance Status, 2004-2005 32
Figures
Figure 1: Tooth Decay and Its Possible Adverse Outcomes if
Untreated 6
Figure 2: Proportion of Children in Medicaid Aged 2 through 18
with Tooth Decay, Untreated Tooth Decay, and Untreated
Tooth Decay in Three or More Teeth, 1999-2004 9
Figure 3: Percentage of Children Aged 2 through 18 with Untreated
Tooth Decay, by Age and Insurance Status, 1999-2004 10
Figure 4: Proportion of Children in Medicaid Nationwide Not
Receiving Dental Care or Unable to Access Dental Care,
2004-2005 13
Figure 5: Percentage of Children in Medicaid Nationwide Who
Received Dental Care in the Previous Year, by Age and
Insurance Status, 2004-2005 14
Figure 6: Surveyed Measures of Tooth Decay Rates, by Insurance
Status, 1988-1994 and 1999-2004 16
Figure 7: Surveyed Measures of Children Who Visited a Dentist in
the Previous Year, by Insurance Status, 1996-1997 and
2004-2005 18
Page ii GAO-08-1121 Medicaid Dental Services for Children
Abbreviations
AAPD American Academy of Pediatric Dentistry
AHRQ Agency for Healthcare Research and Quality
CDC Centers for Disease Control and Prevention
CMS Centers for Medicare & Medicaid Services
EPSDT Early and Periodic Screening, Diagnostic, and Treatment
HHS Department of Health and Human Services
MEPS Medical Expenditure Panel Survey
NHANES National Health and Nutrition Examination Survey
SCHIP State Children’s Health Insurance Program
This is a work of the U.S. government and is not subject to copyright protection in the
United States. The published product may be reproduced and distributed in its entirety
without further permission from GAO. However, because this work may contain
copyrighted images or other material, permission from the copyright holder may be
necessary if you wish to reproduce this material separately.
Page iii GAO-08-1121 Medicaid Dental Services for Children
United States Government Accountability Office
Washington, DC 20548
September 23, 2008
The Honorable Dennis J. Kucinich
Chairman
Subcommittee on Domestic Policy
Committee on Oversight and Government Reform
House of Representatives
The Honorable Elijah E. Cummings
House of Representatives
In recent years, concerns have been raised about the adequacy of dental
care for low-income children. Attention to this subject became more acute
due to the widely publicized case of Deamonte Driver, a 12-year-old boy
who died as a result of an untreated infected tooth that led to a fatal brain
infection. Deamonte had health coverage through Medicaid, a joint federal
and state program that provides health care coverage, including dental
care, for millions of low-income children. Even though Deamonte was
entitled to dental care from his Medicaid managed care organization,
Deamonte’s family had experienced significant difficulties in obtaining
needed dental care, including finding a dentist in their Maryland
neighborhood who would accept Medicaid patients.
1
May 2007 and February 2008 congressional hearings investigated the
effectiveness of federal oversight of state Medicaid dental programs by the
Department of Health and Human Services’ (HHS) Centers for Medicare &
Medicaid Services (CMS), the agency that oversees state Medicaid
programs at the federal level. Concerns raised at the hearings about low-
income children’s oral health, including the extent that children in
Medicaid experience dental disease and receive dental care, are not new.
Our reports dating back to 2000 highlighted the problem of chronic dental
disease and the factors that contribute to low use of dental care by low-
income populations, including children in Medicaid.
2
1
Low-income children eligible under a state Medicaid plan generally are entitled to
screening, diagnostic, preventive, and treatment services—including dental services—
under Medicaid’s Early and Periodic Screening, Diagnostic, and Treatment (EPSDT)
benefit.
2
A list of related GAO products can be found at the end of this report.
Page 1 GAO-08-1121 Medicaid Dental Services for Children
You asked us to examine two aspects of children’s oral health: the extent
to which children in Medicaid experience dental disease and the extent to
which they receive dental care. You also asked us to assess how these
conditions have changed over time. This report presents information from
national health surveys on key indicators of the oral health status of
children in Medicaid, specifically, the rate of dental disease and their
receipt of dental care, and changes in these indicators over time.
3
To
determine the extent to which children in Medicaid experience dental
disease, we analyzed data from a survey conducted by HHS—the National
Health and Nutrition Examination Survey (NHANES). NHANES—
administered by the Centers for Disease Control and Prevention’s (CDC)
National Center for Health Statistics—obtains nationally representative
information on the health and nutritional status of the U.S. population
through direct physical examinations, including dental examinations, and
interviews. The dental examinations include a dentist’s assessment of
tooth decay and the presence of dental sealants, and the interviews
include questions on various health and demographic characteristics,
including information on insurance status. We grouped NHANES survey
data from 1999 through 2004 (the most recent data based on direct oral
examinations by dentists available)
4
in order to include a sufficient
number of examinations to provide a reliable basis for assessing the extent
of dental disease in the Medicaid population of children aged 2 through
18.
5
To assess how the rate of dental disease experienced by children in
3
Our ongoing work is examining state and federal efforts to ensure that children in
Medicaid receive needed dental services.
4
After 2004, direct oral examinations by dentists were eliminated as part of NHANES.
According to CDC, these examinations by dentists were replaced in 2005 through 2008
NHANES by a basic assessment of tooth decay experience and untreated decay conducted
by trained health technologists.
5
Our figures for Medicaid include children enrolled in the State Children’s Health Insurance
Program (SCHIP), because NHANES contains a single category that combines Medicaid
and SCHIP beneficiaries. SCHIP provides health care coverage to children in low-income
families who are not eligible for traditional Medicaid programs. States may implement
SCHIP programs by expanding their existing Medicaid programs, establishing separate
child health programs, or a combination of both. States with Medicaid expansion programs
must provide to SCHIP beneficiaries all benefits that are available to the traditional
Medicaid population. SCHIP enrollment in fiscal year 2006 was 6.6 million children.
Nationwide, about 29 percent of children enrolled in SCHIP were in states that have chosen
to expand their existing Medicaid programs. Of the total Medicaid and SCHIP population,
about 15 percent were enrolled in SCHIP during the 2000 through 2004 time period.
Although state Medicaid programs may cover children under age 21, SCHIP covers children
under age 19. Therefore, to ensure our analyses of age and insurance status were
comparable we limited our analyses to children ages 2 through 18.
Page 2 GAO-08-1121 Medicaid Dental Services for Children
Medicaid has changed over time, we compared NHANES data from 1999
through 2004 with NHANES data from 1988 through 1994. We analyzed
results from three different groups based on their health insurance status:
children with Medicaid, children with private health insurance, and
uninsured children. The group of children with private insurance included
both children with dental coverage and children without dental coverage,
6
while the group of uninsured was children who had neither health
insurance nor dental insurance.
To assess children’s receipt of dental care, we analyzed data from another
HHS survey, the Medical Expenditure Panel Survey (MEPS). MEPS—
administered by HHS’s Agency for Healthcare Research and Quality
(AHRQ)—obtains nationally representative information on Americans’
health insurance coverage and use of health care, including information on
receipt of dental care, such as how often participants see a dentist and
whether they have experienced problems accessing needed dental care.
Our MEPS analysis was based on surveys conducted in 2004 and 2005 (the
most recent data available); to assess how receipt of dental care has
changed over time, we compared the data from 2004 and 2005 with the
earliest available MEPS data, from 1996 and 1997. We analyzed the MEPS
data using the same three insurance groups we used for the NHANES data.
To estimate the number of children in each Medicaid category with a given
condition, we applied certain proportions from NHANES or MEPS data to
an estimate of the 2005 average monthly Medicaid enrollment of children
aged 2 through 18 (20.1 million children). Similar to NHANES, the
Medicaid category included children enrolled in the State Children’s
Health Insurance Program (SCHIP) for the later time period (2004 through
2005 for MEPS).
7
To assess the reliability of NHANES and MEPS data, we
spoke with knowledgeable agency officials, reviewed related
documentation, and compared our results to published data. We
determined these data to be reliable for the purposes of this report.
Appendixes I and II contain more information on our NHANES and MEPS
analyses. Finally, we obtained information on oral health and the Medicaid
population from CDC and from dental associations and experts including
6
We analyzed the data for privately insured children with and without dental coverage
separately, and found that the indicators of oral health and dental utilization for both
groups were similar. Consequently, in this report we present the data for children with
private insurance as one group.
7
We estimate that, of the total number of children in the MEPS 2004 through 2005 Medicaid
and SCHIP category, about 16 percent were in SCHIP.
Page 3 GAO-08-1121 Medicaid Dental Services for Children
the Children’s Health Dental Project and the Medicaid/SCHIP Dental
Association. This work was conducted in accordance with generally
accepted government auditing standards from December 2007 through
September 2008.
Dental disease and inadequate receipt of dental care remain significant
problems for children in Medicaid. Nationally representative survey data
from 1999 through 2004 indicate that about one in three children aged 2
through 18 in Medicaid had untreated tooth decay, and one in nine had
untreated decay in three or more teeth. Projecting the survey results to the
2005 average monthly Medicaid enrollment of 20.1 million children, we
estimate that 6.5 million children aged 2 through 18 in Medicaid had
untreated tooth decay. Children in Medicaid remain at higher risk of dental
disease compared to children who have private health insurance; children
in Medicaid were almost twice as likely to have untreated tooth decay.
Results in Brief
Survey data from 2004 and 2005 showed that only about one in three
children in Medicaid had received dental care in the prior year; about one
in eight children reportedly never sees the dentist. More than half of
children with private health insurance, by contrast, had received dental
care in the prior year. Children in Medicaid also fared poorly when
compared to national benchmarks, as the percentage of children in
Medicaid who received any dental care—37 percent—was far below HHS’s
Healthy People 2010 target of having 66 percent of low-income children
under age 19 receive a preventive dental service in the prior year.
Survey data on Medicaid children’s receipt of dental care showed some
improvement for children in more recent surveys. For example,
comparison of NHANES survey data from 1988 through 1994 to more
recent data from 1999 through 2004 showed that the percentage of
children aged 6 through 18 in Medicaid with at least one dental sealant
increased nearly threefold, from 10 percent in 1988 through 1994 to
28 percent in 1999 through 2004. However, over the same time periods,
dental disease in the overall Medicaid population aged 2 through 18 did
not decrease, although the data suggest the trends vary somewhat among
different age groups. Younger children—those aged 2 through 5—had
statistically significant higher rates of dental disease in the more recent
time period examined as compared to earlier surveys. By contrast, data for
adolescents—children in Medicaid aged 16 through 18—show declining
rates of tooth decay, although the change was not statistically significant.
Page 4 GAO-08-1121 Medicaid Dental Services for Children
We provided a draft of this report for comment to HHS. HHS provided
written comments, including comments from CMS, CDC, and AHRQ, and
technical comments which we incorporated as appropriate. CMS
acknowledged the challenge of providing dental services to children in
Medicaid, as well as all children nationwide, and cited a number of
activities undertaken by CMS in coordination with states. CDC
commented that trends in dental caries (tooth decay) vary by age group
and for primary versus permanent teeth. We revised our report to further
clarify the trends by age group, and note that due to sample sizes, we were
unable to comment further on trends in the Medicaid child population by
both age and by dentition (primary versus permanent teeth). We also
added information on CDC’s findings in the general population. AHRQ
commented that its own work on dental use, expenses, dental coverage
and changes had not been cited and sought additional clarification on the
methodology we used to analyze the data. We revised our report to cite
AHRQ’s findings on dental services for children and to further describe
our methodology.
In 2000, a report of the Surgeon General noted that tooth decay is the most
common chronic childhood disease.
8
Left untreated, the pain and
infections caused by tooth decay may lead to problems in eating, speaking,
and learning. Tooth decay is almost completely preventable, and the pain,
dysfunction, or on extremely rare occasion, death, resulting from dental
disease can be avoided (see fig. 1). Preventive dental care can make a
significant difference in health outcomes and has been shown to be cost-
effective. For example, a 2004 study found that average dental-related
costs for low-income preschool children who had their first preventive
dental visit by age 1 were less than one-half ($262 compared to $546) of
average costs for children who received their first preventive visit at age 4
through 5.
9
Background
8
U.S. Department of Health and Human Services, National Institute of Dental and
Craniofacial Research, National Institutes of Health,
Oral Health in America: A Report of
the Surgeon General
(Rockville, Md., 2000).
9
Matthew F. Savage, Jessica Y. Lee, Jonathan B. Kotch, and William F. Vann Jr., “Early
Preventive Dental Visits: Effects on Subsequent Utilization and Costs,”
Pediatrics, 114
(2004). The study examined the effects of preventive care on subsequent utilization and
costs of dental services among preschool-aged children in North Carolina continuously
enrolled in Medicaid between 1992 and 1997.
Page 5 GAO-08-1121 Medicaid Dental Services for Children
Figure 1: Tooth Decay and Its Possible Adverse Outcomes if Untreated
Source: GAO and the American Academy of Pediatric Dentistry.
What is tooth decay?
The American Academy of Pediatric Dentistry describes dental caries (commonly
known as cavities or tooth decay) as a process where bacteria in the mouth form
acids which demineralize tooth enamel. Tooth decay can be prevented by good
oral health practices, such as brushing with flouride toothpaste regularly, but if
not treated, could result in pain, infection, and tooth loss.
How can tooth decay lead to death?
Untreated tooth decay can penetrate the tooth surface, allowing bacteria to infect
the interior of the tooth, causing an abscess. From there, if the infection is not
dealt with by antibiotics or other treatment, it can travel to surrounding tissue or
other organs, including the brain, and on extremely rare occasions, cause death.
Travel to
surrounding tissue
and bones
Nerves
Bacteria
Abscess
Travel to other
organs, including
the brain
to other
to o
r
ncluding
nc
ng
ng
in
g
Infected areas
The American Academy of Pediatric Dentistry (AAPD) recommends that
each child see a dentist when his or her first tooth erupts and no later than
the child’s first birthday, with subsequent visits occurring at 6-month
intervals or more frequently if recommended by a dentist. The early initial
visit can establish a “dental home” for the child, defined by AAPD as the
ongoing relationship with a dental provider who can ensure
comprehensive and continuously accessible care. Comprehensive dental
visits can include both clinical assessments, such as for tooth decay and
sealants,
10
and appropriate discussion and counseling for oral hygiene,
injury prevention, and speech and language development, among other
topics. Because resistance to tooth decay is determined in part by
genetics, eating patterns, and oral hygiene, early prevention is important.
Delaying the onset of tooth decay may also reduce long-term risk for more
serious decay by delaying the exposure to caries risk factors to a time
when the child can better control his or her health behaviors.
10
According to the American Academy of Pediatric Dentistry (AAPD), dental sealants, a
plastic material put on the chewing surfaces of back teeth, have been shown to prevent
decay on tooth surfaces where food and bacteria can build up. AAPD recommends sealants
for 6-year and 12-year molars as soon as possible after eruption.
Page 6 GAO-08-1121 Medicaid Dental Services for Children
Recognizing the importance of good oral health, HHS in 1990 and again in
2000 established oral health goals as part of its Healthy People 2000 and
2010 initiatives. These include objectives related to oral health in children,
for example, reducing the proportion of children with untreated tooth
decay. One objective of Healthy People 2010 relates to the Medicaid
population: to increase the proportion of low-income children and
adolescents under the age of 19 who receive any preventive dental service
in the past year, from 25 percent in 1996 to 66 percent in 2010.
11
Medicaid, a joint federal and state program which provides health care
coverage for low-income individuals and families; pregnant women; and
aged, blind, and disabled people, provided health coverage for an
estimated 20.1 million children aged 2 through 18 in federal fiscal year
2005.
12
The states operate their Medicaid programs within broad federal
requirements and may contract with managed care organizations to
provide Medicaid benefits or use other forms of managed care, when
approved by CMS. CMS estimates that as of June 30, 2006, about
65 percent of Medicaid beneficiaries received benefits through some form
of managed care.
13
State Medicaid programs must cover some services for
certain populations under federal law. For instance, under Medicaid’s
EPSDT benefit, states must provide dental screening, diagnostic,
preventive, and related treatment services for all eligible Medicaid
beneficiaries under age 21.
14
11
The Healthy People 2010 goal was increased from 57 percent when it was first established
in 2000 to 66 percent during a mid-course review in the mid-2000s. The goal defines
preventive dental care to include examination, x-ray, fluoride treatment, cleaning, or
sealant application. See U.S. Department of Health and Human Services, Public Health
Service,
Progress Review: Oral Health (February 7, 2008).
12
Estimate based on CMS statistics for children ages 1 through 18 in Medicaid, less the
estimated number of children aged 1 in that group (the latter of which was estimated using
Census data).
13
CMS’s statistics include the Medicaid population enrolled in capitated plans (typically
defined as plans that contract with states to receive a prepaid per enrollee payment for
coverage of Medicaid services) and primary care case management models.
14
These Medicaid dental services must be provided at intervals which meet reasonable
standards of dental practice or as medically necessary and must include relief of pain and
infections, restoration of teeth, and maintenance of dental health.
Page 7 GAO-08-1121 Medicaid Dental Services for Children
Children in Medicaid aged 2 through 18 often experience dental disease
and often do not receive needed dental care, and although receipt of
dental care has improved somewhat in recent years, the extent of dental
disease for most age groups has not. Information from NHANES surveys
from 1999 through 2004 showed that about one in three children ages 2
through 18 in Medicaid had untreated tooth decay, and one in nine had
untreated decay in three or more teeth. Compared to children with private
health insurance, children in Medicaid were substantially more likely to
have untreated tooth decay and to be in urgent need of dental care. MEPS
surveys conducted in 2004 and 2005 found that almost two in three
children in Medicaid aged 2 through 18 had not received dental care in the
previous year and that one in eight never sees a dentist. Children in
Medicaid were less likely to have received dental care than privately
insured children, although they were more likely to have received care
than children without health insurance. Children in Medicaid also fared
poorly when compared to national benchmarks, as the percentage of
children in Medicaid ages 2 through 18 who received any dental care—
37 percent—was far below the Healthy People 2010 target of having
66 percent of low-income children under age 19 receive a preventive
dental service.
15
MEPS data on Medicaid children who had received dental
care—from 1996 through 1997 compared to 2004 through 2005—showed
some improvement for children ages 2 through 18 in Medicaid. By
contrast, comparisons of recent NHANES data to data from the late 1980s
and 1990s suggest that the extent that children ages 2 through 18 in
Medicaid experience dental disease has not decreased for most age
groups.
Dental Disease and
Inadequate Receipt of
Dental Care Remain
Significant Problems
for Children in
Medicaid
15
The MEPS measures receipt of any dental care, whereas the 2010 Healthy People target is
for receipt of a preventive dental service. This comparison may underestimate the actual
gap.
Page 8 GAO-08-1121 Medicaid Dental Services for Children
Dental disease is a common problem for children aged 2 through 18
enrolled in Medicaid, according to national survey data (see fig. 2).
NHANES oral examinations conducted from 1999 through 2004 show that
about three in five children (62 percent) in Medicaid had experienced
tooth decay,
16
and about one in three (33 percent) were found to have
untreated tooth decay.
17
Close to one in nine—about 11 percent—had
untreated decay in three or more teeth, which is a sign of unmet need for
dental care and, according to some oral health experts, can suggest a
severe oral health problem. Projecting these proportions to 2005
enrollment levels, we estimate that 6.5 million children in Medicaid had
untreated tooth decay, with 2.2 million children having untreated tooth
decay involving three or more teeth.
18
National Survey Data from
1999 through 2004 Show
That One in Three
Children in Medicaid Had
Untreated Tooth Decay
Figure 2: Proportion of Children in Medicaid Aged 2 through 18 with Tooth Decay, Untreated Tooth Decay, and Untreated
Tooth Decay in Three or More Teeth, 1999-2004
Source: GAO analysis of 1999 through 2004 NHANES survey data.
About one in three
children (33%)
had tooth decay
that had not
been treated
Close to one in nine
children (11%) had
untreated tooth decay in
three or more teeth, which
can be a sign of a severe
oral health problems or
higher levels of unmet need
About three in five
children (62%)
had experienced
tooth decay (treated
or untreated)
Decay
Untreated decay
Note: The NHANES survey data for Medicaid also include data for children in SCHIP, which we
estimate to be about 15 percent of the total.
16
We considered a child as having experienced tooth decay if he or she had a tooth with
untreated decay, had a tooth that had been treated for decay (meaning had a filling), or had
lost a tooth due to decay.
17
The extent of dental disease may be even more severe than these statistics suggest. Oral
health experts told us that the extent of untreated tooth decay identified in NHANES is
likely an underestimate because NHANES examiners consider a tooth as decayed only if
the decay is “visibly significant.”
18
These estimates are based on 95 percent confidence intervals—that is, there is a
95 percent probability that the actual number falls within this range. For children with
untreated tooth decay, the lower and upper limits are 5.9 million and 7.1 million,
respectively. For children with untreated tooth decay in three or more teeth, the lower and
upper limits are 1.9 million and 2.6 million, respectively.
Page 9 GAO-08-1121 Medicaid Dental Services for Children
Compared with children with private health insurance, children in
Medicaid were at much higher risk of tooth decay and experienced
problems at rates more similar to those without any insurance. As shown
in figure 3, the proportion of children in Medicaid with untreated tooth
decay (33 percent) was nearly double the rate for children who had private
insurance (17 percent) and was similar to the rate for uninsured children
(35 percent). These children were also more than twice as likely to have
untreated tooth decay in three or more teeth than their privately insured
counterparts (11 percent for Medicaid children compared to 5 percent for
children with private health insurance). These disparities were consistent
across all age groups we examined.
Figure 3: Percentage of Children Aged 2 through 18 with Untreated Tooth Decay, by
Age and Insurance Status, 1999-2004
0
5
10
15
20
25
30
35
40
45
50
Uninsured
Medicaid
Privately insured
All agesAges 16–18Ages 12–15Ages 6–11Ages 2–5
Percent
15
21
13
16
17
29
39
29
27
33
32
38
31
35 35
Source: GAO analysis of 1999 through 2004 NHANES survey data.
Note: The NHANES survey data for Medicaid also include data for children in SCHIP, which we
estimate to be about 15 percent of the total.
Page 10 GAO-08-1121 Medicaid Dental Services for Children
According to NHANES data, more than 5 percent of children in Medicaid
aged 2 through 18 had urgent dental conditions, that is, conditions in need
of care within 2 weeks for the relief of symptoms and stabilization of the
condition. Such conditions include tooth fractures, oral lesions, chronic
pain, and other conditions that are unlikely to resolve without professional
intervention. On the basis of these data, we estimate that in 2005,
1.1 million children aged 2 through 18 in Medicaid had conditions that
warranted seeing a dentist within 2 weeks.
19
Compared to children who
had private insurance, children in Medicaid were more than four times as
likely to be in urgent need of dental care.
The NHANES data suggest that the rates of untreated tooth decay for
some Medicaid beneficiaries could be about three times more than
national health benchmarks. For example, the NHANES data showed that
29 percent of children in Medicaid aged 2 through 5 had untreated decay,
which compares unfavorably with the Healthy People 2010 target for
untreated tooth decay of 9 percent of children aged 2 through 4.
20
19
This estimate is based on a 95 percent confidence interval—that is, there is a 95 percent
probability that the actual number falls within a specific range. For children with an urgent
need to see a dentist, the lower and upper limits of the range are 700,000 and 1.5 million,
respectively.
20
The age groups we used for our analysis of NHANES differ slightly from the age groups
measured for purposes of Healthy People 2010. According to HHS, prevalence of untreated
tooth decay among 2 through 4 year olds in the general population increased from
16 percent during the 1988 through 1994 time period, to 19 percent for the 1999 through
2004 time period (this increase was not statistically significant). For this objective, the
trends may be moving in the opposite direction of the target. HHS has also reported that
among young children aged 2 to 4 years, the prevalence of tooth decay in primary teeth
increased from 18 percent for the 1988 through 1994 time period to 24 percent for the 1999
through 2004 time period. By comparison with older children, tooth decay in preschool
children in the general population increased significantly. According to HHS, this trend
could portend a future increase in tooth decay in older children, as influenced by changes
in diet or food consumption patterns. The target for this goal is 11 percent.
Page 11 GAO-08-1121 Medicaid Dental Services for Children
Most children in Medicaid do not visit the dentist regularly, according to
2004 and 2005 nationally representative MEPS data (see fig. 4). According
to these data, nearly two in three children in Medicaid aged 2 through 18
had not received any dental care in the previous year.
21
Projecting these
proportions to 2005 enrollment levels, we estimate that 12.6 million
children in Medicaid have not seen a dentist in the previous year.
22
In
reporting on trends in dental visits of the general population, AHRQ
reported in 2007 that about 31 percent of poor children (family income
less than or equal to the federal poverty level) and 34 percent of low-
income children (family income above 100 percent through 200 percent of
the federal poverty level) had a dental visit during the year.
23
Survey data
also showed that about one in eight children (13 percent) in Medicaid
reportedly never see a dentist.
24
National Survey Data from
2004 through 2005 Showed
That Nearly Two in Three
Children in Medicaid Did
Not Receive Dental Care in
the Previous Year
21
MEPS asks an adult if the children in the household had received any dental care in the
previous year. If they respond affirmatively, then surveyors ask about the type of provider
they visited: a dentist, a hygienist, oral surgeon, orthodontist, endodontist, periodontist, or
dental technician.
22
This estimate is based on a 95 percent confidence interval—that is, there is a 95 percent
probability that the actual number falls within a specific range. For children without a
dental visit in the previous year, the lower and upper limits of this range are 12.1 million
and 13.0 million, respectively.
23
U.S. Department of Health and Human Services, Agency for Healthcare Research and
Quality, “Dental Use, Expenses, Private Dental Coverage, and Changes, 1996 and 2004,”
MEPS Chartbook, no. 17 (2007),
(downloaded
Sept. 16, 2008).
24
As part of the MEPS survey, participants are asked: “On average, how often does [person]
receive a dental check-up?” One of the responses to this question is that the individual in
question “never goes to a dentist.” The percentage of children who “never go to the dentist”
varied by age group. The youngest group, ages 2 through 5, was the group most likely to
never see a dentist, with 30 percent of children falling in that category. However, even
some of the older children never see a dentist. We found that about 10 percent of children
aged 16 through 18 in Medicaid were in this category.
Page 12 GAO-08-1121 Medicaid Dental Services for Children
Figure 4: Proportion of Children in Medicaid Nationwide Not Receiving Dental Care or Unable to Access Dental Care, 2004-
2005
Source: GAO analysis of 2004 through 2005 MEPS survey data.
About one in eight children
(13%) reportedly never sees
a dentist
About one in 25 children (4%)
were unable to access dental
care in the previous year
In 2004 through 2005,
nearly two in three
children (63%) had not
received any dental care
in the previous year
63%
13%
4%
Note: The MEPS survey data for Medicaid also include data for children in SCHIP, which we estimate
to be about 16 percent of the total.
MEPS survey data also show that many children in Medicaid were unable
to access needed dental care. Survey participants reported that about
4 percent of children aged 2 through 18 in Medicaid were unable to get
needed dental care in the previous year. Projecting this percentage to
estimated 2005 enrollment levels, we estimate that 724,000 children aged 2
through 18 in Medicaid could not obtain needed care.
25
Regardless of
insurance status, most participants who said a child could not get needed
dental care said they were unable to afford such care.
26
However,
15 percent of children in Medicaid who had difficulty accessing needed
dental care reportedly were unable to get care because the provider
refused to accept their insurance plan, compared to only 2 percent of
privately insured children.
25
This estimate is based on a 95 percent confidence interval—that is, there is a 95 percent
probability that the actual number falls within this range. For children who could not
obtain needed dental care, the lower and upper limits of this range are 543,000 and 884,000,
respectively.
26
MEPS asked participants for the reason they were unable to get needed care. Possible
responses included (1) could not afford care, (2) insurance company would not
approve/cover/pay, (3) doctor refused insurance plan, (4) problems getting to doctor’s
office, (5) could not get time off work, (6) didn’t know where to get care, (7) was refused
services, (8) could not get child care, (9) did not have time, and (10) other. Table 9 in
app. II lists the reasons for MEPS participants’ inability to access necessary dental care by
insurance status. MEPS is a nationally representative survey that also includes privately
insured and uninsured individuals; it does not illuminate why beneficiaries with health
coverage such as Medicaid (which has no cost sharing for certain beneficiaries) would
report that they could not afford care, or the reasons for providers refusing to accept
insurance plans.
Page 13 GAO-08-1121 Medicaid Dental Services for Children
Children enrolled in Medicaid were less likely to have received dental care
than privately insured children, but they were more likely to have received
dental care than children without health insurance. (See fig. 5.) Survey
data from 2004 through 2005 showed that about 37 percent of children in
Medicaid aged 2 through 18 had visited the dentist in the previous year,
compared with about 55 percent of children with private health insurance,
and 26 percent of children without insurance. The percentage of children
in Medicaid who received any dental care—37 percent—was far below the
Healthy People 2010 target of having 66 percent of low-income children
under age 19 receive a preventive dental service.
Figure 5: Percentage of Children in Medicaid Nationwide Who Received Dental Care
in the Previous Year, by Age and Insurance Status, 2004-2005
0
10
20
30
40
50
60
70
80
Uninsured
Medicaid
Privately insured
All agesAges 16–18Ages 12–15Ages 6–11Ages 2–5
Percent
Healthy People 2010
target for low-income
children under age 19
66%
Source: GAO analysis of 2004 through 2005 MEPS survey data.
42
64
58
50
55
32
45
38
30
37
24
35
26
18
26
Note: The MEPS survey data for Medicaid also include data for children in SCHIP, which we estimate
to be about 16 percent of the total.
Page 14 GAO-08-1121 Medicaid Dental Services for Children
The NHANES data from 1999 through 2004 also provide some information
related to the receipt of dental care. The presence of dental sealants, a
form of preventive care, is considered to be an indicator that a person has
received dental care. About 28 percent of children in Medicaid had at least
one dental sealant, according to 1999 through 2004 NHANES data. In
contrast, about 40 percent of children with private insurance had a sealant.
However, children in Medicaid were more likely to have sealants than
children without health insurance (about 20 percent).
Comparison of Past and
Recent Survey Data
Suggests That the Rate of
Dental Disease in Children
in Medicaid Is Not
Decreasing, although the
Receipt of Dental Care Has
Improved Somewhat in
More Recent Years
While comparisons of past and more recent survey data suggest that a
larger proportion of children in Medicaid had received dental care in
recent surveys, the extent that children in Medicaid experience dental
disease has not decreased. A comparison of NHANES results from 1988
through 1994 with results from 1999 through 2004 showed that the rates of
untreated tooth decay were largely unchanged for children in Medicaid
aged 2 through 18: 31 percent of children had untreated tooth decay in
1988 through 1994, compared with 33 percent in 1999 through 2004 (see
fig. 6). The proportion of children in Medicaid who experienced tooth
decay increased from 56 percent in the earlier period to 62 percent in more
recent years. This increase appears to be driven by younger children, as
the 2 through 5 age group had substantially higher rates of dental disease
in the more recent time period, 1999 through 2004.
27
This preschool age
group experienced a 32 percent rate of tooth decay in the 1988 through
1994 time period, compared to almost 40 percent experiencing tooth decay
in 1999 through 2004 (a statistically significant change). Data for
adolescents, by contrast, suggest declining rates of tooth decay. Almost 82
percent of adolescents aged 16 through 18 in Medicaid had experienced
tooth decay in the earlier time period, compared to 75 percent in the latter
time period (although this change was not statistically significant). These
trends were similar for rates of untreated tooth decay, with the data
suggesting rates going up for young children, and declining or remaining
the same for older groups that are more likely to have permanent teeth.
According to CDC, these trends are similar for the general population of
children, for which tooth decay in permanent teeth has generally declined
27
We found that the rates of untreated tooth decay for children with Medicaid did not
decrease from the period 1988 through 1994 to the period 1999 through 2004. Similarly,
CDC found that the rates of untreated primary tooth decay in children aged 2 through 11
had not decreased between 1988 through 1994 and 1999 through 2004. However, CDC has
found that rates of untreated tooth decay in permanent teeth for low-income children have
declined since the early 1970s.
Page 15 GAO-08-1121 Medicaid Dental Services for Children
and untreated tooth decay has remained unchanged. CDC also found that
tooth decay in preschool aged children in the general population had
increased in primary teeth.
Figure 6: Surveyed Measures of Tooth Decay Rates, by Insurance Status, 1988-1994
and 1999-2004
0
10
20
30
40
50
60
70
1999–2004 data
1988–1994 data
Privately
insured
MedicaidUninsured
Percent
Have experienced tooth decay
62
51
59
45
56
59
Source: GAO analysis of 1988 through 1994 and 1999 through 2004 NHANES survey data.
0
10
20
30
40
50
60
70
1999–2004 data
1988–1994 data
Privately
insured
MedicaidUninsured
Percent
Have untreated tooth decay
39
33
35
18
31
17
Notes: For the privately insured and for those with Medicaid, changes between the two time periods
in the percentage of children aged 2 through 18 who experienced tooth decay were statistically
significant at the 95 percent level. For this measure, changes in the percentage of children aged 2
through 18 who were uninsured were not statistically significant. For untreated tooth decay, none of
the changes between the two time periods were found to be statistically significant at the 95 percent
level. The 1999 through 2004 NHANES survey data for Medicaid also include data for children in
SCHIP, which we estimate to be about 15 percent of the total.
At the same time, indicators of receipt of dental care, including the
proportion of children who had received dental care in the past year and
use of sealants, have shown some improvement. Two indicators of receipt
of dental care showed improvement from earlier surveys:
Page 16 GAO-08-1121 Medicaid Dental Services for Children
• The percentage of children in Medicaid aged 2 through 18 who received
dental care in the previous year increased from 31 percent in 1996 through
1997 to 37 percent in 2004 through 2005, according to MEPS data (see
fig. 7). This change was statistically significant. Similarly, AHRQ reported
that the percent of children with a dental visit increased between 1996 and
2004 for both poor children (28 percent to 31 percent) and low-income
children (28 percent to 34 percent).
• The percentage of children aged 6 through 18 in Medicaid with at least one
dental sealant increased nearly threefold, from 10 percent in 1988 through
1994 to 28 percent in 1999 through 2004, according to NHANES data, and
these changes were statistically significant. The increase in receipt of
sealants may be due in part to the increased use of dental sealants in
recent years, as the percentage of uninsured and insured children with
dental sealants doubled over the same time period.
28
Adolescents aged 16
through 18 in Medicaid had the greatest increase in receipt of sealants
relative to other age groups. The percentage of adolescents with dental
sealants was about 6 percent in the earlier time period, and 33 percent
more recently.
The percentage of children in Medicaid who reportedly never see a dentist
remained about the same between the two time periods, with about
14 percent in 1996 through 1997 who never saw a dentist, and 13 percent in
2004 through 2005, according to MEPS data.
28
According to HHS officials, many state health departments have long-term programs that
have delivered sealants to a sizable number of low-income children over the past decade.
See for example, CDC, “Impact of Targeted, School-Based Dental Sealant Programs in
Reducing Racial and Economic Disparities in Sealant Prevalence Among School Children,
Ohio, 1998-1999,”
Morbidity and Mortality Weekly Report, 50 no. 34 (2001),736-8.
Page 17 GAO-08-1121 Medicaid Dental Services for Children
Figure 7: Surveyed Measures of Children Who Visited a Dentist in the Previous
Year, by Insurance Status, 1996-1997 and 2004-2005
Notes: For each group, changes between the two time periods in the percentage of children aged 2
through 18 who had received dental care in the previous year were statistically significant at the
95 percent level. The 2004 through 2005 MEPS survey data for Medicaid also include data for
children in SCHIP, which we estimate to be about 16 percent of the total.
More information on our analysis of NHANES and MEPS for changes in
dental disease and receipt of dental care for children in Medicaid over
time, including confidence intervals and whether changes over time were
statistically significant, can be found in appendixes I and II.
The information provided by nationally representative surveys regarding
the oral health of our nation’s low-income children in Medicaid raises
serious concerns. Measures of access to dental care for this population,
such as children’s dental visits, have improved somewhat in recent
surveys, but remain far below national health goals. Of even greater
concern are data that show that dental disease is prevalent among children
in Medicaid, and is not decreasing. Millions of children in Medicaid are
estimated to have dental disease in need of treatment; in many cases this
need is urgent. Given this unacceptable condition, it is important that
0
10
20
30
40
50
60
70
2004–2005 data
1996–1997 data
Privately
insured
MedicaidUninsured
Percent
20
31
48
26
37
55
Source: GAO analysis of 1996 through 1997 and 2004 through 2005 MEPS survey data.
Concluding
Observations
Page 18 GAO-08-1121 Medicaid Dental Services for Children
those involved in providing dental care to children in Medicaid—the
federal government, states, providers, and others—address the need to
improve the oral health condition of these children and to achieve national
oral health goals.
We provided a draft of this report for comment to HHS. HHS provided
written comments which we summarize below. The text of HHS’s letter,
including comments from CMS, CDC, and AHRQ, is reprinted in
appendix III. HHS also provided technical comments, which we
incorporated as appropriate. In commenting on the draft, CMS
acknowledged the challenge of providing dental services to children in
Medicaid, as well as all children nationwide, and cited a number of
activities undertaken by CMS in coordination with states, such as
completing 17 focused dental reviews and forming an Oral Health
Technical Advisory Group. CDC commented that trends in dental caries
vary by age group and for primary versus permanent teeth. CDC also noted
that beginning in 2005, trained health technologists conducted basic
assessments of caries experience. We revised our report to further clarify
the differing trends by age groups and to acknowledge the assessments
performed by health technologists. We did not analyze the data by both
age and dentition (primary versus permanent teeth) due to small sample
sizes; we note that the trends for the youngest and oldest age groups in the
Medicaid child population that we identified are consistent with those that
CDC found in the general population by age and dentition.
AHRQ commented that agency staff had completed a Chartbook that
summarizes dental use, expenses, dental coverage, and changes from 1996
and 2004 for the general population that was not cited and referenced in
our report, and indicated it was unclear why the same analytical approach
was not followed for the determination of public coverage status. In
technical comments, AHRQ noted that their reported findings are
generally comparable to GAO’s findings. We revised our report to cite
AHRQ’s findings on dental services for children and to further describe
our methodology. Regarding our determination of public coverage status,
we did not use AHRQ’s analytical approach that describes “public
coverage” because the focus of this report was on children covered by
Medicaid. AHRQ’s approach did not distinguish Medicaid from other types
of public coverage.
Agency Comments
Page 19 GAO-08-1121 Medicaid Dental Services for Children
We are sending copies of this report to other interested congressional
committees and to the Secretary of HHS. We will also make copies
available to others upon request. In addition, the report will be available at
no charge on the GAO Web site at
.
If you or your staffs have any questions regarding this report, please
contact me at (202) 512-7114 or
Contact points for our
Offices of Congressional Relations and Public Affairs may be found on the
last page of this report. Key contributors are listed in appendix IV.
James C. Cosgrove
Director, Health Care
Page 20 GAO-08-1121 Medicaid Dental Services for Children