KAP SURVEY regarding REPRODUCTIVE HEALTH ppt
Bạn đang xem bản rút gọn của tài liệu. Xem và tải ngay bản đầy đủ của tài liệu tại đây (1.8 MB, 57 trang )
K
K
A
A
P
P
S
S
U
U
R
R
V
V
E
E
Y
Y
r
r
e
e
g
g
a
a
r
r
d
d
i
i
n
n
g
g
R
R
E
E
P
P
R
R
O
O
D
D
U
U
C
C
T
T
I
I
V
V
E
E
H
H
E
E
A
A
L
L
T
T
H
H
KABUL, 15 to 31 October 2002
Conducted by:
IbnSina
Public Health Program for Afghanistan, Afghanistan
ICRH
International Centre for Reproductive Health, University of Ghent, Belgium
Dr. Kathia van Egmond
Funded by:
VLIR
Flemish Inter-University Board, Belgium
DGIC
Directorate-General for International Cooperation, Belgium
LIST OF ABBREVIATIONS
DGIC Directorate-General for International Cooperation, Belgium
FP Family Planning
ICPD International Conference on Population and Development,
Cairo 1994
ICPD+5 5-year Review and Appraisal of Implementation of the ICPD
Programme of Action, 1999
ICRH International Centre for Reproductive Health, University Ghent
IUD Intra Uterine Device
KAP Knowledge, Attitudes and Practices
MCH Mother and Child Health
RH Reproductive Health
STI Sexually Transmitted Infections
TBA Traditional Birth Attendant
UNFPA United Nations Population Fund
UNHCR United Nations High Commissioner for Refugees
UNICEF United Nations Children’s Fund
VLIR Flemish Inter-University Board
WHO World Health Organisation
2
TABLE OF CONTENTS
EXECUTIVE SUMMARY p 5
INTRODUCTION p 11
SURVEY OBJECTIVES p 11
METHODOLOGY p 11
SURVEY RESULTS p 13
1. Characteristics of the Survey population p 13
2. Obstetrical indicators p 18
3. Antenatal Care p 22
4. Safe delivery p 23
5. Maternal mortality p 29
6. Family planning p 30
7. Sexually Transmitted Infections p 36
8. Health and Gender issues p 37
FACTORS DETERMINING SOME RH INDICATORS p 41
A. Factors associated with the use of RH services p 41
B. Influence of formal education on RH parameters p 47
LIMITATIONS / BIASES p 49
CONCLUSION p 51
RECOMMENDATIONS p 53
ACKNOWLEDGEMENT p 57
3
4
EXECUTIVE SUMMARY
A. Introduction
Nearly any one is aware of the extremely bad reproductive health (RH) situation in
Afghanistan. The needs for RH care are enormous. However improvement of
reproductive health care is not an easy objective in Afghanistan of today. A socially
integrated and culturally well-accepted approach is essential for any initiative in the
reproductive health care sector.
In this perspective, we need a far better understanding of what women’s position in
society currently is and what women actually want.
The main objective of this KAP study (Knowledge, Attitudes and Practices) therefore
consists in contributing to a better understanding of the way Afghan women perceive
their reproductive health and reproductive health needs.
A total of 468 Afghan women of reproductive age (15 to 49 years) have been
interviewed. They have been selected through systematic sampling of adult women
attending four different health clinics in Kabul city (2 general outpatient clinics and 2
MCH clinics).
B.
Summary of the results
1. Characteristics of the survey population and health care seeking
behaviour
• The mean age of women interviewed was 28 years. The age category 15 to
19 years was underrepresented at all clinics.
• 62 % of the interviewed women were illiterate and 64% never attended a
regular school. Among their husbands 31% appeared to be illiterate.
• 86% of the women were married and among them, the mean age of marriage
was 17.2 years old. About one out of six women married at the age of 14
years or younger.
• About 49% of the husbands had a more or less permanent and regular job,
mostly in the private sector (small business).
• Near half of the women interviewed - all living in Kabul – were not born in
Kabul. And 25% of all women interviewed had arrived in Kabul over the past
year, after the fall of the taleban regime.
• In case of illness, more than half of the women went to the public health
sector. Another 42% went to seek care in the private health sector. In
average, women lived at 25 minutes walking distance from the respective
health centres.
• Almost 90% of all women interviewed had to ask permission of their husband
or of a male relative to go to a health centre.
2. Obstetrical history
• 29% of the women said to be pregnant at the moment of interview.
• 95% of all ever-married women had been pregnant before.
• The average number of previous pregnancies per married woman was nearly
5. For women above the age of 35 years, the mean number of previous
pregnancies exceeded 7.
• About 86% of all previous pregnancies were reported to have resulted in live
births.
• In average, women were 18.8 years old when they delivered their first child.
5
• The average interval between two deliveries has been estimated at 2.5 years.
The younger the women, the shorter the average duration was.
• Of the total number of reported deliveries (n= 1777), two third had occurred
at home. The other third in a health facility.
• Only 16 % of all women said they had learned “how babies were made” when
they were 15 years old.
• In total, 29% of all interviewed women had lost at least one live born child.
The calculated neonatal and infant mortality rates were high within the
surveyed population, but lower than the national estimates.
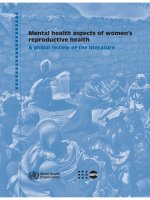
Average number of previous pregnancies, living children and children
desired
0.8 2.4 4.1 6.5 7.0 7.6 7.6
0.7 1.9 3.2 4.8 5.6 5.9 6.1
3.9 4.2 4.9 5.5 6.5 6.7 6.6
15 –
19
years
20 –
24
years
25 –
29
years
30 –
34
years
35 –
39
years
40 –
44
years
45 –
49
years
0.0
1.0
2.0
3.0
4.0
5.0
6.0
7.0
8.0
Mean number of previous
pregnancies
Mean number of children
currently alive
Mean number of total
children desired
3. Antenatal Care (only women who gave birth at least once)
• 79% of the women attended antenatal consultations during their last
pregnancy. Most of them (86%) went to see a gynaecologist.
• The first antenatal visit took place on average at 5 months pregnancy and the
mean number of antenatal visits was 3.7.
• 70% of the women reported to have received a tetanus vaccination at least
once during their last pregnancy and on average 2.7 doses were
administered.
• The acceptability of antenatal care seemed good. Almost all women said they
would attend antenatal consultations again next time they were pregnant.
Only 1.3% reported accessibility to be an obstacle to antenatal care.
• The three main reasons reported by the women for attending antenatal
services were: 1) check the health of their unborn baby (39%), 2) medical
treatment because of illness (28%) and 3) free vaccination (13%)
6
4. Safe delivery (only women included who gave birth at least once)
• Regarding their last delivery place, 59% of the women delivered at home.
From the 41% of the women who have given birth in a health structure, 87%
went to a public health structure (hospital or health centre). Most of the
women (83.5%) were satisfied with the care they had received in the health
structure
• The reasons why the women delivered at home were various. Geographic
inaccessibility counted for 32%, cultural barriers for 18%, financial barriers for
17% and the bad security situation for 11% of all mentioned obstacles. Even
if the women did not mention that they preferred to deliver at home, we
presume this is an important factor, since 36% of the women said they would
deliver at home again next time they were pregnant.
• About 55% of the women reported to be involved in the decision-making
regarding the place of birth of their children.
• 56% of the last deliveries were assisted by skilled health personnel. Logically
almost all institutional deliveries were assisted by skilled staff, most often by a
(gynaecologic) doctor (75%). But also 26% of all home deliveries were
attended by skilled personnel, mainly midwifes.
• Among the unskilled attendants, female relatives were most popular (48% of
all home deliveries). Traditional Birth Attendants assisted in 17,5% of all
reported last home deliveries.
• Only 1.6% of the interviewed women delivered through caesarean section.
This percentage is low as according to ICPD+5, average national caesarean
section rates vary between 5 and 15%.
5. Maternal mortality
The maternal mortality rate among the surveyed population was - roughly
estimated through the indirect sisterhood method - 1756/100.000 women of
reproductive age (95% confidence interval = [840 to 3496]).
Even if imprecise and not representative for the total population, it is a very
high rate and coherent with recent published figures by UNICEF (1600 per
100.000 live births, 95% CI [1100 – 2000]).
6. Family planning (FP)
• On average the women reported a desired family size of 5.2 children. 75% of
the women thought their husband would agree with that number.
• The mean age of FP users was 32.7 years old, which was significantly higher
than the mean age of non-users. The average number of previous live births
was also significantly higher among the users (5.3 versus 3.9).
• 40% of the women considered their family size met (most of them being more
than 30 years old), but only 23% were currently using a FP method, indicating
there is still an unmet FP need
• Among the non – users of any FPmethod, 18% were pregnant. 52% did not
know about any method to delay or avoid pregnancy. Lack of knowledge can
therefore be considered as the most important obstacle to FP services.
Among the remaining 30%, most women wanted another child,
• 13% had fear of the side effects of contraceptives; 10% said they were
culturally not allowed to use any FP method and 8% mentioned financial or
geographic barriers.
7
• 16% of all married women were using modern contraception and 7% a natural
family planning method. Among the modern methods, the IUD seemed most
popular. Among the natural methods, withdrawal was most mentioned,
followed by periodic abstinence. When asked which method the women
would prefer to use, preference was given to modern family planning
methods. The relative preference given to a particular modern contraception
method was very similar to the distribution of currently used methods.
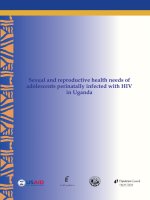
Child wish , FP use and Pregnancy
0% 16% 28% 52% 61% 78% 88%
0% 7% 26% 29% 38% 18% 50%
67% 42% 31% 21% 19% 8% 5%
15 – 19
years
20 – 24
years
25 – 29
years
30 – 34
years
35 – 39
years
40 – 44
years
45 – 49
years
0%
10%
20%
30%
40%
50%
60%
70%
80%
90%
% women who do not want
more children
% users of any F.P. method
% pregnant now
7. Reproductive Tract Infections (RTI) /
Sexually Transmitted Infections (STI)
• Only 24% of the interviewed women said to have knowledge of any STI.
Among the STIs they knew, HIV / AIDS was the most mentioned (72%),
followed by gonorrhoea.
• The sources of information regarding STIs were - in order of importance- a
person from a health facility (43%), followed by relatives (18%), radio (16%),
reading (9%) and television (8%).
• Even women who knew about STIs, were badly informed on prevention
mechanisms: 29% of them wrongly supposed they could avoid STIs through
good general hygiene and bathing. The use of a condom was very rarely
mentioned as a prevention method for STIs.
• 36% of the women had ever heard about HIV/AIDS and 80.5% of these
women claimed to know the transmission ways of the virus. Nevertheless
their real knowledge turned out to be quite low. Almost half of the women who
claimed to know the ways of transmission, believed one could be infected
with HIV/AIDS through kisses and hugs and 42% thought they could get
infected through mosquito bites. Only 19% gave correct answers.
8
• 54% of the women said they knew what a condom was. (Note: prompt
knowledge among the interviewed women on condoms as FP method was
33%). Less than 25% of them said they had used or would be using a
condom as protection against sexually transmitted infections.
8. Health and Gender issues
• Most of the women considered themselves to be in “normal” health (between
“very bad” and “very good”). The perceived health condition one year earlier
(just before American bombing started) was not significant better.
• Only 25% of the women mentioned medical care as a priority to improve their
health condition. Improved access to drugs was perceived as much more
needed than access to health structures. The other priority needs concerned
basic needs such as food, housing and money for daily survival. 12% of the
women said a better security situation was the most needed for being
healthier.
• 79% of the women interviewed agreed with the statement that “a woman
should be allowed to choose a husband.” 87% agreed that “a woman should
have the right to decide on her number of children”.
• 76% of the women did agree with the statement that “it is wife’s duty to have
sex with her husband, even if she does not want”. 57% agreed even so with
the idea that “a husband has the rights to beat his wife if she disobeys him.”
• Almost all women (98%) seem to perceive the importance of education, since
98 % agreed that all girls should learn to read and to write. The mean age till
which a girl should be attending school was 19.4 years according the
interviewed women.
• The best age for a girl to marry was considered 20.2 years, nearly 3 years
older than the median age at which the interviewed women got married
themselves.
C.
Factors determining some reproductive health indicators:
• Multivariate analysis showed a strong positive and significant association
between the educational level of the woman and most of the reproductive health
parameters under study. Use of antenatal care services (OR 4.8), institutional
delivery (OR 2.3), skilled assistance at delivery (OR 2.1), use of family planning
(OR 4.6) were all associated with schooling of the woman.
• Attending antenatal care during the last pregnancy was found to be
independently associated with institutional delivery (OR 2.8), skilled assistance at
birth (OR 3.4) and better knowledge of FP methods
• Experience of some particular problems pre-, intra or post- partum, appeared not
to be significantly related with skilled birth attendance and/or delivery in a health
facility. Yet the questioned symptoms - like severe vaginal bleeding before or
after delivery, high fever and weakness, general oedema and weakness,
prolonged labour, convulsions / cramps - are considered as potentially
dangerous, in which case institutional delivery were preferable.
• Besides knowledge on any FP method, the use of FP methods was associated
with educational level of the mother, older age and with the desired family size.
• Overall, the use of reproductive health care services improved with the
educational level of the mother. Yet, only small differences were found between
primary and secondary or higher education.
9
• No association was found between the educational level of the women’s
husband, husband’s literacy and profession, ethnical group, economical status…
and the studied reproductive health parameters.
D.
Conclusion and recommendations
This study shows that:
• The desired family size expressed by the Afghan women as well as the high
fertility at young age reflects the importance and emphasis put on the
reproductive role of the women in the Afghan society.
• Even within this privileged group of women, maternal mortality rate was found
to be very high and the caesarean section rate far too low.
• The knowledge on sexual and reproductive health in general and on more
particular aspects like family planning and STIs is low. Yet, this survey was
held within a privileged group of women: living in Kabul and having access to
primary health care. We presume this knowledge to be even worse in rural
areas.
• Socio-cultural factors do play a very important role in the use and non-use of
some reproductive health care services like emergency obstetrical care and
family planning services
• Reproductive health should be seen in a broader perspective than just from a
medical point of view. Education and women’s social position are at least as
important.
This KAP survey did not assess potential barriers to reproductive health services like
geographic accessibility, quality of services and staff training. And surely this survey
does not want to undermine the importance and need for appropriate medical
services in Afghanistan. The lack of health infrastructures, of trained health staff
etc… do play a capital role in the utterly bad Afghan reproductive health indicators.
But besides that, we want to emphasize the influence of the entire society on the
reproductive health indicators and the importance of a multi-sectoral approach in
order to improve reproductive health in a context like Afghanistan.
Education of girls / women, empowerment of the social position of women, and
community education are three key elements in this process. As such, one can
expect that it will take many years of social investment and of commitment to peace
before reproductive health can be achieved for the majority of Afghan women.
10
INTRODUCTION
Many reproductive health indicators remain unknown in Afghanistan. But partial as
they are, the existing figures reflect a disastrous reproductive health situation.
E.g. mortality and morbidity rates for women and children are amongst the highest in
the world (source: UNICEF / WHO).
o Maternal mortality = 1.600 per 100,000 live births (highest in the world)
o Under 5 mortality = 257 per 1,000 live births (5
th
highest in the world)
o Infant mortality = 161 to 165 per 1,000 live births.
The needs within the area of reproductive health care are enormous. Yet, improving
RH is not an easy goal in Afghanistan. Because of the multiple problems, any
initiative to improve the RH status of the population will have to be socially integrated
and culturally well accepted. Understanding how women perceive their reproductive
health and rights is an absolute condition for the success of a program considering
the promotion of women’s health and rights.
In this perspective, we need a far better understanding of what women’s position in
society currently is and what women actually want.
We hope this KAP study can contribute to this broader over-all goal of better health
for the Afghan population.
SURVEY OBJECTIVES
General Objective
To contribute to a better understanding of reproductive health as perceived by the
Afghan women
Specific Objectives
o To document the use of some reproductive health services among Afghan
women
o To document the reasons and obstacles explaining the use / non use of these
reproductive health care services
o To document the preferences of these women regarding place of delivery,
birth attendance, family planning method …
o To document the knowledge on family planning methods, on STIs, …
o To document prevailing opinions regarding gender issues
METHODOLOGY
Type of survey
Cross-sectional study with descriptive objectives
Selection of the clinics
Four health care facilities have been selected in Kabul:
• Two general outpatient clinics: Central Polyclinic and Qasabai polyclinic
• Two MCH clinics (Mother and Child Health Clinics): Karte Se and Qalae
Zaman Khan
11
All four clinics were located within the urban area of Kabul city, but in different
geographical area and therefore serving different ethnical and socio-cultural groups.
The two MCH clinics received support from international health agencies in terms of
medical supplies, incentives, training and supervision for the staff, equipment, …
The two polyclinics were not supported by any international agency at that time.
All clinics were located at relatively considerable distance from one of the 3 public
hospitals in Kabul with obstetrical services (between 30 minutes (central polyclinic)
and 2 hours (Qasabai polyclinic) walking distance).
Selection of the women
From all the adult women presenting themselves at the above-mentioned 4 clinics, a
systematic sample was taken (sampling interval: average number of adult women
attending the clinic divided by 10).
Only women of reproductive age – between 15 years up to 49 years – were selected
for an interview.
When a woman did not match the age criteria or refused to be interviewed, the next
woman attending the consultation was selected.
The reason of refusal was noted in a separated sheet. In total 18 women (mean age
34 years) refused the interview. The reason given was always lack of time. Four
hundred sixty eight accepted to participate.
Time Frame
The survey was conducted between19 and 31 October 2002 in Kabul.
Survey implementation
The survey questionnaire has been developed in English by ICRH in collaboration
with IbnSina. Hereafter the questionnaire was translated in Dari.
Four female medical surveyors have been selected (two medical doctors, one
medical student and one nurse) and trained during two days.
One day field testing of the questionnaire in Dari was done in Kohte Ashrow clinic,
Wardak province.
The survey implementation lasted 10 full days, with each surveyor doing about 10
interviews per day (in average 30 minutes per interview). Two IbnSina and one ICRH
staff member did the daily supervision, as well as the daily data entry in Epi-Info.
Sample size
Health Centre Type Women
/ day
Sampling
interval
Women
interviewed
% of
total
Period
Central Polyclinic Poly 30 3 117 25.0% 19 – 24 Oct.
Karte Se MCH 60 6 111 23.7% 19 – 24 Oct.
Qasabai Poly 40 4 124 26.5% 26 – 31 Oct.
Qalae Zaman Khan MCH 70 7 116 24.8% 26 – 31 Oct.
TOTAL
468
100% 19 – 31 Oct.
This sample size permits to estimate most parameters with a precision of about 5%
(with alpha risk=5%).
Analysis
The data were entered in Epi-Info 6.04. Statistical analysis was carried out using the
SPSS 11.0 software package. One-Way Anova for equality of means was used for
quantitative variables while chi-square test was used for qualitative data. Multivariate
analysis was performed by using the logistic regression “enter” model. P values less
than 0.05 were deemed statistically significant.
12
SURVEY RESULTS
1. Characteristics of the Surveyed population
Age
The mean age of the interviewed women was 28.2 years old.
Women attending MCH clinics were significantly younger than those attending the
polyclinics (p=0.008)
N Mean Age S.D. P 25 Median P 75 Min Max
Polyclinics 241 29.2 8.2 23 28 35 15 48
MCH clinics 227 27.2 7.5 21 25 32 15 48
TOTAL 468
28.2
7.9 22 28 35 15 48
Age distribution
In all four clinics, the age group 15 – 19 years as well as the age group 40 and
older, were underrepresented.
Around 45% of the women attending the clinics were aged between 20 and 29 years.
This can be explained by the fact that most women in this age group have young
children and therefore more frequently contact the health care system.
AGE CATEGORIES
4
5
-
4
9
year
s
40
-
4
4
year
s
35
-
3
9
year
s
3
0
-
3
4
y
ears
2
5
-
2
9
years
2
0
-
2
4
y
ear
s
15
-
1
9
year
s
30%
20%
10%
0%
The fact that adolescents seem to have fewer occasions to frequent health facilities,
might be an important element to consider in e.g. health education programs.
Ethnicity
The majority of the women interviewed were Tajik (62 %), followed by Pashtun (20
%) and then Hazara (17 %).
13
Ethnical groups Frequency Percent
Pashtun 95 20.3 %
Tajik 290 62.1 %
Hazara 81 17.3 %
Uzbek 1 0.2 %
Total
467
100%
The women attending the different clinics reflected the ethnical composition of their
respective area.
Ethnical groups Central Polyclinic Karte Se Qasabai Qalae Zaman Khan
Pashtun 18 9 35 33
Tajik 83 41 88 78
Hazara 15 60 1 5
Uzbek 0 1 0 0
Total 116 111 124 116
Literacy and Schooling
Out of the 468 women interviewed, 27% declared to be able to read a newspaper
easily and 11% with some difficulty. The remaining 62% was illiterate.
64% did not attend a regular school. From the 169 women who did go to school,
about 60% continued school after primary school.
Schooling level Frequency Percent
Incomplete 32 18.9 % Primary School
Complete 37 21.9 %
Incomplete 22 13.0 % Secondary School
Complete 41 24.3 %
Higher education 37 21.9 %
TOTAL 169 100 %
Literacy among women attending the polyclinics was significantly higher than among
those attending the MCH clinics (chi square, p=0.001).
Easily With difficulty Not at all
Able to read
newspaper
N % N % N %
Polyclinics 84 34.9 22 9.1 135 56.0
MCH clinics 43 18.9 27 11.9 157 69.2
TOTAL 127
27.1
49
10.5
292
62.4
The female adult literacy rate found in this survey is low but still quite better than the
national estimates for the whole of Afghanistan: 16% (10 – 21%) for adult women
(source: UNICEF).
This can be explained by two selection bias:
o More literate women in urban areas like Kabul city
o More literate women attending health facilities
Marital status
Out of the 468 women between 15 and 49 years old, 86.3% were married.
14
Marital status Frequency Percent
Married 404 86.3 %
Single 49 10.5 %
Widowed 15 3.2 %
Separated / divorced 0 0.0 %
Total
468
100 %
Of the married women, 400 (99%) lived currently with their husband.
Wedding age
For the 419 ever married women, the mean age at marriage was 17.2 years. 16,2%
of them married at the age of 14 years or younger.
The mean age of marriage did not differ significantly among the four different health
centres (anova p=0.196).
Age of
marriage
N Mean
Age
S.D. P
25
Median P 75 Min Max <= 14
years
TOTAL
419
17.2 y
3.3
15 y
17 y
19 y
7 y
34 y
16.2%
(Un)employment of husband
Of the married women, 73 (15.6 %) reported their husband to be unemployed. 46.6
% were unemployed since less than 6 months; 24.6 % between 6 months and 5
years and 28.8% were unemployed since 5 years and more.
100 women or 24.9% said that their husbands were doing occasional labour. 228 or
48.7% of women’s husbands were reported to have a more or less permanent
regular job.
Profession of the husband
Most of the husbands had an income trough small private business. More than a
quarter was on official government pay roll.
Sector Clarification Frequency Percent
Agriculture Land owner, farmer 8 2.0 %
Informal sector Street vendor, daily worker, porter,
servant, …
71 17.9 %
Manufacturer Construction, bakery, tailor, mechanic
…
43 10.8 %
Industry Factory work 24 6.0 %
Shop keeper, business man 69 17.4 %
Driver 27 6.8 %
Private business /
trade
Work in an organization or company 5 1.3 %
Government employee
(administrative work)
58 14.6 %
Teacher, doctor, engineer 17 4.3 %
Official sector
Army, police 54 13.6 %
Other 21 4.5 %
TOTAL 397 100 %
15
Literacy level and Schooling of husbands
Out of 401 married women, 56.4 % declared that their husbands were able to read a
newspaper easily and 13.0 % with some difficulty. Only 30.7 % of the husbands
appeared to be illiterate.
68.9 % of the husbands were reported to have been to a regular school.
From the 276 husbands who did attend school, almost 75 % continued school after
primary school.
Schooling level Frequency Percent
Incomplete 34 12.3 % Primary School
Complete 38 13.8 %
Incomplete 37 13.4 % Secondary School
Complete 86 31.2 %
Higher education 81 29.3 %
TOTAL 276 100%
No difference in literacy rate was found for the husbands of the interviewed women
attending polyclinics or MCH clinics (chi square, p=0.228).
As for the women, the literacy rates of the husbands was better than the national
estimates for the whole of Afghanistan: 46% (18 – 51%) for adult men (source:
UNICEF).
Living status
Out of 463 women, 237 or 51.2 % had been living in the place where they are living
now since birth.
For the other 226 women, the time of arrival at the current place of living varied.
o 82 or 36.3 % arrived into Kabul less than 6 months ago
o 33 or 14.6 % arrived between 6 months ago but less than 1 year ago
o 50 or 22.1 % arrived between one and five years ago
o 61 or 27.0 % arrived five years or more ago in Kabul
About 38% of these women said they were returnees; about 42 % called themselves
displaced because of war and about 20 % moved to Kabul for another reason
(economic displacement most frequently mentioned as well as for family reasons).
For the global surveyed population, the living status is reflected in the table below:
Living status Frequency Percent
Resident 237 51.6 %
Returnee 84 18.3 %
War displaced 95 20.7 %
Other displaced 44 9.6 %
Total 460 100 %
Hence, nearly half of the interviewed women currently living in Kabul were not born
there. Half of the women who arrived at a later moment (25% of the global surveyed
population) arrived in Kabul during the last year, after the fall of the taleban regime.
These figures correspond with realities observed by other agencies: most of the
returnees are reported to end up in Kabul (UNHCR), visible overcrowding in Kabul
and rising number of homeless people in Kabul.
16
This continuous influx of people in Kabul city puts serious constraints on the already
limited capacity of the health care system.
Geographic accessibility of the health care facility
A question was asked regarding the distance between the health structure the
women were attending and their house. The average walking distance was around
25 minutes. Around 38 % of the interviewed women had to walk less than 15
minutes, but about 17% had to walk more than one hour to reach the health facility.
Health care seeking behaviour
The first place the women mentioned to go to for treatment when they were sick, is
shown in the following table:
Sector Clarification Frequency Percent
Traditional healer 7 1.5 %
Relative 10 2.2 %
Other
Community health worker 5 1.1 %
Private pharmacy / shop 72 15.5 %
Private clinic (doctor) 117
25.2 %
Private nurse 1 0.2 %
Private hospital 6 1.3 %
Private sector
SUBTOTAL private sector 196 42.2 %
Public health centre 136
29.2 %
NGO supported health centre 57 12.3 %
Public hospital 54 11.6 %
Public sector
SUBTOTAL public sector 247 53.1 %
TOTAL 465 100 %
More than half of the women seemed to prefer the public health sector for treatment
in first instance. Public primary health care services are usually inexpensive.
Nevertheless, the table also shows the importance of the private sector as health
care provider in an urbanised area like Kabul city, despite the higher costs.
Health care permission
Before going to a health centre, most of the women reported to have to ask
permission from either their husband or another male relative.
From the women who did never or sometimes ask permission, 65.6% were 30 years
old or more.
Taking permission Frequency Percent
Never 11 2.4 %
Sometimes 21 4.6 %
Most of the times 16 3.5 %
Always 406
89.4 %
Total 454 100 %
17
2. Obstetrical indicators
Pregnancies
Of 402 currently married women 116 women or 28.7 % said to be pregnant at the
time being while 9 (2.2%) did not know.
The interviewed pregnant women were significantly younger than the non-pregnant
ones attending the consultations (anova p=0.000). About half of the currently
pregnant women (47.5 %) were 24 years old or younger.
Of all 417 ever-married women (403 married and 14 widows), 95.2% had ever been
pregnant before (disregarding current pregnancies). The mean number of total
previous pregnancies per age group as well as the median and sum of previous
pregnancies is presented in following table.
The national total fertility rate is estimated at 6.8. (Note: Total fertility rate= total
number of children a woman would have by the end of her reproductive period if she
experienced the currently prevailing age-specific fertility rates throughout her
childbearing life.)
The figures found during the survey are close and coherent with this national
estimate.
PREVIOUS PREGNANCIES PREGN.NOW
Age category married
women
N before
pregnant
% before
pregnant
Mean #
pregnanc.
% women
> = 6
times
pregnant
% pregn now
15 – 19 years 22 15 68.2 %
.82
0% 66.7 %
20 – 24 years 101 96 95.0 %
2.44
3.1 % 41.8 %
25 – 29 years 90 86 95.6 %
4.11
24.4 % 31.1 %
30 – 34 years 86 86 100 %
6.45
64.0 % 20.5 %
35 – 39 years 69 66 95.7 %
7.01
72.7 % 19.4 %
40 – 44 years 28 27 96.4 %
7.61
81.5 % 8.0 %
45 – 49 years 21 21 100 %
7.57
66.7 % 5.0 %
TOTAL 417 397 95.2 %
4.90
41.1 % 28.7 %
Multiparity
41% of the women who had ever been pregnant before had been pregnant at least
6 times. This percentage increases to more than 60 % after the age of 30 years,
and to 75 % in women aged 40 and more.
Pregnancy outcome
Of all counted pregnancies in the obstetrical history of the interviewed women, about
86% resulted in live births.
18
Outcome of previous pregnancies
Age category Sum all
pregnancies
Abortions Still births Live births
15 – 19 years 18 0 1 17
20 – 24 years 246 34 3 207
25 – 29 years 370 48 8 314
30 – 34 years 555 78 11 466
35 – 39 years 484 52 3 429
40 – 44 years 213 22 7 184
45 – 49 years 159 27 10 140
TOTAL 2045 261 43 1757
% of total
pregnancies
100 % 12.8 % 2.1 % 85.9 %
Sex ratio = 795 living girls / 784 living boys = 1.014. This ratio indicates a good
quality of the survey results.
Outcome of previous pregnancies
Abortions
13%
Live births
85%
Still births
2%
Age of first delivery
For 387 (ever) married women who had been pregnant before, the mean age at first
delivery was 18.8 years (note: delivery has been defined as delivery of dead or live
born baby, but excluding abortions).
Teenage pregnancies – mother between 13 and 19 years old - are internationally
recognised as a risk factor for the mother as well as for the baby.
Nevertheless, more than two third of the interviewed (ever) married women (67.2%)
had delivered their first child before the age of 20 years and almost 4% even before
the age of 15 years old.
Total
number
Mean
Age
S.D. P
25
Median P 75 Min Max < = 14
years
15 - 19
years
387
18.8 y
3.24
17 y
18 y
20 y
13 y
38 y
3.9%
63.3%
For 386 (ever) married women, the mean interval between their wedding age and
their age at first delivery was only 1.7 years (median 1 year)
19
Interval between deliveries
The mean interval between the consecutive deliveries has been calculated through
dividing the time interval between the first and last delivery (in years) by the number
of previous deliveries minus 1.
The average time between two deliveries has been estimated at about two and a
half years only. The younger the age of the woman, the shorter the interval between
her pregnancies appeared to be.
Age category N Mean interval S.D.
15 – 19 years 2
1.0 y
0
20 – 24 years 57
1.8 y
1.0
25 – 29 years 72
2.1 y
1.1
30 – 34 years 82
2.6 y
1.4
35 – 39 years 65
2.6 y
1.2
40 – 44 years 25
2.6 y
1.3
45 – 49 years 18
4.6 y
3.3
TOTAL 321
2.5 y
1.5
Home deliveries versus institutional deliveries
Out of a total of 1777 deliveries, 1196 or 67.3 % were reported to have occurred at
home and 581 or 32.7 % in a health facility.
From the 389 women who had ever given birth, 39.3 % delivered exclusively at
home and only 18.8% delivered exclusively in a medical facility.
41.9% of the women delivered some children at home and some in a health facility.
Sexual education
Only 16.2 % of the women (73 on 451) said that they knew “how babies were made”
when they were 15 years old.
The ones who were informed, got the information from a relative in 64% of all cases.
31% were informed through the health centre.
Breastfeeding knowledge
80.5 % of the women (363 on 451) said yes when they were asked whether anyone
had informed them of the benefits of breastfeeding their babies.
69.5 % out of these 363 women got the information from someone from a health
facility, 22 % from relative and 8.5 % through other channels (like books, radio and
TV).
Child mortality
Of 389 interviewed mothers who delivered at least one live child , 114 women or
29.3% had lost at least one of their children.
20
In total 185 dead children were counted among the surveyed population:
o Within 24 hours after birth: 32
o After one day but within 7 days after birth: 18
o After one week but before the age of 1 year: 75
o Between 1 and below 5 years: 37
o Between 5 years and below 14 years: 16
o 14 years and more: 4
Taking in account the moment of the last delivery, the counted deaths results in
following estimated mortality rates for the surveyed population:
Still birth rate
= still births / 1000 live births
= 24 still births per 1000 live births (95% C.I. 16/1000 to 38/1000)
Perinatal mortality rate
= Deaths occurring during late pregnancy (at 22 completed weeks gestation and
more), during childbirth and up to seven completed days of life / 1000 total births
= 50 perinatal deaths / 1000 births (95% C.I. 37/1000 to 67/1000)
Early neonatal mortality rate
= deaths occurring within first 7 days after birth / 1000 live births
= 28 early neonatal deaths / 1000 live births (95% C.I. 18/1000 to 41/1000)
Infant mortality rate
= deaths occurring before age of 1 year / 1000 live births
= 64 infant deaths / 1000 live births (95% C.I. 47/1000 to 86/1000)
These estimates are better than the estimated national figures. This was to be
expected as the women surveyed belonged to a favoured group: living in Kabul city
and having access to primary health care facility.
Even within this privileged group indicators are very poor compared to international
standards.
The high neonatal mortality rates reflect a bad obstetric and paediatric care
system.
National estimate
(WHO/ UNICEF)
Surveyed
population
Developed
countries
Developing
countries
Still birth rate 70 24 [16 – 38] 5 > 20 (32)
Perinatal
mortality rate
120 50 [37 – 67] 8 - 11 >30 (57)
Early neonatal
mortality rate
70 28 [18 – 41] < 5 > 10 (26)
Neonatal
mortality rate
121 N.A. 5 - 10 34 – 42 (39)
Infant mortality
rate
161 – 165 64 [47 – 86] 6 - 8 59 – 64
21
3. Antenatal Care
Note: All questions in this and in the following chapter were related to the last
pregnancy resulting in the delivery of a dead or live born child (thus with exclusion of
abortions as well as current pregnancies).
In average the last delivery took place 2.6 years ago (N= 390 women; S.D. 0.16;
median 2 years; P25 1 year; P75 3 years). Four women (1%) reported that their last
baby was born death. Probably the number of stillbirths is underestimated, and
misclassified as abortions.
Antenatal Care Attendance rate
Out of 389 women, 308 women or 79.2% attended the antenatal consultations during
their last pregnancy.
The person the women went to see for antenatal care was:
- Traditional Birth Attendant (TBA): 2 or 0.6%
- Midwife: 28 or 9.1%
- General doctor: 7 or 2.3%
- Gynaecologist: 266 or 86.4%
- Other: 5 or 1.6%
Thus 77.6% of the women were attended at least once during last pregnancy by
skilled health personnel. This is better than the world average that is 70% (98% in
industrialized and 65% in developing countries).
Almost all antenatal care providers were female (only 5 or 1.6% were male (2 doctors
and 3 gynaecologists)).
First antenatal visit and regularity
The first antenatal visit took place in average at 5 months pregnancy.
• 25.4 % went for first antenatal services during the first trimester
• 50.8 % went during second trimester
• 23.8 % went during the last trimester
In average 3.7 antenatal consultations took place during the last pregnancy for 307
women attending the ANC. (P25: 3 visits ; median 3 visits; P75 5 visits).
But 34 women or 11.1% went only once for antenatal care. On the other hand 25
interviewees or 8.2% did go a quite excessive number of times (7 visits or more).
1 visit 2 visits 3 visits 4 visits 5 visits More than 5
11.1 % 13.4 % 31.3 % 18.9 % 12.1 % 13.3%
Tetanus vaccination
Out of the 389 women, 70% received at least one tetanus vaccination during their
last pregnancy (in average 2.7 doses)
82.3% of the women had been vaccinated at least once in lifetime. In average 4.6
doses were administered.
Still 42.1% of the women had received only 3 doses or less till the moment of their
last delivery.
22
% received >= 1
tetanus vaccine
Mean doses
received
Registered on
vaccination card
During last pregnancy 69.9 % (n=272) 2.7 doses 97.8 % (n=266)
Before last pregnancy 55.4 % (n=219) 3.4 doses 98.2 % (n=215)
Total (any time before last
delivery)
82.3% (n=321) 4.6 doses
Reasons / obstacles to antenatal care
The acceptability of antenatal care services was apparently good and accessibility
did not seem to be a major problem.
Out of 390 women, 349 women (89.5%) said they would attend antenatal
consultations next time they were pregnant, if they have the possibility to do so.
Just 5.1% (20 women) said no and 5.4% (21 women) did not know.
Among the mentioned barriers , only 14 % were related to lack of accessibility to
ANC.
OBSTACLES Clarification frequency Percent
Too far away 1 2.8 %
Too expensive 1 2.8 %
Services not good 1 2.8 %
Accessibility
Husband /family did not allow 2 5.6 %
Nobody advised me to go 1 2.8 %
Do not know 8 22.2 %
Do not want more pregnancy 17 47.2 %
Other
Cannot be pregnant anymore 5 13.9 %
TOTAL 36 100 %
The main reason the women expressed for going to the antenatal consultations is
presented in the table below:
Reasons for ANC Frequency Percent
I am sick and want medical treatment for myself 104
28.4 %
I want to know if health of my baby is OK 144
39.3 %
I want to know if my health is OK 25 6.8 %
To get vaccination for free 48
13.1 %
To get med. supplements ( Fe, vitamins…) free 10 2.7 %
To receive information about my pregnancy 11 3.0 %
Combination of above reasons 5 1.4%
I do not know 19 5.2 %
TOTAL 366 100 %
4. Safe delivery
Last delivery place
Regarding the last place the interviewed women delivered, the majority of the women
said to have given birth at home.
23
From the ones who delivered in a health institution, almost 87% choose for a public
health structure.
Last del. place Frequency Percent Type health structure Percent
Home 229
59.2 %
Public hospital 65.8%
Public health centre 20.9 %
Private hospital 9.5 %
Institution 158 40.8 %
Private clinic 3.8 %
TOTAL 387 100 %
A high percentage (83.5%) of the women who delivered in a health institution, were
(very) satisfied with the care they had received in that institution.
Institutional delivery care
Satisfaction
Frequency Percent
Not satisfied 11 7.0 %
Little satisfied 15 9.5 %
Satisfied 82
51.9 %
Very satisfied 50 31.6 %
TOTAL 158 100 %
Assistance at delivery
55.8 % of the last deliveries were assisted by skilled health personnel.
In more than 99%, a female person assisted the last delivery. (3 exceptions were
noted: 2 husbands and one male gynaecologist).
Skilled birth attendance occurred logically for almost all institutional deliveries.
But also about 26 % (59 out of 229 women) of the women who delivered at home
were attended by a health professional. Mostly midwifes were appealed to in this
case (2/3 of skilled deliveries at home).
Equally interesting is the fact that among the non-skilled personnel, female relatives
were usually assisting the home deliveries, twice as frequently as TBAs.
Among the skilled personnel, gynaecologists were the most represented category of
health personnel.
For home
deliveries (%)
For institutional
deliveries (%)
Total
frequency
Total
percent
Nobody 7.4 % 0.6 % 18 4.7 %
Traditional Birth Attendant 17.5 % 40 10.3 %
Female relative
48 %
110 28.4 %
Other 1.3 % 3 * 0.8 %
Subtotal unskilled att. 74.2 % 0.6 % 171 44.2 %
Nurse 2.2 % 5.7 % 14 3.6 %
Midwife 17.5 % 19.0 % 70 18.1 %
Doctor 0.9 % 24.1 % 40 10.3 %
Gynaecologist 5.2 %
50.6 %
92 23.8 %
Subtotal skilled attendant 25.8 % 99.4 % 216 55.8 %
TOTAL 229 158 387 100 %
* Among the 3 other persons mentioned: 2 husbands and 1 neighbour assisted
24
Assistance at home deliveries
Gynaecol.
5%
Traditional
Birth
Attendant
18%
Nobody
7%
Doctor
0%
Midwife
18%
Other
1%
Nurse
2%
Female
relative
49%
The percentage of births attended by skilled personnel for the surveyed population is
far higher than the national estimate of 8 to 11 %.
This can be explained by following factors:
• More skilled health professionals are present in Kabul as well as 3 accessible
public maternity hospitals in Kabul city
• Selection bias: only women who have access to health facilities are included
in the survey
Main reason for not delivering in a health structure
Women who delivered at home were asked why they had not delivered in a health
facility. The results show a variety of reasons. Geographic inaccessibility represents
32.4 % of all causes; cultural and financial barriers represent respectively 17.8 % and
16.9 %.
Clarification Frequency percent
Health structures are too far away 41
18.2 %
Geographic
accessibility
There is a problem with transport 32
14.2 %
Financial
accessibility
Institutional deliveries are too expensive 38
16.9 %
Husband - family did not allow me to / I had no
permission to go
27
12.0 %
Cultural
accessibility
Not the general way of doing – thinking over here 13 5.8 %
Not useful for me / I deliver easily 15 6.7 %
I did not want to go / I fear hospital 7 3.1 %
Personal
factors
I did not have information where to go 3 1.3 %
It was night 3 1.3 %
Situation was bad / there was fighting 10 4.4 %
I did not have time 12 5.3 %
Environmental
factors
I was alone / no male around to accompany me 8 3.6 %
Skilled personnel available in my house 5 2.2 %
Services in clinics / hospitals are not good 5 2.2 %
Health care
related
Doctors are usually men 1 0.4 %
Other I do not know / other reason 5 2.2 %
TOTAL 225 100 %
25