Báo cáo " Impact of export variety on productivity in Japan " docx
Bạn đang xem bản rút gọn của tài liệu. Xem và tải ngay bản đầy đủ của tài liệu tại đây (140.97 KB, 13 trang )
VNU Journal of Science, Economics and Business 28 (2010) 47-59
47
Impact of export variety on productivity in Japan
Nguyen Anh Thu*
Faculty of International Business and Economics, University of Economics and Business,
Vietnam National University, Hanoi, 144 Xuan Thuy, Cau Giay, Hanoi, Vietnam
Received 5 September 2010
Abstract. This paper underlines the idea of endogenous growth theory that new or higher quality
products have significant impacts on productivity and economic growth. Different with previous
studies, this paper uses a quite comprehensive definition of variety, which distinguishes the
country of origin of the products. With disaggregated level of export data of Japan from 1980 to
2000, the empirical results suggest that nearly half of the industries studied have positive and
significant relationship between varieties and Total Factor Productivity (TFP). Most of the
industries, which show the positive and significant relationship between export variety and TFP,
are secondary industries. This conclusion may bring an implication for Japan to produce more
differentiated products to help increase its TFP.
1. Introduction
*
What lies behind the economic growth of
Japan - the second economy in the world - is
the concern of many economists. A great
number of studies have contributed to
answering this question. In this article, the
author would like to address one small part of
the question by testing endogenous growth
theory, which emphasizes the impacts of new or
higher quality products on productivity and
economic growth.
For the period 1980-2000, economic growth
of Japan had experienced dramatical changes.
In the 1980s, Japan had great economic growth
as well as great diversification, leading to high
productivity of the whole economy (Total
Factor Productivity - TFP). From 1993, Japan’s
economy entered a period of economic
______
* Tel: 84-904655168
E-mail:
stagnation. Product variety of Japan had also
changed in a sophisticated way during this
period. Since the mid-1980s, specialization and
the expansion of foreign direct investment
became trends in the Japan’s economy, which
might reduce the range of exported products.
However, solid developments of Japan’s
economy might have the opposite effect on
variety. In the stagnation period, we expect that
product varieties might decrease because of the
slow-down of production. Also the conclusion
of many bilateral trade agreements in this
period might affect Japan’s trade composition
as well as its varieties (Parsons, 2000 and
Greaney, 1998). This paper will address an
interesting question: What role did product
variety play in all these ups and downs of
Japanese economy?
The paper will study the impact of export
variety of Japan over the period 1980-2000 on
TFP of 21 main sectors of Japan’s economy
during this period to answer the above question.
N.A. Thu / VNU Journal of Science, Economic and Business 26, No. 5E (2010) 47-59
48
The following section will deal with literature
review and methodology of the paper. The third
sections then present the data, empirical
specifications and result. The fourth section will
come up with a conclusion.
2. Literature review and methodology
Endogenous growth models (Romer, 1990;
and Grossman and Helpman, 1991) have
emphasized the impacts of new or higher
quality products on productivity and economic
growth. The term “product variety”, therefore,
has become familiar in economic growth
literature.
Both variety of the inputs (input variety)
and variety of the final products (output variety)
have their relationship with productivity. This
study limits on the relation between output
variety and productivity. The following graph
illustrates this relation.
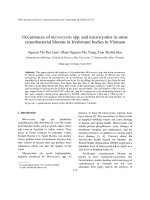
The increase in output variety - holding
fixed the level of inputs - can be expected to
raise the value of output, i.e. raising the
productivity. This is illustrated in Figure 1 by
the transformation curve between the outputs x
1
and x
2
.
Source: Adapted from Feenstra et al. (1999a)
Figure 1: Output Variety.
At the beginning, only production of good
x
1
is feasible. In that case, the production would
occur at A, and the value of production is
illustrated by the budget line AB. However, if
production also allows the production of good
x
2
, given the same level of resources, then
production will move along the transformation
curve to point C, with a higher budget line,
representing a higher value of production. The
value of production has increased while the
level of inputs is fixed. This shows the increase
of productivity due to new output varieties.
A number of papers have used export
variety as a measurement of output variety. The
idea is that the increase in export variety can
increase the competitiveness of the country in
the world market and thus increase
productivity. Especially for secondary
industries, which produce differentiated
products, variety plays an important role in
improving productivity.
Feenstra et al. (1999a) applied export
variety indices to analyze the relationship
between the changes in variety and the growth
in TFP of South Korea and Taiwan in 16
sectors during 1975-1991 period. They found
that export variety has a positive and significant
effect on TFP of secondary industries.
The same measure of computing export
variety has been used by Funke and Ruhwedel
N.A. Thu / VNU Journal of Science, Economic and Business 26, No. 5E (2010) 47-59
49
(2005) to analyze economic growth across 14
East European transition economies. Using a
panel dataset from 1993 to 2000, they conclude
that export variety plays a significant role in
fostering the economic growth in these
countries. Similarly, Feenstra and Kee (2006)
argue that the growth of export varieties
benefits the aggregate productivity in exporting
countries, whereas Feenstra and Kee (2007)
study the effect of trade liberalization on export
variety. They found that the US tariff
reductions due to NAFTA had a significant
effect on increasing export variety from Mexico
and China to the United States.
This paper will measure export variety of
Japan over the period 1980-2000 and study the
relationship between export variety and
productivity. This relationship is expressed by
the following equation, which is adapted from
Feenstra (1994), Feenstra (2003) and Nguyen
Anh Thu (2009):
1,
1
Re
(1)
(1)
tt
TFPVA
σ
−
=−∆
−
∆VAR
et-1,t
is the change in export variety of
two years t-1 and t. Since the elasticity of
substitution
σ
<0, the first part on the right
hand side of the above equation (
1(1)
σ
−−
) will
be positive. This implies that
1,
Re
tt
VA
−
∆
and
TFP will have positive relationship. The
increase in export variety should raise TFP and
vice versa.
In order to calculate export variety indices
of Japan, this paper applies the method
developed by Feenstra (1994) and extended by
Nguyen Anh Thu (2009) as follows:
1
1
1,
1111
()
Relnln (2)
()
t
t
itititit
iIiI
t
tt
titititit
iIiI
pxpx
I
VA
Ipxpx
λ
λ
−
∈∈
−
−
−−−−
∈∈
∆==
∑∑
∑∑
where x
it
, x
it-1
are the export of good i in period
t and t-1, respectively; p
it
and p
it-1
are the export
prices of good i in two periods. I
t
, I
t-1
are the
sets of export available in period t and t-1. The
set of export products is changing over time,
but there are some products available in both
periods
1
tt
III
−
=∩ .
3. Data
The period between 1980 and 2000 witnessed
dramatic changes in the export performance of
Japan. In the 1980s, Japanese economy had solid
growth whereas it experienced long term
stagnation during the 1990s.
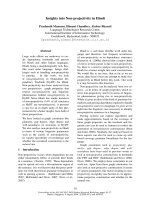
Figure 2 presents export values of Japan
from 1980 to 2000. In 1980s, export values
steadily increased. In the early 1990s, despite
stagnation, Japan’s export volume still
increased. However, there was some slowdown
in exports in the late 1990s.
In this paper, a good is defined as a four or
five digit SITC-2 category, and a variety is the
export of a particular good from a particular
country (Arminton, 1969). This definition is
different with that in previous studies of
variety, which defined a variety as the export of
a particular goods from all countries, regardless
the country of origin. Using this definition of
variety and a simple count-based method, we
see the changes of export varieties of 21 sectors
and total export varieties between 1980 and
2000, illustrated in table 1. Despite the growth
of total export volume, export variety by the
simple count-based method decreased quite
sharply, from 58403 varieties in 1980 to 43552
varieties in 2000, meaning a decrease of nearly
30%.
N.A. Thu / VNU Journal of Science, Economic and Business 26, No. 5E (2010) 47-59
50
0
100000
200000
300000
400000
500000
600000
years 1980-2000
Source: UNComtrade database.
Figure 2: Japan’s export value (1980-2000).
Table 1: Simple count-based variety in Japan’s exports (1980-2000)
Industry 1980 2000
1
Agriculture 756 689
2
Food and kindred products 958 923
3
Textile mill products 5915 3846
4
Apparel 2642 1839
5
Lumber and wood 606 338
6
Furniture and fixture 589 433
7
Paper and allied 1309 992
8
Printing, publishing and allied 876 662
9
Chemicals 7807 6424
10
Petroleum and coal products 427 272
11
Leather 179 105
12
Stone, clay, glass 1648 1284
13
Primary metal 4091 2861
14
Fabricated metal 4950 3419
15
Machinery, non-elect 9436 7844
16
Electrical machinery 5279 3818
17
Motor vehicles 478 353
18
Transportation equipment and ordnance
447 372
19
Precision instruments 4480 3074
20
Rubber and misc. plastics 1531 1374
21
Misc. manufacturing 3999 2630
Total 58403 43552
Source: UNComtrade database, compiled by author.
sd
In the simple count-based method, export
variety shows a decrease over the 21 years.
However, it only provides us with a rough
estimate of the changes in variety. We have to
measure more accurate export variety indices as
described in previous section and see how
N.A. Thu / VNU Journal of Science, Economic and Business 26, No. 5E (2010) 47-59
51
export variety changes. To compare the changes
of export variety between the two years t and
t-1 (
1,
Re
tt
VA
−
∆
), equation (2) will be used, then
the result will be multiplied by 100 to have the
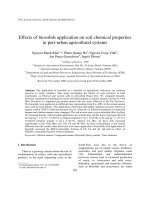
rate in percent terms. Appendix 1 shows the
changes in export varieties for 21 sectors of
Japan from 1980-2000.
In order to smooth the variety indices, a 3-
year moving average is calculated
(
21
Re1/3(ReReRe)
itititit
MAVAVAVAVA
−−
∆=∆+∆+∆
.
Another reason for calculating the moving
average is that TFP in one year can be affected
by the variety of the previous years. The
increase (or decrease) in import variety in one
year, meaning the changes in intermediates
input, may take some time to influence TFP.
Beside export variety, TFP is affected by
R&D as well. More specifically, technology
progress and R&D activities in one industry
help to expand variety of that industry, leading
to the increase of the competitiveness, which in
turn increases productivity of the industry.
R&D data is taken from the ESRI-HISTAT-JIP
project launched by Economic and Social
Research Institute (ESRI) and the statistics of
the Ministry of Internal Affairs and
Communications of Japan
(1)
. R&D index for
each industry is calculated as the expenditure
on R&D over output of that industry. R&D
might have the lagged effects on TFP because
research and development may take some time
to become realized in production. Therefore,
R&D indices are adjusted for a 3-year moving
average, similar to that done for export variety.
The data on TFP for Japan are from the
ICPA project launched by RIETI (Research
Institute of Economy, Trade and Industry)
(2)
.
This project provides us with TFP for 33
sectors, 21 of which are analyzed in this paper
(I exclude services and some other industries
such as mining, construction). This project is
based on the EU KLEMS framework, i.e.,
industry level data on capital (K), labor (L),
energy (E), material (M), service (S) as well as
gross output to produce the TFP values.
TFP is measured as a Divisia index, i.e. the
rate of growth of output minus a weighted average
of the growth of inputs. Appendix 2 shows the
growth (in percent) of TFP for 21 industries of
Japan for 21 years, from 1980 to 2000.
4. Empirical specification and results
The relation between export variety and TFP
will be estimated by the following equation:
Fdg
eRe& (3)
itiiiitiitiitit
TFPSTAGDUMMYMAVARSTAGMAVAMARDαβγµηε=++++×++
fh
(1)
where
i
α
is a constant term for each
industry i,
i
β
is a dummy variable capturing the
impact of stagnation in Japan starting from
1993,
i
γ
is the estimated relation between the
change in export variety and the growth in TFP
in one industry.
i
µ
is the effect of the
interaction between stagnation and variety on
TFP, whereas
i
η
is the estimated effect of R&D
expenditure on TFP. Variety and R&D indices
______
(1)
Websites:
are adjusted for the moving average of three
years as explained in previous section.
(2)
The results of the regressions are reported in
table 2. The values in bold are the coefficients that
are positive and significant at a 10% level. There
are nine such industries. Among them, six
industries, including furniture and fixture, leather,
fabricated metal, non-electrical machinery,
electrical machinery and rubber and
miscellaneous plastics, are secondary industries.
All of these six industries produce highly
differentiated products. For industries like
furniture and fixture, leather, electrical machinery
______
(2)
Website:
N.A. Thu / VNU Journal of Science, Economic and Business 26, No. 5E (2010) 47-59
52
and rubber and miscellaneous products, producing
new products to respond to the ever increasing
demand of consumers is the crucial task.
Industries like fabricated metal, non-electrical
machinery also require the supply of a new range
of products to other manufactured industries. New
products and therefore new variety plays an
important role in these industries. Productivity has
to be improved to produce more variety and vice-
versa; variety will increase when productivity
grows. This is the basis of endogenous growth
theory: the expansion of export variety plays an
important role in productivity growth. Table 2
also shows that Japanese major exports, such as
fabricated metal, non-electrical machinery and
electrical machinery, are well explained by
endogenous growth theory.
Table 2: Coefficients of (moving average) export varieties (1980-2000)
Industry MAVARe t-statistics
R
2
1 Agriculture -0.09 -0.41 0.15
2 Food and kindred products 0.56 0.80 0.12
3 Textile mill products
3.49 3.74
0.26
4 Apparel -2.07 -1.11 0.17
5 Lumber and wood
1.49 2.52
0.44
6 Furniture and fixture
2.95 1.68
0.36
7 Paper and allied 0.66 0.63 0.20
8 Printing, publishing and allied 0.83 1.43 0.44
9 Chemicals 0.24 0.40 0.43
10
Petroleum and coal products
1.24 3.09
0.55
11
Leather
0.57 2.27
0.38
12
Stone, clay, glass 1.29 1.32 0.26
13
Primary metal -1.66 -0.47 0.12
14
Fabricated metal
1.57 1.78
0.31
15
Machinery, non-elect
3.68 1.69
0.27
16
Electrical machinery
4.60 2.27
0.41
17
Motor vehicles -0.70 -0.38 0.04
18
Transportation equipment and ordnance
-0.44 -0.73 0.08
19
Precision instruments 0.10 0.13 0.08
20
Rubber and misc. plastics
3.80 2.50
0.50
21
Misc. manufacturing 0.46 0.27 0.29
Note: The values in bold are the coefficients that are significant at a 10% level
Table 3: Coefficients of STAGDUMMY and STAG*MAVARe in export variety regressions
Industry STAGDUMMY
(t-statistics) STAG*MAVARe (t-statistics)
R
2
1 Agriculture 0.87 0.26 0.78 1.42 0.15
2 Food and kindred products 0.22 0.18 -0.54 -0.18 0.12
3 Textile mill products -0.84 -0.42 -1.79 -0.48 0.26
4 Apparel -1.22 -0.55 1.77 0.50 0.17
5 Lumber and wood 3.17 1.19 -0.15 -0.11 0.44
6 Furniture and fixture -0.74 -0.92 -2.88 -1.18 0.36
7 Paper and allied 0.70 0.49 -0.67 -0.30 0.20
N.A. Thu / VNU Journal of Science, Economic and Business 26, No. 5E (2010) 47-59
53
8 Printing, publishing and
allied -0.88 -0.61 1.10 1.41 0.44
9 Chemicals 0.55 0.30 1.31 1.04 0.43
10
Petroleum and coal
products
-6.12 -2.44
-0.61 -1.06 0.55
11
Leather
2.78 1.86
0.49 0.24 0.38
12
Stone, clay, glass 0.82 0.76 1.09 0.69 0.26
13
Primary metal 0.42 0.27 2.42 0.62 0.12
14
Fabricated metal -1.57 -1.27 -0.39 -0.22 0.31
15
Machinery, non-elect 0.92 0.41 0.51 0.19 0.27
16
Electrical machinery 1.68 1.12 -1.87 -0.69 0.41
17
Motor vehicles 0.41 0.25 3.42 0.56 0.04
18
Transportation equipment
and ordnance -1.56 -0.63 0.82 0.86 0.08
19
Precision instruments 1.90 1.18 1.62 1.27 0.08
20
Rubber and misc. plastics 0.04 0.02 -2.43 -1.56 0.50
21
Misc. manufacturing 2.69 0.96 1.94 0.82 0.29
Note: The values in bold are the coefficients that are significant at a 10% level.
Table 3 shows the coefficients of
STAGDUMMY and STAG*MAVARe variables.
Only petroleum and coal products has a negative
and significant coefficient of STAGDUMMY.
Generally, the results of these regressions show
no evidence of the relation between stagnation
and TFP.
Table 4: Coefficients of MAR&D in export variety regressions
Industry MAR&D t-statistics
R
2
1 Agriculture -61.24 -0.62 0.15
2 Food and kindred products 1.67 0.64 0.12
3 Textile mill products
5.45 1.77
0.26
4 Apparel 1.59 0.47 0.17
5 Lumber and wood 8.06 0.57 0.44
6 Furniture and fixture
-0.97 -1.82
0.36
7 Paper and allied -4.60 -0.65 0.20
8 Printing, publishing and allied -1.45 -0.35 0.44
9 Chemicals -0.87 -1.33 0.43
10 Petroleum and coal products -2.12 -0.65 0.55
11 Leather -2.82 -1.40 0.38
12 Stone, clay, glass -0.12 -0.07 0.26
13 Primary metal 4.74 0.84 0.12
14 Fabricated metal 5.68 1.04 0.31
15 Machinery, non-elect -0.92 -1.29 0.27
16 Electrical machinery 0.19 1.01 0.41
17 Motor vehicles -0.08 -0.15 0.04
18
Transportation equipment and
ordnance 0.09 0.09 0.08
N.A. Thu / VNU Journal of Science, Economic and Business 26, No. 5E (2010) 47-59
54
19 Precision instruments -0.10 -1.23 0.08
20 Rubber and misc. plastics 5.36 0.82 0.50
21 Misc. manufacturing -1.77 -1.61 0.29
Note: The values in bold are the coefficients that are significant at a 10% level.
Table 4 shows no evidence of a positive
relation between R&D and TFP. Only one
industry (textile mill products) has a positive
and significant coefficient of MAR&D. Similar
to the import variety regressions, separate
regressions for each industry might not capture
the long term effect of R&D on TFP.
Next, we look at the result of fixed effect
panel regressions. Table 5 shows that both
MAVARe and MAR&D have positive and
significant coefficients. The result strongly
confirms the endogenous growth model: export
variety has positive and highly significant effect
on TFP. R&D index in the fixed effects panel
regressions has a coefficient of 0.05, which is
significant at a 5% level. This result confirms
our expectation that the increase in R&D
expenditure contributes to the improvement of
productivity. One problem is that there might
be a correlation between R&D and export
variety. If we spend more on R&D, we might
increase the export variety of the industry.
However, R&D might also lead to
specialization and thus reduce export variety. In
this case, the regressions result might overstate
or understates the effects of export variety since
we set export variety and R&D as two separate
variables.
Table 5: Fixed effects pooled least squares regression for 21 industries (export)
(3)
Variable Coefficient Std. Error t-Statistic Prob.
C
0.28
0.15
1.82
0.07
MAVARe
0.38
0.09
4.25
0.00
STAG*MAVARe 0.20 0.17 1.17 0.24
MAR&D
0.04
0.02
1.76
0.08
Total observations: 420
R-squared: 0.08
5. Conclusion
(3)
OLS regressions for each industry as well
as fixed effect PLS regressions for all 21
industries on export variety of Japan during
period 1980-2000 has contributed to evidence
supporting endogenous growth theory.
Specifically, nine out of 21 industries studied
show the positive and significant relation
between export variety and TFP. This result fit
well with the idea that the increase in export
variety can increase the competitiveness of the
country in the world markets and thus increase
productivity. Especially for secondary
industries, which produce differentiated
______
(3)
Fixed effects were found to be significant but not
reported here.
products, variety plays an important role in
improving productivity. This theory has also
been applied to Japan: six out of nine industries
with positive and significant coefficients of
variety, are secondary industries. However, this
paper has found no relation between stagnation
and TFP in Japan during 1980-2000 period. The
reason might be the relatively small size of the
data -20 years of annual data for each industry.
In the future, the extension of the data is
necessary and helpful.
The role of variety is widely illustrated in
many studies for many countries (Broda and
Weinstein, 2006; Jorgenson et al., 1987;
Kocherlakota and Yi, 1997). This paper
presents further evidence of Japan’s gain from
trade through variety. By trading more varieties
N.A. Thu / VNU Journal of Science, Economic and Business 26, No. 5E (2010) 47-59
55
of products, Japan’s TFP increases. With all the
ups and downs of Japan’s economy, export
varieties and TFP of many industries have
moved in one direction. The story is quite the
same with import varieties of Japan during
1980-2000 (see Parsons and Anh Thu Nguyen,
2009). This conclusion may bring an
implication: Japan should produce more
differentiated products to help increase its
productivity. More investment on R&D and
access to new foreign markets might be the best
way to this target.
Appendix 1
Changes of Japan’s export varieties for 21 industries
(1980-2000)
-10
0
10
20
30
82 84 86 88 90 92 94 96 98 00
VARE1
-2
-1
0
1
2
82 84 86 88 90 92 94 96 98 00
VARE2
-1.0
-0.5
0.0
0.5
1.0
1.5
82 84 86 88 90 92 94 96 98 00
VARE3
-2
-1
0
1
2
3
82 84 86 88 90 92 94 96 98 00
VARE4
-8
-4
0
4
8
12
82 84 86 88 90 92 94 96 98 00
VARE5
-2
-1
0
1
2
82 84 86 88 90 92 94 96 98 00
VARE6
-2
-1
0
1
2
82 84 86 88 90 92 94 96 98 00
VARE7
-4
-3
-2
-1
0
1
82 84 86 88 90 92 94 96 98 00
VARE8
-3
-2
-1
0
1
2
3
82 84 86 88 90 92 94 96 98 00
VARE9
N.A. Thu / VNU Journal of Science, Economic and Business 26, No. 5E (2010) 47-59
56
-20
-10
0
10
20
82 84 86 88 90 92 94 96 98 00
VARE10
-4
-2
0
2
4
6
82 84 86 88 90 92 94 96 98 00
VARE11
-3
-2
-1
0
1
2
3
82 84 86 88 90 92 94 96 98 00
VARE12
-2
-1
0
1
2
82 84 86 88 90 92 94 96 98 00
VARE13
-3
-2
-1
0
1
2
3
82 84 86 88 90 92 94 96 98 00
VARE14
-3
-2
-1
0
1
2
82 84 86 88 90 92 94 96 98 00
VARE15
-1
0
1
2
3
82 84 86 88 90 92 94 96 98 00
VARE16
-2.0
-1.6
-1.2
-0.8
-0.4
0.0
0.4
0.8
82 84 86 88 90 92 94 96 98 00
VARE17
-8
-4
0
4
8
12
82 84 86 88 90 92 94 96 98 00
VARE18
-2
-1
0
1
2
3
4
82 84 86 88 90 92 94 96 98 00
VARE19
-4
-3
-2
-1
0
1
2
82 84 86 88 90 92 94 96 98 00
VARE20
-2
-1
0
1
2
3
82 84 86 88 90 92 94 96 98 00
VARE21
N.A. Thu / VNU Journal of Science, Economic and Business 26, No. 5E (2010) 47-59
57
Appendix 2
Growth of Japan’s TFP for 21 industries (1980-2000)
-4
0
4
8
12
82 84 86 88 90 92 94 96 98 00
TFP1
-4
-3
-2
-1
0
1
2
82 84 86 88 90 92 94 96 98 00
TFP2
-2
0
2
4
6
82 84 86 88 90 92 94 96 98 00
TFP3
-6
-4
-2
0
2
4
6
8
82 84 86 88 90 92 94 96 98 00
TFP4
-10
-5
0
5
10
15
20
82 84 86 88 90 92 94 96 98 00
TFP5
-6
-4
-2
0
2
4
6
82 84 86 88 90 92 94 96 98 00
TFP6
-4
-2
0
2
4
82 84 86 88 90 92 94 96 98 00
TFP7
-4
-2
0
2
4
6
82 84 86 88 90 92 94 96 98 00
TFP8
-4
-2
0
2
4
6
82 84 86 88 90 92 94 96 98 00
TFP9
N.A. Thu / VNU Journal of Science, Economic and Business 26, No. 5E (2010) 47-59
58
-10
-5
0
5
10
15
20
82 84 86 88 90 92 94 96 98 00
TFP10
-8
-6
-4
-2
0
2
4
6
82 84 86 88 90 92 94 96 98 00
TFP11
-8
-4
0
4
8
82 84 86 88 90 92 94 96 98 00
TFP12
-6
-4
-2
0
2
4
6
82 84 86 88 90 92 94 96 98 00
TFP13
-4
-2
0
2
4
6
82 84 86 88 90 92 94 96 98 00
TFP14
-6
-4
-2
0
2
4
82 84 86 88 90 92 94 96 98 00
TFP15
-4
-2
0
2
4
6
8
82 84 86 88 90 92 94 96 98 00
TFP16
-3
-2
-1
0
1
2
3
82 84 86 88 90 92 94 96 98 00
TFP17
-8
-4
0
4
8
12
82 84 86 88 90 92 94 96 98 00
TFP18
-6
-4
-2
0
2
4
6
82 84 86 88 90 92 94 96 98 00
TFP19
-8
-6
-4
-2
0
2
4
82 84 86 88 90 92 94 96 98 00
TFP20
-4
-2
0
2
4
6
82 84 86 88 90 92 94 96 98 00
TFP21
References
[1] Armington, P. (1969), “A Theory of Demand for
Products Distinguished by Place of Production”,
International Monetary Fund Staff Papers, 16, 159-
178.
[2] Broda, C. and Weinstein, D.E. (2006),
“Globalization and the Gains from Variety”,
Quarterly Journal of Economics, 121(2), 541-585.
[3] Feenstra, R.C. (1994), “New Product Varieties and
the Measurement of International Prices”, The
American Economic Review, 84(1), 157-175.
[4] Feenstra, R.C. (2003), Advanced International
Trade - Theory and Evidence, Princeton, NJ:
Princeton University Press.
[5] Feenstra, R.C. and Markusen, J. (1994),
“Accounting for Growth with New Inputs”,
International Economic Review, 35, 429-447.
N.A. Thu / VNU Journal of Science, Economic and Business 26, No. 5E (2010) 47-59
59
[6] Feenstra, R.C., Madani, D., Yang, T. and Liang, C.
(1999a), “Testing Endogenous Growth in South
Korea and Taiwan”, Journal of Development
Economics, 60, 317-341.
[7] Feenstra, R.C., Yang, T. and Hamilton, G. (1999b),
“Business Groups and Product Variety in Trade:
Evidence from South Korea, Taiwan and Japan”,
Journal of International Economics, 48, 71-100.
[8] Feenstra, R.C. and Kee, H.L. (2006), “Export
Variety and Country Productivity”, NBER Working
Paper no. 10830, 2004 (revised).
[9] Feenstra, R.C. and Kee, H.L. (2007), “Trade
Liberalization and Export Variety: a Comparison of
Mexico and China”, The World Economy, 30(1), 5-21.
[10] Funke, M. and Ruhwedel, R. (2005), “Export
Variety and Economic Growth in East European
Transition Economies”, Economics of Transition,
13(1), 25-50.
[11] Greaney, T. (1998), “Assessing the Impacts of US-
Japan Bilateral Trade Agreements, 1980-1995”,
Mimeo. Syracuse University.
[12] Grossman, G.M. and Helpman, E. (1991),
Innovation and Growth in the Global Economy,
MIT Press, Cambridge, MA.
[13] Jorgenson, D.W., Gollop, F.M., and Fraumeni,
B.M. (1987), Productivity and U.S. Economic
Growth, Cambridge, Harvard University Press.
[14] Kocherlakota, N.R., Yi, K.M. (1997), “Is There
Endogenous Long-run Growth? Evidence from the
United States and the United Kingdom”, Journal of
Money, Credit, and Banking, 29(2), 235-262.
[15] Kwon, H.U. (2004), “Productivity Growth and R&D
Spillovers in Japanese Manufacturing Industry”,
Hitotsubashi University Research Unit for Statistical
Analysis in Social Sciences, A 21st-Century COE
Program, Discussion Paper Series no. 16.
[16] Nguyen Anh Thu (2009), “Variety in Japan (1980-
2000)”, Yokohama Journal of Social Sciences, Vol.
14, no. 3, pp. 95-109.
[17] Parsons, C.R. (2000), “Market-share Voluntary
Import Expansion (VIE) and Import Promotion with
an Application to Japan”, Doctoral Dissertation,
University of Hawaii.
[18] Parsons C. R. and Anh Thu Nguyen, (2009)
“'Import variety and productivity in Japan”,
Economics Bulletin, Vol. 29, no.3, pp. 1947-1959.
[19] Romer, P.M. (1990), “Endogenous Technological
Change”, Journal of Political Economy, 98(5), S71-
S102, Part 2.
Tác động của đa dạng xuất khẩu
đối với vấn đề năng suất ở Nhật Bản
Nguyễn Anh Thu
Khoa Kinh tế và Kinh doanh Quốc tế, Trường Đại học Kinh tế
Đại học Quốc gia Hà Nội, 144 Xuân Thuỷ, Cầu Giấy, Hà Nội, Việt Nam
Tóm tắt: Bài viết nhấn mạnh quan điểm về lý thuyết tăng trưởng nội sinh cho rằng sản phẩm mới
hoặc có chất lượng cao ảnh hưởng đến vấn đề năng suất và tăng trưởng kinh tế. Khác với những
nghiên cứu trước đây, bài viết vận dụng khái niệm tương đối toàn diện về tính đa dạng để phân biệt
nước xuất sứ của sản phẩm. Với các dữ liệu tới mức độ chi tiết trong lĩnh vực xuất khẩu của Nhật Bản
trong giai đoạn từ 1980-2000, kết quả cho thấy trong gần một nửa các ngành công nghiệp mà chúng
tôi nghiên cứu có tồn tại mối quan hệ tích cực và thiết yếu giữa sự tính đa dạng và Năng suất các yếu
tố tổng hợp (Total Factor Productivity - TFP). Hầu hết các ngành công nghiệp thể hiện mối quan hệ tích
cực và thiết yếu giữa sự đa dạng của hoạt động xuất khẩu và Năng suất các yếu tố tổng hợp đều là các
ngành công nghiệp thứ cấp. Kết luận này có thể bao hàm một gợi ý cho Nhật Bản trong việc tăng
cường sản xuất thêm nhiều sản phẩm đa dạng hơn nữa để nâng cao TFP của mình.