Volatile Organic Compounds in the Nation’s Ground Water and Drinking-Water Supply Wells pdf
Bạn đang xem bản rút gọn của tài liệu. Xem và tải ngay bản đầy đủ của tài liệu tại đây (9.98 MB, 112 trang )
C
C
C
O
C
C
H
H
H
H
H
H
H
H
H
H
H
H
Br
Br
Cl
C
C
C
H
H
H
H
H
C
Cl
Cl
Cl
H
ClCl
ClCl
C
C
C
C
C
C
H
H
H
H
H
H
C
H
H
C
C
H
H
H
C
C
Cl
Cl
Cl
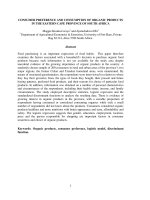
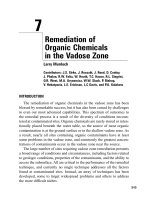
Perchloroethene
Toluene
Methyl tert-butyl ether
Chloroform
Dibromochloropropane
1,1,1-Trichloroethane
U.S. Department of the Interior
U.S. Geological Survey
Circular 1292
The Quality of Our Nation’s Waters
National Water-Quality Assessment Program
Volatile Organic Compounds in the Nation’s
Ground Water and Drinking-Water Supply Wells
“High quality water is more than the dream of the conservationists,
more than a political slogan; high quality water, in the right quantity
at the right place at the right time, is essential to health, recreation,
and economic growth.”
Edmund S. Muskie, U.S. Senator
Cover illustration. Three-dimensional molecular configuration
and composition of some of the compounds discussed in this
report.
The Quality of Our Nation’s Waters
Volatile Organic Compounds in
the Nation’s Ground Water and
Drinking-Water Supply Wells
By John S. Zogorski, Janet M. Carter, Tamara Ivahnenko, Wayne W. Lapham,
Michael J. Moran, Barbara L. Rowe, Paul J. Squillace, and Patricia L. Toccalino
Circular 1292
U.S. Department of the Interior
U.S. Geological Survey
U.S. Department of the Interior
DIRK KEMPTHORNE, Secretary
U.S. Geological Survey
P. Patrick Leahy, Acting Director
U.S. Geological Survey, Reston, Virginia: 2006
Available from U.S. Geological Survey, Information Services
Box 25286, Denver Federal Center
Denver, CO 80225
For more information about the USGS and its products:
Telephone: 1-888-ASK-USGS
World Wide Web: />Additional information about this national assessment is available at />assessment
Any use of trade, product, or firm names in this publication is for descriptive purposes only and does not imply
endorsement by the U.S. Government.
Although this report is in the public domain, permission must be secured from the individual copyright owners to
reproduce any copyrighted materials contained within this report.
Suggested citation:
Zogorski, J.S., Carter, J.M., Ivahnenko, Tamara, Lapham, W.W., Moran, M.J., Rowe, B.L., Squillace, P.J., and
Toccalino, P.L., 2006, The quality of our Nation’s waters—Volatile organic compounds in the Nation’s ground water
and drinking-water supply wells: U.S. Geological Survey Circular 1292, 101 p.
Library of Congress Cataloging-in-Publication Data
The Quality of our nation’s waters : volatile organic compounds in the nation’s ground water and
drinking-water supply wells / by John S. Zogorski [et al.].
p. cm. (Circular 1292)
Includes bibliographical references and index.
1. Organic water pollutants United States. 2. Organic compounds. 3. Water quality manage-
ment United States. 4. Water chemistry United States. I. Zogorski, John S. II. U.S. Geological
Survey circular ; 1292.
TD427.O7Q83 2006
363.738’420973 dc22
2005031595
ISBN 1-411-30836-0
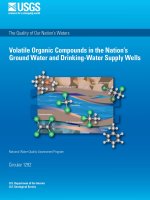
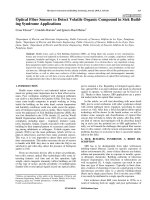
Estimated use of ground water for drinking water (adapted from data source
(1)
)
Ground water is among the Nation’s most important natural resources.
Very large volumes of ground water are pumped each day for industrial,
agricultural, and commercial use. Also, ground water is a drinking-water
source for about one-half of the Nation’s population, including almost all
residents in rural areas. Ground water is important as a drinking-water
supply in every State.
Information on the quality and quantity of ground water is important
because of the Nation’s increasing population and dependency on this
resource. Although the population that used domestic wells for drinking-
water supplies decreased between 1950 and 2000, estimated withdrawal
increased by about 70 percent during that time period. The population
dependent on public water systems that used ground water for drinking-
water supplies increased between 1950 and 2000, and the estimated
withdrawal increased about five-fold during that time period.
The quality and availability of ground water will continue to be an
important environmental issue for the Nation’s citizens. Long-term
conservation, prudent development, and management of this natural
resource are critical for preserving and protecting this priceless national
asset. Continued research by scientists, guidance and regulation by
governmental agencies, and pollution abatement programs by industry
are necessary to preserve the Nation’s ground-water quality and quantity
for future generations.
Donna N. Myers
Chief, National Water-Quality Assessment (NAWQA) Program
U.S. Geological Survey
!LASKA
(AWAII
%80,!.!4)/.
%STIMATEDPERCENTOFPOPULATIONUSING
GROUNDWATERASDRINKINGWATER
TOPERCENT
TOPERCENT
TOPERCENT
TOPERCENT
Foreword
The U.S. Geological Survey (USGS) is committed to serving the Nation with accurate and timely
scientific information that helps enhance and protect the overall quality of life, and facilitates
effective management of water, biological, energy, and mineral resources (s.
gov/). Information on the quality of the Nation’s water resources is of critical interest to the
USGS because it is so integrally linked to the long-term availability of water that is clean and
safe for drinking and recreation and that is suitable for industry, irrigation, and habitat for fish
and wildlife. Escalating population growth and increasing demands for the multiple water uses
make water availability, now measured in terms of quantity and quality, even more critical to the
long-term sustainability of our communities and ecosystems.
The USGS implemented the National Water-Quality Assessment (NAWQA) Program (http://
water.usgs.gov/nawqa/) to support national, regional, and local information needs and deci-
sions related to water-quality management and policy. Shaped by and coordinated with ongoing
efforts of other Federal, State, and local agencies, the NAWQA Program is designed to answer:
What is the condition of our Nation’s streams and ground water? How are the conditions chang-
ing over time? How do natural features and human activities affect the quality of streams and
ground water, and where are those effects most pronounced? By combining information on
water chemistry, physical characteristics, stream habitat, and aquatic life, the NAWQA Program
aims to provide science-based insights for current and emerging water issues and priorities.
NAWQA results can contribute to informed decisions that result in practical and effective water-
resource management and strategies that protect and restore water quality.
Since 1991, the NAWQA Program has implemented interdisciplinary assessments in more than
50 of the Nation’s most important river basins and aquifers, referred to as Study Units (http://
water.usgs.gov/nawqa/nawqamap.html)
1
. Collectively, these Study Units account for more
than 60 percent of the overall water use and population served by public water supply, and are
representative of the Nation’s major hydrologic landscapes, priority ecological resources, and
agricultural, urban, and natural sources of contamination.
Each assessment is guided by a nationally consistent study design and methods of sampling
and analysis. The assessments thereby build local knowledge about water-quality issues and
trends in a particular stream or aquifer while providing an understanding of how and why water
quality varies regionally and nationally. The consistent, multi-scale approach helps to determine
if certain types of water-quality issues are isolated or pervasive, and allows direct comparisons
of how human activities and natural processes affect water quality and ecological health in the
Nation’s diverse geographic and environmental settings. Comprehensive national assessments
on pesticides, nutrients, volatile organic compounds, trace elements, and aquatic ecology are
developed through national data analysis and comparative analysis of the Study-Unit findings
( />The USGS places high value on the communication and dissemination of credible, timely, and
relevant science so that the most recent and available knowledge about water resources can be
NAWQA
National Water-Quality Assessment Program
applied in management and policy decisions. We hope this NAWQA publication will provide you
the needed insights and information to meet your needs, and thereby foster increased aware-
ness and involvement in the protection and restoration of our Nation’s waters.
The NAWQA Program recognizes that a national assessment by a single program cannot
address all water-resource issues of interest. External coordination at all levels is critical for a
fully integrated understanding of watersheds and for cost-effective management, regulation,
and conservation of our Nation’s water resources. The Program, therefore, depends exten-
sively on the advice, cooperation, and information from other Federal, State, interstate, Tribal,
and local agencies, non-government organizations, industry, academia, and other stakeholder
groups. The assistance and suggestions of all are greatly appreciated.
Robert M. Hirsch
Associate Director for Water
1
Summaries of water-quality studies for the 51 Study Units
assessed in the first decade of the NAWQA Program, as well as
Study Units scheduled for assessments in the Program’s second
decade, are available at />2
The name of each Study Unit and other areas are given in
Appendix 1.
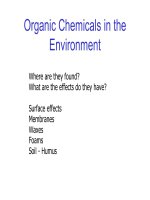
Study Units where the NAWQA Program has completed an occurrence study
of volatile organic compounds in aquifers.
2
Alaska
Hawaii
HPGW
YELL
GAFL
MISE
UMIS
RIOG
OZRK
MOBL
USNK
REDN
CAZB
SANJ
SCTX
NROK
CNBR
ALBE
SPLT
SACR
LERI
ACAD
SANT
NECB
TRIN
UTEN
LIRB
EIWA
LTEN
ACFB
SOFL
WMIC
ALMN
UCOL
CONN
GRSL
WILL
CCPT
HDSN
PUGT
UIRB
DELR
KANA
LSUS
MIAM
NVBR
LINJ
DLMV
SANA
COOK
OAHU
OKLA
EXPLANATION
National Water-Quality Assessment Program
Study Units
High Plains Regional Ground Water Study
This report is one of a series of publications, The Quality of Our Nation’s Waters, that describe
major findings of the National Water-Quality Assessment (NAWQA) Program on water-quality
issues of national and regional concern. This report is on volatile organic compounds (VOCs) in
ground water and drinking-water supply wells. It is a synthesis of NAWQA and other investi-
gations. Fifty-five VOCs are emphasized in NAWQA’s field studies, and these compounds are
the focus of this report. During NAWQA’s first decade of Study-Unit investigations, samples
from more than 2,500 wells were analyzed for VOCs. In addition, carefully selected VOC data
from more than 1,700 well samples were compiled from other agencies or collected in other
USGS studies. Collectively, these VOC analyses are the basis for this report’s assessment,
which is (1) the first national assessment of a large number of VOCs in the Nation’s aquifers
and (2) the most recent national characterization of VOCs in samples from domestic and public
wells used for drinking water.
Subsequent reports in this series will cover other water-quality constituents of concern, such
as pesticides, nutrients, trace elements, as well as physical and chemical effects on aquatic
ecosystems. Each report will build toward a more comprehensive understanding of national
and regional water resources as additional investigations are completed and as scientific
models and tools that link water-quality conditions, dominant sources, and environmental
characteristics are developed.
The information in this report is intended primarily for scientists and engineers interested or
involved in resource management, conservation, regulation, and policy making at national,
regional, and State levels. In addition, the information in this report is intended for public
health agencies and water utilities who wish to know more about specific contaminant groups
such as VOCs.
P. Patrick Leahy, Acting Director
U.S. Geological Survey
Introduction to this report and the NAWQA series
The Quality of Our Nation’s Waters
Pesticides
Nutrients
Trace Elements
VOCs
Ecology
Photograph by Charles G. Crawford,
U.S. Geological Survey
Photograph by Janet M. Carter,
U.S. Geological Survey
Photograph by Stephen R. Moulton II,
U.S. Geological Survey
Photograph courtesy of South Dakota
Department of Environment and
Natural Resources
Photograph by Janet M. Carter,
U.S. Geological Survey
Contents
The first chapter provides an overview of major findings and conclusions for ground-
water management, monitoring, and policies. The second chapter describes the
assessment’s purpose, scope, and approach. More detailed findings for ground water
are given in the third chapter, and findings for samples from drinking-water supply
wells are presented in the fourth chapter. Additional information for some frequently
and widely detected compounds is presented in the fifth chapter.
1 Major findings and conclusions 2
2 Introduction 8
3 VOCs in ground water 16
4 VOCs in samples from drinking-water supply wells 28
5 Additional information for selected VOCs 42
– Chloroform and other trihalomethanes
– Chlorinated solvents—methylene chloride, perchlorethene, 1,1,1-trichloroethane,
and trichloroethene
– Methyl tert-butyl ether and other gasoline oxygenates
– Gasoline hydrocarbons
References 56
Glossary 62
Appendixes 66
A list of acronyms is included as Appendix 2.
A glossary of common terms used in this report
is included on p. 62–65. Beginning in Chapter 2,
glossary terms are presented in boldface type
when first used in the text.
2
Chapter 1—Major Findings and Conclusions
T
his national assessment of 55 volatile organic com-
pounds (VOCs) in ground water gives emphasis to the
occurrence of VOCs in aquifers that are used as an impor-
tant supply of drinking water. In contrast to the monitoring
of VOC contamination of ground water at point-source
release sites, such as landfills and leaking underground
storage tanks (LUSTs), our investigations of aquifers are
designed as large-scale resource assessments that provide
a general characterization of water-quality conditions.
Nearly all of the aquifers included in this assessment have
been identified as regionally extensive aquifers or aquifer
systems.
(2)
The assessment of ground water (Chapter 3)
included analyses of about 3,500 water samples collected
during 1985–2001 from various types of wells, represent-
ing almost 100 different aquifer studies. This is the first
national assessment of the occurrence of a large number of
VOCs with different uses, and the assessment addresses
key questions about VOCs in aquifers. The assessment also
provides a foundation for subsequent decadal assessments
of the U.S. Geological Survey (USGS) National Water-
Quality Assessment (NAWQA) Program to ascertain long-
term trends of VOC occurrence in these aquifers.
The occurrence of VOCs in samples collected from
drinking-water supply wells, specifically domestic and
public wells, also is included (and discussed separately from
aquifer studies) in this assessment (Chapter 4), recognizing
that various agencies, organizations, decision makers, and
others have different interests and information needs.
Occurrence findings are compared between domestic and
public wells to distinguish the separate issues for these
well types related to supply, environmental setting, and
sources of VOCs. For this purpose, the occurrence of 55
VOCs is based on analyses of samples collected at the well
head, and before any treatment or blending, from about
2,400 domestic wells and about 1,100 public wells. Findings
from domestic well samples update earlier USGS studies
and provide improved national coverage of sampled wells.
As such, this assessment provides important information
on VOC occurrence for domestic well samples that may be
useful to public health agencies. Findings for public well
samples constitute the most current understanding of the
occurrence of a large number of VOCs in untreated ground
water used by public water systems (PWSs) across the
Nation. Our assessment of public well water complements
compliance monitoring by water utilities that typically focus
on drinking water delivered to the public.
Major findings that may be most relevant to the man-
agement and monitoring of the Nation’s ground water and
drinking-water supply wells are emphasized in the following
discussion. Additional information is included in subsequent
chapters of this report and at a supporting Web site (http://
water.usgs.gov/nawqa/vocs/national_assessment).
Some household products contain VOCs or
chemicals that form VOCs when added to
water. (Photograph courtesy of Joel Beamer,
professional photographer.)
3
Chapter 1
VOCs were detected in many aquifers across the Nation. Almost 20 per-
cent of the water samples from aquifers contained one or more of the 55
VOCs, at an assessment level of 0.2 microgram per liter (µg/L). This detec-
tion frequency increased to slightly more than 50 percent for the subset
of samples analyzed with a low-level analytical method and for which an
order-of-magnitude lower assessment level (0.02 µg/L) was applied. VOCs
were detected in 90 of 98 aquifer studies completed across the Nation, with
most of the largest detection frequencies in California, Nevada, Florida,
and the New England and Mid-Atlantic States. Trihalomethanes (THMs),
which may originate as chlorination by-products, and solvents were the most
frequently detected VOC groups. Furthermore, detections of THMs and
solvents and some individual compounds were geographically widespread;
however, a few compounds, such as methyl tert-butyl ether (MTBE), eth-
ylene dibromide (EDB), and dibromochloropropane (DBCP), had regional
or local occurrence patterns.
The widespread occurrence of VOCs indicates
the ubiquitous nature of VOC sources and the vulnerability of many of the
Nation’s aquifers to low-level VOC contamination. The findings for VOCs
indicate that other compounds with widespread sources and similar behavior
and fate properties also may be occurring.
(See p. 16, 18, 20, and 21.)
CONCLUSIONS
Many of the Nation’s aquifers are vulner-
able to low-level VOC contamination, indi-
cating the need to include VOCs in ground-
water monitoring programs to track the
trend of the low-level VOC contamination
identified in this assessment.
It is important to continue to control
sources of VOCs, as well as to enhance
information about the location, composi-
•
•
Many VOCs were detected, but typically at low concentrations. In water
samples from aquifers, the concentrations of each VOC and the total con-
centration of all VOCs analyzed generally were low (defined in this report as
concentrations less than 1 µg/L). For example, 90 percent of the total VOC
concentrations in samples were less than 1 µg/L. Forty-two of the 55 VOCs
were detected in one or more samples at an assessment level of 0.2 µg/L.
Furthermore, VOCs in each of the seven VOC groups considered in this
assessment were detected in the samples; these groups included fumigants,
gasoline hydrocarbons, gasoline oxygenates, organic synthesis compounds,
refrigerants, solvents, and THMs. The finding that most VOC concentrations
in ground water are less than 1 µg/L is important because many previous
monitoring programs did not use low-level analytical methods and therefore
would not have detected such contamination. (See p. 16, 17, 23, and Appen-
dixes 6 and 7.)
CONCLUSION
VOC contamination in aquifers may be
more prevalent than previously reported in
•
Photograph by Barbara L. Rowe, U.S. Geological Survey
4
Some VOCs were detected more frequently than others. Although 42 VOCs
were detected in aquifer samples, only 15 occurred in about 1 percent or
more of the samples. The most frequently detected VOCs include 7 solvents,
4 THMs, 2 refrigerants, 1 gasoline oxygenate, and 1 gasoline hydrocarbon.
The THM chloroform was the most
frequently detected compound, and
its source is attributed, in part, to the
recycling of chlorinated waters to
aquifers. The solvent perchloro-
ethene (PCE) and the gasoline
oxygenate MTBE were the second
and third most frequently detected
compounds, respectively. Overall,
the 15 most frequently detected
compounds comprise a large frac-
tion of the low-level VOC contami-
nation and provide a logical focus
for future monitoring of aquifers
and for follow-up studies to better
understand their sources and path-
ways to aquifers. (See p. 22 and
Appendix 6.)
CONCLUSIONS
Future studies to understand how VOC
contamination of aquifers is occurring
can focus on relatively few compounds.
Additional source control and/or
remediation measures, if deemed war-
ranted, also can focus on relatively few
compounds, yet would address much of
the low-level VOC contamination evident
in this assessment.
•
•
Explaining VOC contamination in aquifers is complex—VOC occurrence is
determined not only by sources but also by natural and anthropogenic fac-
tors that affect the transport and fate of VOCs in aquifers. The complexity of
explaining VOC contamination in aquifers was affirmed in this assessment
through statistical models for 10 frequently detected compounds. Factors
describing the source, transport, and fate of VOCs were all important in
explaining the national occurrence of these VOCs. For example, the occur-
rence of PCE was statistically associated with the percentage of urban land
use and density of septic systems near sampled wells (source factors), depth
to top of well screen (transport factor), and presence of dissolved oxygen
(fate factor). National-scale statistical analyses provide important insights
about the factors that are strongly
associated with the detection of
specific VOCs, and this informa-
tion may benefit many local aquifer
investigations in selecting com-
pound- and aquifer-specific infor-
mation to be considered. Contin-
ued efforts to reduce or eliminate
low-level VOC contamination
will require enhanced knowledge
of sources of contamination and
aquifer characteristics. (See p. 24
and 25.)
CONCLUSIONS
The natural and anthropogenic factors
important to VOC occurrence in a par-
ticular aquifer need to be understood in
order to effectively manage and protect
aquifers that are susceptible to VOC
contamination.
A careful review of the importance
and feasibility of further reducing or
eliminating VOC sources to aquifers also
is needed to manage and protect these
aquifers.
•
•
VOCs found in about 1 percent or more of aquifer
samples, at an assessment level of 0.2 µg/L (com-
pounds listed by decreasing detection frequency)
Compound name VOC group
Chloroform trihalomethane
Perchloroethene solvent
Methyl tert-butyl ether
gasoline oxygenate
Trichloroethene solvent
Toluene gasoline hydrocarbon
Dichlorodifluoromethane refrigerant
1,1,1-Trichloroethane solvent
Chloromethane solvent
Bromodichloromethane trihalomethane
Trichlorofluoromethane refrigerant
Bromoform trihalomethane
Dibromochloromethane trihalomethane
trans-1,2-Dichloroethene
solvent
Methylene chloride solvent
1,1-Dichloroethane solvent
Factors most commonly associated with VOCs
in aquifers
Septic systems•
Urban land•
Resource Conservation and Recovery Act
(RCRA) hazardous-waste facilities
•
Gasoline storage and release sites•
Climatic conditions•
Hydric (anoxic) soils•
Dissolved oxygen in ground water•
Type of well•
Depth to top of well screen•
5
Chapter 1
Despite the short period of its extensive use, MTBE was one of the most
frequently detected VOCs. As noted previously, MTBE was the third most
frequently detected VOC in aquifers. MTBE production peaked in the 1990s
with the majority of it used voluntarily by refineries for the Nation’s Refor-
mulated Gasoline (RFG) Program. Concentrations of MTBE in aquifer
samples were rarely of concern relative to the U.S. Environmental Protection
Agency’s (USEPA) drinking-water advisory based on taste and odor; how-
ever, MTBE concentrations in ground water were detected more frequently
in RFG Program areas than in other areas. The relatively frequent detection
of MTBE in aquifers was not an anticipated outcome at the commencement
of NAWQA’s assessment because of MTBE’s short and recent use. A period
of only a decade or less was required for the detection of MTBE in some
of the Nation’s aquifers. MTBE findings demonstrate how quickly some
anthropogenic chemicals, especially those that are mobile and persistent like
MTBE, may reach aquifers that are especially susceptible to land-surface or
atmospheric contamination. (See p. 22, 50–53.)
CONCLUSIONS
Some VOCs that are mobile and persistent
may reach especially susceptible aquifers
within a decade or less of extensive use,
and potentially adversely affect ground-
water quality.
The environmental behavior and fate prop-
erties of anthropogenic compounds should
be included in decision-making processes
•
•
Some VOCs were not detected in aquifer samples. Thirteen of the VOCs
included in this national assessment were not detected in any aquifer sam-
ples at a concentration of 0.2 µg/L or larger. The 13 compounds include 5
VOCs predominantly used in organic synthesis, 4 solvents, 2 fumigants,
1 gasoline hydrocarbon, and 1 gasoline oxygenate. The specific reason(s)
why each of these compounds was not detected has not been ascertained;
however, their lack of occur-
rence likely is attributed to
one or more of the follow-
ing factors: (1) limited use
in industry, commerce,
and household products;
(2) small releases to water
and land; (3) most use
occurs in controlled indus-
trial processes or in organic
synthesis; (4) the compound
degrades quickly to other
compounds in the environ-
ment; and (5) insufficient
time has elapsed to allow
the compound to reach wells
sampled in this assessment.
(See Appendix 6.)
VOCs not detected in aquifer samples, at an assessment
level of 0.2 µg/L (compounds listed by VOC group)
Compound name VOC group
Acrolein organic synthesis compound
Acrylonitrile organic synthesis compound
Hexachlorobutadiene organic synthesis compound
1,2,3-Trichlorobenzene organic synthesis compound
Vinyl bromide organic synthesis compound
1,3-Dichlorobenzene solvent
Hexachloroethane solvent
1,2,4-Trichlorobenzene solvent
1,1,2-Trichloroethane solvent
cis-Dichloropropene
fumigant
trans-Dichloropropene
fumigant
Styrene gasoline hydrocarbon
Ethyl tert-butyl ether
gasoline oxygenate
CONCLUSION
Some of these VOCs may not war-
rant continued inclusion in large-scale
resource assessments, such as aquifer
studies completed in the NAWQA
Program, if it is confirmed that their use,
release, and behavior and fate character-
istics pose a small or negligible likelihood
of ground-water contamination.
•
Photograph by Janet M. Carter, U.S. Geological Survey
6
Although VOCs were detected frequently in samples from domestic and
public wells, only a small percentage of samples had VOC concentrations
of potential human-health concern. One or more VOCs were detected in
about 14 and 26 percent of domestic and public well samples, respectively,
at an assessment level of 0.2 µg/L. However, only about 1 to 2 percent of
domestic and public well samples had concentrations of potential human-
health concern (defined in this report as concentrations greater than a
USEPA Maximum Contaminant Level (MCL) or concentrations greater than
a Health-Based Screening Level (HBSL) for compounds without an MCL).
Eight compounds were detected at concentrations of potential concern, and
three of these compounds occurred in both domestic and public well sam-
ples. Most of the concentrations of potential concern were attributed to the
fumigant DBCP (in domestic well samples only) and the solvents PCE and
trichloroethene (TCE) in
samples from both well
types. Because NAWQA’s
assessment is based on
samples collected at the
wellhead, it is unknown if
those domestic and public
well samples with con-
centrations of potential
concern actually result
in concentrations greater
than MCLs in drinking
water. (See p. 30–35.)
VOCs found at concentration(s) of potential human-health concern
(compounds listed by decreasing number of concentrations of
potential concern).
Compound name VOC group
Domestic
wells
Public
wells
Trichloroethene solvent X X
Dibromochloropropane fumigant X
Perchloroethene solvent X X
1,1-Dichloroethene
organic synthesis
compound
X X
1,2-Dichloropropane fumigant X
Ethylene dibromide fumigant X
Methylene chloride solvent X
Vinyl chloride
organic synthesis
compound
X
CONCLUSIONS
Most samples from domestic and public
wells had VOC concentrations less than
MCLs and HBSLs, indicating that these
concentrations are not anticipated to cause
adverse human-health effects.
Some samples had VOC concentrations
greater than MCLs, indicating possible
adverse human-health effects if drinking
water with these concentrations was
consumed over a lifetime. However, there
are uncertainties about actual drinking-
water exposure and health effects of water
from these supply wells. Further study of
these wells is warranted to understand
contaminant sources and VOC concentra-
tions in drinking water.
•
•
Additional VOCs may warrant inclusion in a low-concentration, trends-
monitoring program. Nine VOCs that did not occur at concentrations of
potential concern in samples from domestic and/or public wells were
detected at concentrations below but within a factor of 10 of an MCL. The
9 compounds include 4 solvents, 4 THMs, and 1 gasoline hydrocarbon.
These 9 VOCs, plus the 8 compounds with concentrations of potential con-
cern, are important compounds to consider including in a low-concentration,
trends-monitoring program, such as the NAWQA Program. Such programs
seek to identify compounds in
domestic and public well samples
before concentrations reach levels
of potential concern. Also note-
worthy is the finding that the sol-
vents PCE and TCE had, relative
to other VOCs, a large number of
concentrations in both domestic
and public well samples below
but within a factor of 10 of their
MCLs. (See p. 32, 34, and Appen-
dixes 9 and 11.)
CONCLUSIONS
Comparing concentrations to MCLs and
HBSLs helps prioritize which compounds
merit further study or monitoring. This
assessment identified 17 VOCs that may
warrant consideration for inclusion in a
low-concentration, trends-monitoring
program for domestic and public wells.
NAWQA’s occurrence information for these
17 compounds is important information
considered in the USEPA’s Contaminant
Candidate List (CCL) Program.
Because of the relatively large number of
concentrations near and greater than their
MCLs, the solvents PCE and TCE appear to
warrant special emphasis to understand
their sources and their capture by both
domestic and public wells.
•
•
•
Additional VOCs that may warrant inclusion in a
low-concentration, trends-monitoring program
(compounds listed by VOC group)
Compound name VOC group
Benzene gasoline hydrocarbon
Carbon tetrachloride solvent
1,2-Dichloroethane solvent
cis-1,2-Dichloroethene
solvent
1,1,1-Trichloroethane solvent
Bromodichloromethane trihalomethane
Bromoform trihalomethane
Chloroform trihalomethane
Dibromochloromethane trihalomethane
7
Chapter 1
In general, public wells are more vulnerable to low-level VOC contamina-
tion than are domestic wells. The detection frequencies of nearly all of the
most frequently detected compounds and mixtures of VOCs were larger
in samples from public wells than from domestic wells, at an assessment
level of 0.2 µg/L. Mixtures of 2 or more of the 55 VOCs were found in
about 13 percent of the public well samples—more than three times more
frequently than in domestic well samples—and the likelihood of detecting a
mixture of VOCs in public well samples was about the same as detecting a
single compound. Furthermore, 10 of the 15 most frequently detected VOCs
in public well samples were either THMs or solvents, and all but one of the
most common VOC mixtures included THMs. The larger detection frequen-
cies in public well samples than in domestic well samples is attributed, in
part, to the larger withdrawal rates of public wells and their proximity to
developed areas. The larger pumping rates may increase the capture and
movement of VOC contamination to public wells. The proximity of public
wells to developed areas increases the likelihood of VOC sources. (See
p. 36–41.)
CONCLUSIONS
The frequent detection of VOCs in public
well samples reinforces the critical impor-
tance of effective well-head protection
programs for public wells and the need to
further identify and control sources of VOC
contamination in these programs.
Toxicity testing of VOCs historically has
focused on individual compounds, typi-
cally without consideration of compound
mixtures. NAWQA studies contribute to
toxicity studies for VOCs by identifying
the most commonly occurring chemical
mixtures in samples from drinking-water
supply wells.
•
•
Water that has been chlorinated or exposed to household products con-
taining chlorine is an important source of chloroform and possibly other
compounds in ground water supplying domestic and public wells. Chloro-
form was the most frequently detected VOC in domestic and public well
samples. The chloroform detected in ground water may have potential
sources associated with its use as a solvent and an extractant, and as an
intermediate product in organic synthesis. Also, chloroform and other THMs
are by-products of the chlorination of drinking waters and wastewaters,
and the disinfection of domestic and public wells. These compounds also
may be present in the effluent of septic systems from the use of household
products containing chlorine, such as bleach. Furthermore, artificial recharge
of chlorinated water containing THMs and potentially other compounds is
becoming more common, especially in western States due to, in part, the
limited supply of drinking water. The chlorination of water to control water-
borne diseases has been a common practice in the United States for nearly
a century. This long-term use has allowed ample time for the recharge of
waters containing THMs to reach many of the sampled wells. Once intro-
duced to ground water, chloroform and other THMs may persist and move
long distances in some aquifers. The relative detection frequencies of the
THMs in well samples, and the common occurrence of mixtures of THMs in
public well samples, indicate that waters with a history of chlorination and
that contain these compounds have reached some of the sampled wells. (See
p. 42–45.)
CONCLUSIONS
The occurrence of THMs in samples from
drinking-water supply wells, especially
public wells, is attributed to anthropo-
genic sources, including most notably the
capture of recycled water with a history of
chlorination.
The practice of artificial recharge of
chlorinated waters to aquifers may require
additional evaluation to understand the
concentrations and potential concerns of
THMs and other chlorination by-products,
especially for those aquifers used for
drinking-water supply.
•
•
Photograph by Michael R. Rosen, U.S. Geological Survey
8
1. What are VOCs?
VOCs are a subset of organic compounds with
inherent physical and chemical properties
that allow these compounds to move between
water and air. This behavior is the fundamen-
tal basis for the USGS’s laboratory analysis of
VOCs in water samples, in which compounds
that are sufficiently volatile are purged from a
water sample by an inert gas and then identi-
fied and quantified by gas chromatography/
mass spectrometry (GC/MS). In general, VOCs
have high vapor pressures, low-to-medium
water solubilities, and low molecular weights.
Some VOCs may occur naturally in the environ-
ment, other compounds occur only as a result
of manmade activities, and some compounds
have both origins.
Chapter 2—Introduction
Background and National Significance
The presence of elevated concentrations of VOCs in
drinking water may be a concern to human health.
V
olatile organic compounds (VOCs) are ground-water contaminants
of concern because of very large environmental releases, human
toxicity, and a tendency for some compounds to persist in and migrate with
ground water to drinking-water supply wells (sidebar 1). Some VOCs,
such as chlorinated solvents, have been used in commerce and industry for
almost 100 years,
(3)
and chloroform and other trihalomethanes (THMs)
have undoubtedly been present in chlorinated drinking water since the first
continuous municipal application of chlorination in 1908.
(4)
The production
and use of manmade organic compounds, many of which are classified as
VOCs, increased by an order of magnitude between 1945 and 1985.
(5)
Some
VOCs have had, and continue to have, very large and ubiquitous usage. An
example is the widespread use of gasoline, which contains many VOCs.
Furthermore, VOCs have had numerous uses in industry, commerce, house-
holds, and military sites (sidebar 2).
The large-scale use of solutions of VOCs and products containing some
VOCs has resulted in considerable quantities of VOCs released to the envi-
ronment. Historically, many waste chemicals were disposed of indiscrimi-
nately. Because of this practice, VOCs often are the most frequently detected
contaminants in soil and ground water at abandoned landfills and dumps,
and at many industrial, commercial, and military sites across the Nation.
Federal regulation of VOCs commenced in the 1970s with the passage of
the Clean Air Act, Clean Water Act, Safe Drinking Water Act (SDWA),
Resource Conservation and Recovery Act (RCRA), and other environmental
acts. Collectively, much has been done in the past 30-plus years to mitigate
pollution. Especially noteworthy examples for mitigating VOC ground-water
contamination are (1) improved designs, operations, and disposal practices
for the use of chlorinated solvents at industrial, commercial, and military
sites; and (2) the cleanup of commercial gasoline release sites and the imple-
mentation of measures to minimize gasoline releases in the future. Despite
these exemplary accomplishments, environmental releases of some VOCs
from manufacturing facilities in the United States remain high. In 2001,
for example, 4 of the 20 chemicals with the largest total on-site and off-site
releases to the environment were VOCs, with a cumulative estimated release
of more than 200 million pounds.
(6)
9
Chapter 2
2. How are VOCs Used?
VOCs have been used extensively in the
United States since the 1940s. VOCs are
common components or additives in many
commercial and household products including
gasoline, diesel fuel, other petroleum-based
products, carpets, paints, varnishes, glues,
spot removers, and cleaners. Example indus-
trial applications include the manufacturing
of automobiles, electronics, computers, wood
products, adhesives, dyes, rubber products,
and plastics, as well as in the synthesis of
other organic compounds. VOCs also are used
in the dry cleaning of clothing, in refrigeration
units, and in the degreasing of equipment
and home septic systems. VOCs are present
in some personal care products such as
perfumes, deodorants, insect repellents, skin
lotions, and pharmaceuticals. Some VOCs also
have been applied as fumigants in agriculture
and in households to control insects, worms,
and other pests.
The detection of VOCs in ground water is a concern to
officials involved in the management of aquifers because
such an occurrence implies aquifer vulnerability.
The detection of VOCs in aquifers is important because of the wide-
spread, large, and increasing use of ground water for drinking water. In
2000, about 50 percent of the Nation’s population obtained their supply of
drinking water from ground water (p. 28 and 29).
The presence of elevated VOC concentrations in drinking water may
be a concern to human health because of their potential carcinogenicity. In
addition to cancer risk, VOCs may adversely affect the liver, kidney, spleen,
stomach, and heart, as well as the nervous, circulatory, reproductive, and
respiratory systems. Some VOCs may affect cognitive abilities, balance,
or coordination, and some are eye, skin, and/or throat irritants. Because of
known or suspected human-health concerns, the USEPA has established
Maximum Contaminant Levels (MCLs) that apply to 29 VOCs in drinking
water supplied by public water systems (PWSs). In addition, some States
have set MCLs for additional VOCs and in some cases have established
more stringent standards than the USEPA values. The human-health conse-
quences of low-concentration exposure of VOCs in drinking water (that is, at
concentrations less than MCLs) are uncertain.
In addition to human-health concerns, scientists and engineers involved
in the management of aquifers and water-supply development are concerned
about the detection of VOCs in ground water because such an occurrence
implies aquifer vulnerability. Identifying additional source-control strate-
gies or enhancing existing measures may be warranted if anthropogenic
compounds are detected frequently in ground water. The detection of a
VOC in ground water also may be of concern because it denotes that a path-
way exists by which other persistent and potentially toxic compounds may
reach drinking-water supply wells.
Products containing VOCs have
many uses in commerce and
households. (Photographs by:
left, Connie J. Ross; middle,
Janet M. Carter; right, Rika
Lashley, U.S. Geological Survey.)
!
U
T
O
M
O
T
I
V
E
P
A
I
N
T
I
N
G
3
M
A
L
L
E
N
G
I
N
E
F
U
E
L
0
A
I
N
T
S
T
R
I
P
P
I
N
G
10
V
OCs were selected for emphasis in the USGS’s NAWQA Program
primarily because of the previously reported occurrence of some of
these compounds in many of the Nation’s water supplies.
(3, 7, 8, 9, 10)
The over-
all intent of the Program’s VOC assessment is to provide an improved under-
standing of the occurrence and geographical distribution of selected VOCs
in the Nation’s water resources, with emphasis on ground water. The assess-
ment includes both new VOC data collected in the Program’s Study-Unit
investigations and VOC data from previous studies with a similar design.
Previous findings from the Program’s assessment of VOCs were
reported initially in 1999 with emphasis on (1) the occurrence of VOCs in
samples from wells in urban and rural areas; and (2) the probability of
detecting one or more VOCs in ground water on the basis of population
density.
(11)
Subsequently, the Program’s scientists have reported national-
scale occurrence findings for (1) mixtures of VOCs, pesticides, and nitrate in
samples from domestic and public wells;
(12)
(2) VOCs in the water supply of
selected community water systems (CWSs);
(13, 14)
(3) MTBE and gasoline
hydrocarbons in ground water;
(15)
and (4) VOCs in domestic well sam-
ples
(16)
and in shallow, urban ground water.
(17)
This report presents additional salient findings of the national VOC
assessment and gives emphasis to the occurrence of VOCs in the Nation’s
ground water (sidebar 3) and in samples from drinking-water supply wells
(sidebar 4). This includes information about the detection frequency, con-
centration, geographical distribution, and mixtures of VOCs. Also described
are natural and anthropogenic factors that were found to be associated with
the occurrence of some of the frequently detected VOCs. Additionally, this
report presents information and more in-depth findings for selected VOCs
including (1) chloroform and other THMs; (2) chlorinated solvents—methy-
lene chloride, PCE, 1,1,1-trichloroethane (TCA), and TCE; (3) MTBE and
other gasoline oxygenates; and (4) gasoline hydrocarbons.
Information on the occurrence of VOCs is presented separately in this
report for ground water (Chapter 3) and drinking-water supply wells, specifi-
cally domestic and public wells (Chapter 4). It is recognized that various
agencies, organizations, researchers, resource managers, decision makers,
and the public have different interests and information needs regarding the
use and management of ground-water resources and the protection and over-
sight of drinking-water supplies. NAWQA aquifer studies are large-scale
resource assessments of ground water that provide a general characterization
This Assessment’s Purpose and Scope
The overall intent of the NAWQA Program’s VOC
assessment is to provide an improved understanding
of the occurrence and distribution of selected VOCs
in the Nation’s water resources.
3. Assessing the Quality of Ground
Water
Ground water is an important supply of drink-
ing water in the United States, and the study
of aquifers is a large component of NAWQA’s
ground-water assessments. Aquifer studies
have been completed in nearly every NAWQA
Study Unit and have provided a comprehen-
sive picture of the chemical quality of water
in locally and regionally important aquifers.
More information on specific aquifer studies is
available on the Circular’s Web site.
Many pesticides, VOCs, nutrients, and
naturally occurring chemicals are monitored
in aquifer studies. Typically the aquifer (or
portion thereof) selected for study is locally
one of the most intensively used aquifers for
drinking water. Aquifer studies are designed
to provide an overall picture of the aquifer’s
water-quality condition and, as such, are con-
sidered resource assessments. To achieve this
spatially large aquifer characterization, wells
selected for sampling are randomly located but
distributed approximately equally across the
study area. A variety of well types with differ-
ent water uses are included in the assessment
of aquifer studies. None of the sampled wells
were selected because of prior knowledge of
nearby contamination.
11
Chapter 2
of water-quality conditions in locally important aquifers or portions thereof.
When completed in many locations, these studies collectively provide an
important national perspective on the current extent of VOC contamina-
tion and regional patterns of VOC occurrence in ground water. In addition,
aquifer studies characterize the vulnerability of ground-water systems to
VOCs, as well as to other contaminants with similar sources and environ-
mental properties. This information may be especially valuable for national
and regional decisions about the need for future ground-water protection and
associated policies and regulations.
The occurrence of VOCs in samples from domestic and public wells
is presented separately in order to distinguish the separate issues for these
well types related to supply, environmental setting, and sources of VOCs.
Samples from these wells provide information about VOC contamination
that may reach tap water unless the supply is treated to remove any VOCs or
is diluted with other water supplies. Occurrence information for individual
VOCs provides important insights about the concentrations of potential
human-health concern in drinking-water supply wells and the need for
controlling their sources of contamination. This information often is sought
by water utilities, public health agencies, the public, and rural citizens who
rely on private wells for drinking water.
A total of 55 VOCs are included in this assessment, and a sample from
each well was routinely analyzed for nearly all of these compounds. The
selection procedure for the inclusion of these VOCs in NAWQA’s routine
monitoring is described elsewhere
(18)
and included, for example, consider-
ation of the feasibility of laboratory analysis, known or suspected human-
health concerns, frequency of occurrence in water resources based on prior
investigations, and potential for large-scale use.
4. Assessing the Quality of Ground
Water Captured by Drinking-Water
Supply Wells
NAWQA’s studies of drinking-water supply
wells focus on the quality of ground water
captured by domestic and public wells, in
contrast to the quality of tap water (that is,
drinking water). USGS field personnel collect
samples of ground water from domestic and
public wells at the wellhead and before any
treatment or blending. As such, NAWQA’s
studies complement drinking-water-compli-
ance-monitoring programs required by other
agencies; these programs usually specify mon-
itoring after treatment or blending. Compari-
sons of concentrations for domestic and public
well samples to primary drinking-water
standards and Health-Based Screening
Levels (HBSLs) in this report are made only
in the context of the quality of untreated and
unblended ground water. Human exposure
from tap water and other pathways is not
quantified.
During NAWQA’s first decade of assessments,
many domestic wells and some public wells
were sampled. During its second decade,
additional emphasis has been placed on under-
standing the quality of drinking-water supplies
including the monitoring of river intakes and
production wells of large CWSs, as well as the
continued sampling of domestic wells. In addi-
tion, major factors that influence the transport
of chemicals to public wells are being studied.
Studies of drinking-water supplies are impor-
tant because these studies (1) identify the
presence and concentrations of those chemi-
cals that may reach domestic and public wells
(or surface-water intakes); and (2) provide
information on the need for enhanced source
control. Through these studies, the USGS will
continue to collaborate with other agencies,
organizations, and water utilities involved with
the supply of the Nation’s drinking water.
The primary purpose of this report is to present impor-
tant findings of the assessment of VOCs in the Nation’s
ground water and drinking-water supply wells.
Example Key Questions About VOCs That NAWQA’s Findings Address:
Which VOCs are detected most frequently in aquifers? In samples from domestic and
public wells? At what concentrations?
Which of the aquifers studied are most vulnerable to VOC contamination?
Which natural and anthropogenic factors are associated with VOC occurrence in
aquifers and samples from domestic and public wells?
Are the frequently detected VOCs found everywhere in aquifers across the Nation or are
local/regional occurrence patterns evident?
Are specific mixtures of VOCs common? Which mixtures occur most frequently?
Do domestic or public wells have more low-level VOC contamination? Why?
Which VOCs are detected at concentrations of potential human-health concern in
samples from domestic and public wells?
Which VOC occurrence findings provide insights for future ground-water protection?
•
•
•
•
•
•
•
•
12
T
his section describes some aspects of the assessment’s approach.
Additional details are presented elsewhere
(19)
and in Appendix 3. Two
primary objectives of this assessment included determination of (1) VOCs
in ambient ground water from aquifer studies; and (2) VOCs in samples
from actively used domestic and public wells. Samples from 3,498 wells
with a variety of water uses were selected for analysis of VOCs in aquifer
studies (table 1). VOC data from 2,401 domestic wells and 1,096 public
wells were available from aquifer studies, shallow ground-water studies,
and a national source-water survey (table 2) to characterize the occurrence
of VOCs in these two well types. One VOC analysis per well was included
in the assessment. Well selection criteria and maps showing the locations of
wells are presented in Appendix 3.
VOC data for domestic well samples are a large subset of data for
aquifer studies because existing wells, including many domestic wells, were
selected for sampling. Domestic wells commonly were chosen for aquifer
studies because their distribution in most areas best fit the study objective
of assessing the quality of aquifers using randomly selected and spatially
distributed sampling points for a large area.
All samples for NAWQA studies were collected and analyzed by USGS
personnel using approved USGS methods. For nearly all of the ground-water
samples analyzed by the USGS, compounds were identified and concentra-
tions were quantified using GC/MS. For data not collected or analyzed by
USGS, laboratory certification and use of GC/MS methods were required for
inclusion of data in this assessment.
This Assessment’s Approach
Samples for VOC determination are collected and
analyzed by established methods that ensure high-
quality occurrence information. (Photographs by
Barbara L. Rowe, U.S. Geological Survey.)
Table 1. Number of wells with VOC data for aquifer studies by water use.
Use of water
Aquifer studies
Number of wells Percent of wells
Domestic supply 2,138 61.1
Public supply 513 14.7
Monitoring 335 9.6
Other 461 13.2
Unknown 51 1.5
Total 3,498 100
Table 2. Number of domestic and public wells with VOC data by data source.
Data source
Domestic wells Public wells
Number
of wells
Percent
of wells
Number
of wells
Percent
of wells
Aquifer studies
1
2,138 89.0
1
513 46.8
Shallow ground-water studies 263 11.0 8 .7
National source-water survey 0 0 575 52.5
Total 2,401 100 1,096 100
1
Same wells used in aquifer studies (table 1).
13
Chapter 2
As noted previously, 55 VOCs were included in this assessment.
These VOCs were assigned to the following groups on the basis of their
primary usage (or origin): (1) fumigants, (2) gasoline hydrocarbons, (3)
gasoline oxygenates, (4) organic synthesis compounds, (5) refrigerants,
(6) solvents, and (7) THMs (chlorination by-products). Other uses and addi-
tional information for the 55 VOCs can be found in Appendix 4.
Most detection frequencies were computed by applying an assessment
level of 0.2 µg/L (sidebar 5). The assessment level of 0.2 µg/L was chosen to
represent the laboratory reporting value for USGS prior to April 1996 and to
be compatible with other agencies. For this assessment level, data from all
sampled wells were used in the computation of detection frequencies. The
number of samples with laboratory analyses varied among the 55 VOCs.
For some computations, an assessment level of 0.02 µg/L also was
applied. This assessment level was selected to represent the occurrence of
VOCs using a new, low-level analytical method developed by the USGS
for natural waters. When applying this assessment level for aquifer studies,
the samples from a subset of 1,687 wells that were analyzed using the new
method were used in the computation of detection frequencies. Data from
a subset of 1,208 wells were available for computations for domestic well
samples; however, insufficient data were available for computations for
public well samples at an assessment level of 0.02 µg/L.
A variety of ancillary data and statistical models were used to relate the
occurrence of VOCs to various hydrogeologic and anthropogenic variables.
The hydrogeologic variables that were used in the relational analyses repre-
sented the transport and fate of VOCs in ground water. The anthropogenic
variables used in the relational analyses represented some of the potential
sources of VOCs to ground water. A listing of the ancillary data used in
these analyses can be found elsewhere.
(19)
For those compounds with Federal drinking-water standards, VOC
concentrations in samples from domestic and public wells were compared to
USEPA MCLs. Concentrations for 15 unregulated compounds were com-
pared to HBSLs (p. 30), which were developed by the USGS in collabora-
tion with the USEPA, New Jersey Department of Environmental Protection,
and the Oregon Health & Science University. HBSLs are not enforceable
regulatory standards but are concentrations of contaminants in water that
warrant scrutiny because they may be of potential human-health concern.
(20)
5. What are Assessment Levels,
and Why are They Used?
The detection frequency of VOCs in ground
water is an important indicator of water
quality in occurrence assessments. In order to
compare detection frequencies for individual
VOCs, groups of VOCs, or VOC data from dif-
ferent agencies with different reporting levels,
an “assessment level” must be established.
An assessment level is a fixed concentra-
tion that is the basis for computing detection
frequencies.
An assessment level is necessary because the
detection frequency computed for a specific
VOC depends on the laboratory reporting
level for that compound.
(21)
Laboratory report-
ing levels for VOCs may vary from compound
to compound and from one laboratory to
another due to differences in laboratory
equipment, equipment sensitivity, experience
and skill of equipment operators, or laboratory
conditions. In addition, data sets collected for
different monitoring objectives or analyzed by
different laboratory methods also can have
different reporting levels. Thus, different
detection frequencies for VOC data sets with
different reporting levels may not represent
true differences in water quality, but rather
they may only reflect the above noted factors.
Various quality-control criteria were used to select
wells and VOC data for this national assessment.
14
V
OCs are used in numerous industrial, commercial, and domestic
applications and can contaminate ground water through sources such
as landfills and dumps, leaking storage tanks, septic systems, leaking water
and sewer lines, stormwater runoff, and the atmosphere. These sources
differ, however, in their potential to cause elevated concentrations of VOCs
in ground water (sidebar 6). Many household products contain VOCs and
can be discarded to septic systems or disposed of improperly. In commerce
and industry, VOCs are used in numerous applications (sidebar 2), and these
uses result in considerable quantities of VOCs being released to the environ-
ment.
(22)
Once in the environment, many VOCs move between the atmos-
phere, soil, ground water, and surface water. Although many VOCs have
relatively short half-lives in certain media because of degradation, other
VOCs such as DBCP, TCA, and MTBE can persist in ground water and
degrade only slightly over a period of years or decades.
VOCs can be transported through the unsaturated zone in recharge, in
soil vapor, or as a non-aqueous-phase liquid. Any hydrologic condition that
shortens residence time within the unsaturated zone can result in increased
amounts of VOCs to the water table; for example, manmade structures like
recharge basins and shallow injection wells can accelerate transport through
the unsaturated zone. Furthermore, a shallow water table and abundant
recharge will favor more rapid transport through the unsaturated zone and
increase the likelihood of VOCs reaching ground water. Some VOCs also
can move slowly through the unsaturated zone with air and enter the top of
the water table by partitioning between soil air and ground water; however,
this type of transport also is enhanced by the movement of recharge.
(23)
The movement of solutes by the bulk motion of flowing ground water is
known as advection. The rate of advective transport varies by many orders
of magnitude.
(24)
The tendency of solutes to spread out from the path that
would be expected from advective flow is known as dispersion. VOCs in
ground water can eventually be captured by pumping wells or discharged to
surface waters if traveltimes are short enough to prevent the complete attenu-
ation of VOCs.
The transport of VOCs dissolved in ground water also may be slowed
by sorption to organic carbon in the aquifer material. The effect of sorption
on VOC transport is dependent on the solubility of the VOC, the amount of
organic carbon in the aquifer, and aquifer density and porosity. Some very
Sources, Transport, and Fate of VOCs in Ground Water—An Overview
6. How Do Ground-Water
Concentrations from VOC Sources
Differ?
VOC contamination can originate from
the release of liquids, such as petroleum
hydrocarbons or solvents, at one location. The
release of VOCs from a LUST is an example
of such contamination and commonly results
in concentrations of VOCs in ground water
near the source at the milligram or gram per
liter level. These large concentrations are one
reason why this type of contamination can
spread over a large area.
Contamination also can originate over large
areas from sources such as leaking water and
sewer lines, stormwater runoff, and atmos-
pheric deposition. Typically, these sources
result in small concentrations (microgram per
liter or smaller) in water.
Manmade structures, such as recharge basins and
shallow injection wells, can hasten the transport of
VOCs to ground water.
A possible source of VOCs is illustrated by the
leaking barrels from a Superfund site. (Photograph
courtesy of U.S. Environmental Protection Agency.)
15
Chapter 2
soluble VOCs like MTBE have a small sorption tendency and thus move as
quickly as ground water, whereas other less soluble VOCs like carbon tetra-
chloride have a larger sorption tendency and may move slowly relative to the
rate of ground-water flow.
(25)
The fate of VOCs in ground water is largely dependent on their persis-
tence under the conditions present in the aquifer. VOCs that are persistent
in water are more likely to be detected in ground water because they can
travel greater distances from their source before degradation and dilution
occur. In ground water, VOCs may undergo selective abiotic (not involving
microorganisms) and biotic (involving microorganisms such as bacteria and
fungi) degradation. An example of abiotic degradation is the degradation
of TCA to 1,1-dichloroethene (1,1-DCE) by reaction with water. For most
VOCs, biotic degradation generally is more important than abiotic degrada-
tion. Some VOCs can be degraded biotically under a range of redox condi-
tions,
(25)
whereas others may persist in ground water until a particular redox
condition occurs. An example of biotic degradation is the degradation of
PCE to TCE.
Bacteria may be unable to use VOCs as a sole source of food when the
compounds are present at nanogram per liter or low microgram per liter
concentrations.
(26)
This may slow the degradation of VOCs in ground water.
A decline in the degradation rate with decreasing concentration may account
for the low VOC concentrations detected in this assessment for some VOCs
that degrade quickly at larger concentrations.
VOCs can be transported with precipitation to
ground water and stormwater runoff. (Bottom
photograph by Charles G. Crawford, U.S. Geological
Survey.)
Some VOCs, such as DBCP, TCA, and MTBE, can
persist in ground water with little degradation
over years or decades.
Two other possible sources of VOCs are
demonstrated by contamination originating from
automobiles and this leaking underground storage
tank. (Bottom photograph courtesy of the Utah
Department of Environmental Quality.)
16
Chapter 3—VOCs in Ground Water
Occurrence of One or More VOCs in Aquifers
7. Occurrence Information Helps
in Managing Ground-Water
Resources
The occurrence of VOCs in aquifers provides
important information to those responsible for
managing ground-water resources. Contami-
nation of aquifers by one or more VOCs also is
a national issue of potential concern because
of the widespread and long-term use of many
of these compounds.
Detecting one or more VOCs in aquifer
samples provides evidence that conditions
favor VOCs reaching the sampled wells. Con-
taminant occurrence depends on aquifer prop-
erties, the associated sources of water to the
aquifer, and stresses on the aquifer such as
pumping. Contamination also depends on the
locations and types of VOC sources, the rela-
tive locations of wells, and the transport and
fate of VOCs.
(27)
Knowledge that VOC contami-
nation is present in an aquifer provides the
rationale for assessment of the human-health
significance of the contamination, as well as
the possible need for more in-depth studies
to determine the source(s) of contamination
and remedial action if concentrations are of
potential concern. The occurrence of low-
level contamination of one or more VOCs in
an aquifer also can provide managers with an
early indication of the presence of VOCs that
eventually might adversely affect the quality
of water from domestic and public wells.
Figure 1. Total VOC
concentrations were less
than 1 microgram per liter
(µg/L) in about 90 percent
of the 867 aquifer samples
with VOC detections
analyzed using the low-
level method.
Detection of VOCs in aquifer samples
demonstrates the vulnerability of many of the
Nation’s aquifers to VOC contamination.
A
bout 19 percent of the ground-water samples from 3,498 wells in
aquifer studies (hereafter referred to as aquifer samples) contained
one or more VOCs at an assessment level of 0.2 µg/L. A larger percent
occurrence of 51 percent was evident for a subset of samples from 1,687
wells that were analyzed using the low-level analytical method, for which an
order-of-magnitude lower assessment level (0.02 µg/L) was applied.
Possible reasons why no VOCs were detected in some aquifer samples
include (1) no VOC sources were present near the sampled wells, (2) the
water sampled was recharged before VOCs were in use, (3) the water
sampled was old enough that VOCs had time to undergo degradation, (4) the
ground water sampled was a mix of water not containing VOCs with water
containing VOCs, which resulted in any VOCs present being diluted to con-
centrations below detection levels, (5) VOCs were present in the aquifer but
had not reached the wells yet, or (6) some combination of these and other
reasons. VOC occurrence or non-occurrence could vary within different
parts of an aquifer as well as among aquifers. At the local scale, additional
studies are needed to help explain reasons for VOC occurrence or non-
occurrence.
The finding that one or more VOCs were detected in about one-half of
the samples analyzed using the low-level method demonstrates the vulner-
ability of many of the Nation’s aquifers to low-level VOC contamination
,ESSTHAN±G,
PERCENT
±G,TO
LESSTHAN±G,
PERCENT
±G,TO
LESSTHAN±G,
PERCENT
±G,TO
LESSTHAN±G,
PERCENT
±G,ORGREATER
PERCENT
17
Chapter 3
8. Urban Land Use Contributes
More VOCs to Ground Water than
Do Other Land Uses
Detection frequencies of 1 or more of the 55
VOCs differ in shallow ground water partly
depending on the overlying land use—38 per-
cent in residential/commercial urban settings
and 11 percent in agricultural settings at an
assessment level of 0.2 µg/L. The residential/
commercial findings may be attributable to
one or more of several factors related to VOC
sources in the urban environment compared
to other settings. For example, the urban
setting may have more sources and releases
of VOCs than other settings. Also, recharge
of VOCs to ground water may be enhanced in
urban areas by structures such as recharge
basins and shallow injection wells. In addition,
differences in detection frequencies could be
attributable to distance traveled by VOCs and
to the transport and fate properties of the
VOCs associated with the land-use setting.
The finding that urban settings contribute
more VOCs to underlying ground water
indicates that these waters generally are
more vulnerable to VOC contamination than
ground water underlying other settings.
However, this is not always the case locally.
In Oahu, Hawaii, for example, the largest
VOC contamination occurs in the agricultural
areas of central Oahu, where fumigants have
been intensively applied but the aquifers
are unconfined, as compared to the minimal
contamination underlying urban Honolulu,
where the aquifers are somewhat protected
by a confining unit.
(28)
Figure 2. VOC contamination occurs in aquifers across the Nation, albeit over a large
range of concentrations.
Although infrequent, total VOC concentrations
of 10 µg/L or greater were found in many States
throughout the Nation.
(sidebar 7). This finding also indicates that VOCs might be detected in other
aquifers across the Nation if samples are analyzed using a low-level method.
Total concentrations of the 55 VOCs in samples provide an overall
national perspective on the extent of VOC contamination in aquifers. About
90 percent of samples analyzed using the low-level method had total VOC
concentrations less than 1 µg/L (fig. 1). Conversely, total VOC concentra-
tions of 10 µg/L or greater were found in slightly more than 1 percent of all
samples with VOC detections.
Nearly three-quarters (42 out of 55) of the VOCs in NAWQA’s assess-
ment were detected in one or more samples at a concentration of 0.2 µg/L or
greater. The number of VOCs detected, however, did vary markedly among
aquifer studies, ranging from 1 to 31 VOCs.
VOC contamination occurs in aquifers across the Nation, albeit over
a large range of concentrations (fig. 2). Total concentrations of VOCs of
10 µg/L or greater occur infrequently but in many States throughout the
Nation. Many factors, such as land use, hydrogeology of the aquifer, geo-
chemistry of the ground water, and the transport and fate properties of
VOCs, affect the occurrence of VOCs in ground water (sidebars 7 and 8, and
p. 14 and 15).
%80,!.!4)/.
4OTALCONCENTRATIONINMICROGRAMS
PERLITER
.ODETECTIONORLESSTHAN
TOLESSTHAN
TOLESSTHAN
TOLESSTHAN
ORGREATER
(AWAII
/AHU
!LASKA