Remediation of Organic Chemicals in the Vadose Zone docx
Bạn đang xem bản rút gọn của tài liệu. Xem và tải ngay bản đầy đủ của tài liệu tại đây (3.09 MB, 208 trang )
INTRODUCTION
The remediation of organic chemicals in the vadose zone has been
blessed by remarkable success, but it has also been cursed by challenges
to even our most advanced capabilities. This spectrum of outcomes to
the remedial process is a result of the diversity of conditions encoun-
tered at contaminated sites. Organic chemicals are rarely stored or inten-
tionally placed beneath the water table, so the source of most organic
contamination is at the ground surface or in the shallow vadose zone. As
a result, nearly all sites containing organic contaminants have at least
some problems in the vadose zone, and commonly the greatest concen-
trations of contaminants occur in the vadose zone near the source.
The large number of sites requiring vadose zone remediation presents
a broad range of conditions and circumstances, including factors related
to geologic conditions, properties of the contaminants, and the ability to
access the subsurface. All are critical to the performance of the remedial
technique, and currently no single technique addresses all the factors
found at contaminated sites. Instead, an array of techniques has been
developed, some to target widespread problems and others to address
the more difficult niches.
949
Remediation of
Organic Chemicals
in the Vadose Zone
7
Larry Murdoch
Contributors: J.S. Girke, J. Rossabi, J. Reed, D. Conley,
J. Phelan, R.W. Falta, W. Heath, T.C. Hazen, R.L. Siegrist,
O.R. West, M.A. Urynowicz, W.W. Slack, P. Bishop,
V. Hebatpuria, L.E. Erickson, L.C Davis, and P.A. Kulakow
The development of soil vapor extraction (SVE) in the mid-to-late
1980s provided a method that can significantly reduce the mass of
volatile compounds at sites underlain by relatively dry, sandy sediments,
in areas readily accessed by conventional drilling. A significant number
of sites meet those criteria, and SVE has been used to close many of
them. SVE is widely available and, along with several companion
techniques, it forms the backbone of our organic chemical remediation
capabilities.
A variety of conditions impede SVE performance. Organic contami-
nants may partition into the vapor phase only sparingly, or the underly-
ing material may be tight or marked by significant heterogeneities, or
the contaminated region may be beyond the influence of conventional
wells. These factors reduce the effectiveness of SVE, delaying the com-
pletion of remediation and increasing costs.
Performance improvement and cost reduction motivated the develop-
ment of at least a dozen other technologies for remediating organic
chemicals in the vadose zone. Each of these innovative technologies
either stretches the limitations caused by geology, contaminant proper-
ties, or access, or reduces the equipment and operating costs of conven-
tional SVE. Some are designed to improve SVE performance itself, for
example, by heating the ground to accelerate the contaminant evapora-
tion and increase the recovery rate. Others draw on different physical or
chemical processes for remediation.
Contaminant recovery is by no means the only remediation method
for the vadose zone. Bioremediation of hydrocarbons has been wide-
spread and successful in many vadose settings. Other possibilities
include chemically altering contaminants to benign compounds, or
injecting chemicals to markedly reduce the mobility of contaminants
and limit their ability to migrate to potential receptors. At some sites,
naturally occurring processes may reduce the concentrations of contam-
inants so that subsurface monitoring is sufficient to ensure remediation.
The purpose of this chapter is to identify the current state of our capa-
bility to remediate organic chemicals in the vadose zone. The first part
of the chapter describes the remedial technologies that are currently
available. The second part of the chapter compares the performance of
these technologies under a variety of conditions at contaminated sites.
Most of the remediation methods considered here fall unambiguously
into one of four major classes of remedial methods: recovery, destruc-
950 VADOSE ZONE SCIENCE AND TECHNOLOGY SOLUTIONS
tion, immobilization, and natural processes, and the chapter is organized
around these classes. However, a few of the technologies are capable of
more than one type of action; for example, heating the subsurface will
improve recovery but it can also destroy some contaminants by oxidiza-
tion or pyrolysis.
All of the technologies described in the following pages have
advanced through the development process and are now offered as a
service by private companies. Some are widely available, while other
methods are more specialized. A variety of other methods currently
show promise in the laboratory, and it is expected that they will soon be
added to the list of commercially available techniques.
REMEDIATION TECHNOLOGIES
C
ONVENTIONAL VAPOR EXTRACTION*
Soil vapor extraction (SVE) is the benchmark process for remediation
in the vadose zone. Its widespread application since it was developed in
the 1980s is probably responsible for cleaning up more sites than any
other in situ remedial method. SVE is achieved by inducing air flow
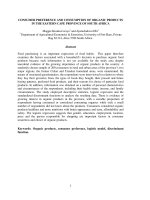
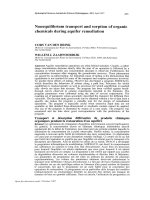
through the contaminated zone (Figure 7-1) to extract the contaminant-
laden vapors and promote vaporization/volatilization and subsequent
removal of liquid, dissolved, and sorbed contaminants. The pore-scale
situation depicted in Figure 7-1 can occur wherever air flow can be
maintained in the subsurface. Subsurface air flow is induced in a man-
ner analogous to pumping groundwater: vacuum blowers attached to
SVE vents serve the same purpose as pumps in water wells and reduce
pressures in extraction vents. SVE extraction vents resemble water wells
completed in the vadose zone. Air flows downward from the ground sur-
face towards the lower pressure in the extraction vents. Subsurface flow
could likewise be induced by injecting air under pressures greater than
atmospheric, but applying negative pressures (suction) allows the con-
taminated vapors to be captured and treated.
The subsurface flow of gases can be analyzed using a continuity
equation with Darcy’s law to relate volumetric flux to potential gradient,
CHAPTER 7 – REMEDIATION OF ORGANIC CHEMICALS IN THE VADOSE ZONE 951
*This section was contributed by J.S. Gierke.
and the ideal gas law to describe the equation of state (see Chapters 1,
3, and 5; Jordan et al. 1995). Because gas density is small, the gravita-
tional component of the fluid potential is typically ignored and flow is
induced primarily by pressure gradients. Analytical solutions exist for
idealized flow conditions (such as homogeneous, steady-state, and
axisymmetric) in either one- or two-dimensional configurations (John-
son et al. 1990a; Shan et al. 1992; Falta 1996). Numerical models
account for non-ideal flow geometries and heterogeneities. By ignoring
compositional effects on gas density and viscosity, and linearizing the
gas flow equation, groundwater flow models can be used to simulate air
flow induced by SVE (Baehr and Joss 1995).
The SVE contaminant removal process can be analyzed using a con-
tinuity equation approach with phase-partitioning (Henry’s law for air-
water, Raoult’s law for NAPL-air and NAPL-water, and linear sorption)
952 VADOSE ZONE SCIENCE AND TECHNOLOGY SOLUTIONS
Figure 7-1. Grain-scale view of soil vapor extraction process: fresh air drawn into
contaminated zone under induced vacuum displaces soil gas previously
equilibrated with the contaminant, causing vaporization/volatilization of
liquid, dissolved, and sorbed contaminants, potentially until chemical
equilibrium is achieved. The soil gas becomes progressively more
contaminated and eventually is extracted and treated.
Contaminated
soil gas
Fresh
air
Water
Liquid
contaminant
between the organic, aqueous, gaseous, and sorbed phases (see Chapters
1 and 5; Baehr and Hoag 1988). Nonequilibrium mass transfer is impor-
tant for chemical removal at a range of scales (Hiller and Gudemann
1989; Brusseau 1991; Gierke et al. 1992; Armstrong et al. 1994). Dif-
ferent stages of the removal process are characterized according to the
dominant mechanisms: initially, removal is dominated by advection,
which later transitions to diffusion-dominant (nonequilibrium) removal
(Jordan et al. 1995). The advection-dominant phase is shorter as the
degree of heterogeneity (in either the contaminant distribution or soil
permeability) increases.
The effectiveness of SVE in removal of vadose zone contamination is
due to the volatility of the contaminants, and the gas permeability of the
contaminated soil. SVE also enhances in situ biodegradation of many
organic contaminants, especially petroleum hydrocarbons. Biodegrada-
tion associated with induced air flow (bioventing) is discussed in more
detail later.
Contaminant Volatility
The property of volatility is characterized by the pure vapor pressure
of a contaminant present as a nonaqueous phase liquid (NAPL), or by
the Henry’s constant if it is present only in dissolved and sorbed phases.
Vapor pressure can be translated in terms of the carrying capacity of the
gas phase of the contaminant. For example, a compound with a vapor
pressure of 0.1-mm Hg at 25°C can achieve a vapor concentration up to
5.4 micromoles per liter of air, corresponding to the minimum vapor
pressure for which SVE is practical (Hutzler et al. 1989). However, this
lower limit of vapor pressure may be optimistic because the maximum
concentration is rarely reached in field applications for reasons
described below.
When contamination is present as a NAPL mixture, the capacity of
the vapor phase for each contaminant is reduced to an amount directly
proportional to its mole fraction in the NAPL phase (Chapter 1). John-
son et al. (1990a) discuss applications of Raoult’s law to SVE perform-
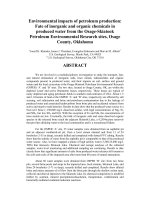
ance. The contaminant removal observed by monitoring the SVE offgas
may appear similar to the hypothetical curve shown in Figure 7-2.
The volatilization of a compound from the aqueous phase is prima-
rily a function of its Henry’s constant, which depends on the compound
CHAPTER 7 – REMEDIATION OF ORGANIC CHEMICALS IN THE VADOSE ZONE 953
vapor pressure and aqueous solubility. In general, compounds with what
is considered sufficiently high vapor pressure usually also have a high
enough Henry’s constant for SVE to be effective, that is, greater than 1
L atm/mole. (Jordan et al. 1995). Notable exceptions are miscible
organic compounds, such as many alcohols, phenol, and acetone, all of
which have high vapor pressures (greater than 80 mm Hg) but low
Henry’s constants (less than 0.04 L atm/mole) due to their high solubil-
ity in water.
Mixtures of dissolved contaminants increase, slightly, the volatility of
most of the individual constituents, as their solubilities often decrease in
the presence of other compounds. This effect is minimal and exceptions
954 VADOSE ZONE SCIENCE AND TECHNOLOGY SOLUTIONS
Figure 2. Characteristic offgas concentrations observed during SVE in conventional
configurations in permeable soils with NAPL contamination. Adapted from
Hiller and Gudemann (1989) and Johnson et al. (1990a).
Log concentration
Temporary flow stoppage
Log time
Advection-
dominant
removal
Diffusion-limited
removal
Transition
Raoult’s law equilibrium
removal for a NAPL mixture
Non-equilibrium
affected removal
exist when substances (such as surfactants or cosolvents) are present
that increase solubility.
Contamination is always present in a heterogeneous distribution.
Moreover, air flow follows the paths of least resistance (such as the
shortest distance or highest permeability). Therefore, not all of the
induced air flow will contact contamination. This bypassing of the con-
tamination leads to offgas concentrations that are lower than the ideal
concentration based on equilibrium calculations as illustrated in Figure
7-2. Grain-scale mass transfer processes also cause concentrations to be
lower than equilibrium values. Both causes will result in abrupt
increases in offgas concentrations when SVE flow is interrupted. From
a practical view, differentiation between causes of nonequilibrium is
unnecessary, but it remains an area of active research for development
and testing of mathematical models for SVE performance prediction.
Permeability
Permeability is the key factor determining whether a sufficient vapor
flow for practical achievement of cleanup goals can be achieved. In SVE
operations, soil permeability is the ability of air to flow through the
vadose zone. Gas density and viscosity also affect gas flow, but to a
much lesser extent for typical SVE applications (Johnson et al. 1990a;
Falta et al. 1989). Gas permeabilities are a complex function of gas-
filled porosity and pore size distribution. The gas permeability is the
product of the intrinsic permeability, k, and the gas phase relative per-
meability, k
rg
. In the vast majority of SVE projects, gas permeabilities
are estimated in situ by applying suction to a venting well, much like
aquifer permeabilities use pumping tests.
The minimum level of soil-gas permeability at which SVE is practi-
cal is difficult to establish because it depends on the extent of contami-
nation and the degree of anisotropy and heterogeneity of the soils,
among other factors. Shallow contaminated zones of limited areal extent
can be treated more efficiently than large zones of contamination. A
highly heterogeneous soil may have a high permeability measured in a
pilot test, but most of the flow is concentrated in localized, high-
permeability layers, and flow through the lower permeability matrix
blocks is negligible. In this case, remediation is limited by the rate of
CHAPTER 7 – REMEDIATION OF ORGANIC CHEMICALS IN THE VADOSE ZONE 955
diffusion from the low permeability zones and may be quite slow,
despite the high bulk permeability.
Implementation
SVE is considered a presumptive remedy for volatile organic chemi-
cal (VOC) contamination in the vadose zone, where the flow of air can
be induced at a rate sufficient to flush the gas-filled porosity in the treat-
ment zone on, at most, a daily basis. This qualitative criterion is consis-
tent with the limited performance data available to date. For example,
based on the projects listed in Table 7-1, several hundred to hundreds of
thousands of gas pore volume flushes are required to reduce contamina-
tion levels to meet risk-reduction objectives. Quantitative guidance is
not yet readily available because of a lack of predictive tools. Neverthe-
less, despite the lack of rigorously based approaches, design and opera-
tion of SVE has been successful at many sites (Table 7-1).
Table 7-1 lists a range of SVE applications that have been imple-
mented for various site and contaminant conditions. The volume of
treated soil at SVE sites ranges from 650 cubic yards to more than
200,000 cubic yards. Chlorinated solvents and/or fuel contaminants are
the most common problem, and concentrations range from low values,
where probably only dissolved and sorbed phases were present, to sites
where substantial NAPL contamination was present (upwards of 40
pounds of contaminants per cubic yard of soil). Reported costs vary
from a few dollars per cubic yard at large sites with low levels of con-
tamination, to more than a thousand dollars per cubic yard at sites with
severe geological limitations and heavy contamination. Moreover, some
of the projects were completed while others are works in progress. The
information in these reports is useful for compiling evidence of the fea-
sibility of SVE for many sites.
Historical Development
SVE was developed in the early 1980s. Identifying the “first” appli-
cation is controversial and was the subject of at least one patent suit in
the mid-1980s. The rapid acceptance of SVE as a soil treatment tech-
nology was due in part to the relative simplicity of the governing prin-
ciples (as outlined above), the early development of straightforward
956 VADOSE ZONE SCIENCE AND TECHNOLOGY SOLUTIONS
CHAPTER 7 – REMEDIATION OF ORGANIC CHEMICALS IN THE VADOSE ZONE 957
Summary of SVE performance at field sites in the U.S. from USEPA (1996 and 1998).
TABLE 7-1
continued
958 VADOSE ZONE SCIENCE AND TECHNOLOGY SOLUTIONS
Summary of SVE performance at field sites in the U.S. from USEPA (1996 and 1998) (continued).
TABLE 7-1
continued
CHAPTER 7 – REMEDIATION OF ORGANIC CHEMICALS IN THE VADOSE ZONE 959
Summary of SVE performance at field sites in the U.S. from USEPA (1996 and 1998) (continued).
TABLE 7-1
continued
960 VADOSE ZONE SCIENCE AND TECHNOLOGY SOLUTIONS
Summary of SVE performance at field sites in the U.S. from USEPA (1996 and 1998) (continued).
TABLE 7-1
design guidance (Johnson et al. 1990b; U.S. EPA 1991; Michaelson
1993), and the standardization of equipment and materials (Hutzler et al.
1989).
SVE gained acceptance more rapidly than any other innovative treat-
ment technology (Gierke and Powers 1997). Two factors contribute to
the continued popularity of SVE: its successful remediation of many
sites where effective flows are established (see more in the “Status” sec-
tion below, and in U.S. EPA 1995 & 1998), and its effectiveness in
reducing health risks to an acceptable level, so that treatment is no
longer necessary. Demonstrations of complete removal of contaminants
are few.
The basic design, installation, and operational practices have not
changed substantially since those described by Johnson et al. (1990b),
U.S. EPA (1991), Michaelson (1993), and, more recently, in a compre-
hensive text by Holbrook et al. (1998). Design refinements and new
developments focus on improvements in offgas treatment, blower per-
formance and durability, and efficiency of screens. Predictive tools for
forecasting SVE performance and optimizing system design have been
developed but are not yet fully proven (Jordan et al. 1995).
Design Considerations
The basic design considerations for SVE are the number and place-
ment of extraction vents, selection of blower(s) to achieve desired flow
rates, and selection of the offgas treatment system (Figure 7-3). When
suction is applied using a blower, air flows from the ground surface,
through the contaminated zone, and to extraction vents. An impermeable
barrier at the ground surface may impede the flow of atmospheric air
and is sometimes used to affect air flow pattern to vents. Where the
treatment area is covered or where heterogeneities/anisotropic condi-
tions exist that limit vertical air movement, subsurface flows can be
modified by either allowing air to flow into inlet vents (vents open to the
atmosphere) or by injecting air or treated offgas into vents. Sparge wells,
which inject air below the water table, are also sometimes used in SVE.
Inlet vents are usually sufficient to prevent stagnant zones and encour-
age flow deep into heterogeneous/anisotropic soils. Air injection can
cause contaminant vapors to move away from the treatment zone. It is
CHAPTER 7 – REMEDIATION OF ORGANIC CHEMICALS IN THE VADOSE ZONE 961
common to configure extraction vents so they can operate as either
extraction or inlet vents.
Vents
Most SVE vents utilize water-well screens and casing that are
installed vertically in the vadose zone, much like water wells in aquifers.
Preferably, the screen on the vent is located below the contaminated
zone (U.S. EPA 1991; Shan et al. 1992). In shallow settings (less than
962 VADOSE ZONE SCIENCE AND TECHNOLOGY SOLUTIONS
Figure 7-3. Conventional SVE configurations for removal of volatile contaminants
from the vadose zone shown for a leaky underground storage tank (LUST)
situation.
4-m deep), installation of horizontal vents to obtain more efficient vapor
flow is feasible and sometimes more practical (U.S. EPA 1991; Aiken
1992).
The number of vents is usually determined by the size of the con-
taminated area and the radius of influence (ROI) of the extraction vents.
Vents are situated so that their ROI overlap and encompass the contam-
inated area (Johnson et al. 1990b and U.S. EPA 1991). This oversimpli-
fied approach is increasingly recognized as inappropriate because it
ignores gas residence times (flushing rates) and hence the contaminant
removal rates. A more appropriate approach is to define the treatment
zone around an extraction vent based on a desired flushing rate, which
can be determined for homogeneous conditions using analytical
approaches (Shan et al. 1992) or for more general conditions using
numerical models (Jordan et al. 1995). In either case, induced subsur-
face air flow is affected by heterogeneities, and rarely will actual flow
patterns follow idealized predictions. Site capping, proper vent installa-
tion, and inlet/injection venting are useful methods for flow pattern
control.
Vertical vent installations are predominantly completed in unconsol-
idated deposits using hollow-stem augers and either pea-gravel or
coarse-sand filterpacks, as depicted in Figure 7-4a. Proper grouting near
the ground surface is necessary to minimize “short-circuiting” of air
through the filterpack. Direct-push technologies can be used to install
vents in high-permeability, coarse-grained soils, but precautions need to
be taken to ensure that screens do not become plugged with fine-grained
sediments. There are no development methods to flush well screens in
the unsaturated zone like those for wells in the saturated zone. Also,
short-circuiting is likely when the top of the screen is near the ground
surface. Horizontal vents can be installed in a back-filled trench as
shown in Figure 7-4b, or with directional-drilling techniques. Direc-
tional-drilling installations are susceptible to screen-plugging unless
precautions are taken to minimize screen contact with fines, or clog
removal procedures are performed. Stainless steel wire-wrap screens are
least susceptible to chemical attack and are more pneumatically efficient
than slotted screens. High-density polyethylene and polyvinyl chloride
slotted screens are more economical than stainless steel and are chemi-
cally resistant to petroleum hydrocarbons and chlorinated organics when
concentrations are low. Steel and polyvinyl chloride are the two most
CHAPTER 7 – REMEDIATION OF ORGANIC CHEMICALS IN THE VADOSE ZONE 963
common materials for vent casing and above-ground plumbing. Nomi-
nal diameters for screens, casing, and piping are usually between ¾ and
4 inches.
The above-ground plumbing should include valves and ports to allow
flexibility in flow configurations, flow metering (rates and pressures),
and ports for concentration monitoring to optimize system performance.
964 VADOSE ZONE SCIENCE AND TECHNOLOGY SOLUTIONS
Figure 7-4. Vent configurations in Unconsolidated Deposits: (a) vertical and
(b) horizontal trench.
(a)
(b)
Casing (steel or PVC)
Casing (steel or PVC)
Grout
(bentonite/cement mixture)
Grout
(bentonite/cement mixture)
Filter pack
(gravel or coarse-sand)
Filter pack
(gravel or coarse-sand)
Screen
(slotted PVC or wire-wrap)
Screen
(slotted PVC or wire-wrap)
Water table
Water table
Because there is no readily available design guidance for the above-
ground plumbing specific for SVE, refer to a fluid mechanics handbook
that includes gas flows. Pressure losses in the piping and fittings can be
significant and should be considered (Peramaki 1993).
Blower Selection
Blower selection is critical to power requirement minimization. In
permeable soils, dynamic-displacement blowers typically are used to
induce gas flow. Positive-displacement blowers, usually rotary-lobe,
are used where the soil permeability is low. Dynamic-displacement
blowers can provide high flows at low suctions, but blower perform-
ance diminishes rapidly as suction increases. Positive-displacement
blowers operate at a constant flow rate over a wider range of suction,
but their maximum flow rate is less than that of dynamic-displacement
blowers.
In order to determine blower size for a full-scale operation, a pilot
test measures in situ gas permeabilities. It is common to rent a blower
for the pilot test and size the blower(s) that will be required for the full-
scale remediation based on the pilot performance measurements (flows
and vacuums), adjusted for the full-scale plumbing configurations. At
sites where the soils are highly heterogeneous, such as glacial deposits,
several pilot tests in different locations are performed to ensure that the
desired flows can be achieved across the entire treatment area.
Thermally protected, intrinsically safe, explosion-proof equipment
should be used. Blowers should not be throttled to control flow rates
but rather plumbed to bleed in air from above-ground; however, this
condition can be avoided altogether by properly selecting a blower to
minimize power usage. Blowers must be protected from dust by filters
and from liquid droplets by moisture separators or knockout drums, as
illustrated in Figure 7-3. Systems are configured with a float switch to
shut down the blower so that the moisture separator can be drained
when it fills with water. The blower, moisture separator, and associated
electrical controls are purchased as a complete system and configured
to the site requirements. Three-phase 230/460-voltage blower motors
are the most efficient and should be used if the appropriate electrical
service is available.
CHAPTER 7 – REMEDIATION OF ORGANIC CHEMICALS IN THE VADOSE ZONE 965
Offgas Treatment
The offgas treatment system can be the most expensive part of the
remediation system. Granular activated carbon has the lowest capital
cost, but it can be rapidly saturated, and is a poor choice where chemi-
cals are recovered at high concentrations. Combustion and thermal/cat-
alytic oxidation units are more expensive to purchase than granular,
activated carbon but are cheaper to operate when offgas concentrations
are high and if the contaminants are combustible and/or can be oxidized.
Offgas treatment units/systems can be rented and some vendors provide
pilot-scale units to be tried during permeability tests. Pilot tests tend to
over-predict contaminant removal rates. Therefore offgas treatment
should be considered over the long term by providing for flexibility to
either adjust operating conditions when concentrations diminish or to
switch to other treatment options.
Costs
Extraction vent installation and the purchase of an offgas treatment
system and blower(s) comprise the majority of capital costs. Operating
and maintenance (O&M) costs include the costs of supplying power for
the blower(s) and for operation of the offgas treatment system (such
costs include fuel replenishment, replacement/regeneration of carbon,
etc.). Initial site characterization, performance assessment, and monitor-
ing costs are often close to the costs of remediation alone.
Augmenting Technologies
Conventional SVE performs well at sites where the contaminants are
relatively volatile and soils are relatively permeable to air. Augmenting
technologies can be implemented to enhance both volatility and perme-
ability at sites where these factors are limiting. There are four important
methods for increasing the volatility of contaminants by heating soils:
thermal conduction, radio-frequency, 6-phase joule, and steam injection;
these technologies are described in the following pages. Soils also are
heated by injecting hot air into vents, and this simple augmentation
increases SVE performance. Hot air injection is a straightforward
modification of conventional SVE and it is not described as a separate
technology .
966 VADOSE ZONE SCIENCE AND TECHNOLOGY SOLUTIONS
SVE usually performs poorly in low-permeability soils, especially
those containing clays, because air flow rates are too slow to flush out
contaminants. Rock and soil formations can be fractured to enhance
their permeability. Pneumatic fracturing increases SVE performance in
glacial drift as well as fractured shale (Murdoch et al. 1994; Frank and
Barkley 1995), and hydraulic fracturing also enhances SVE in a variety
of low-permeability formations (Murdoch et al. 1994). The efficacy of
fractured systems for long-term complete cleanup is unknown because
diffusion of contaminants from the unfractured matrix to the fractures
may require a longer time than is known (Grathwohl 1998).
Deep soil mixing disrupts the soil fabric with a large auger, markedly
increasing air flow rates within the mixed volume. Hot air or steam also
can be injected to increase the volatility of contaminants, further
increasing SVE recovery (Siegrist et al. 1995).
Large-scale, small-pressure disturbances associated with weather
systems can cause gas flow into and out of the subsurface; this process
is called “barometric pumping.” Barometric pumping is used as a long-
term, low-operating-cost form of SVE for slow removal of diffusion-
limited contamination through a combination of volatilization and
enhanced bioremediation.
Monitoring
SVE is monitored in situ by measuring pressures, obtaining gas sam-
ples from vents, or obtaining soil samples at various times during the
project. It is monitored aboveground by measuring pressures, flow rates,
and compositions of gases at the access ports in the process equipment.
The variables typically monitored during SVE operation are listed in
Table 7-2, but some of these variables are not necessarily representative
of subsurface conditions. For example, subsurface gas pressures are
needed during pilot tests for determining gas permeabilities; however,
during full-scale operation they are not necessarily indicative of subsur-
face gas velocities, nor even useful for identifying areas where flow is
occurring, because suction can be observed at vents even where the air
is stagnant. A more effective measure of vent influence is change in con-
centrations of contaminants, oxygen, or tracers in soil gas.
Concentrations of contaminants are difficult to measure at sites where
contaminants are present as mixtures. Typically, several constituents are
CHAPTER 7 – REMEDIATION OF ORGANIC CHEMICALS IN THE VADOSE ZONE 967
968 VADOSE ZONE SCIENCE AND TECHNOLOGY SOLUTIONS
Variables monitored during SVE design activities and operation.
TABLE 7-2
Measurement Operational
Property Location Data Purpose Phase
Gas Pressure In situ at vents Establish radius of influence Pilot test(s)
Determine subsurface pressure Pilot test(s)
gradients and flow directions & Full-scale operation
Quantify gas permeabilities Pilot test(s)
Above-ground piping Size blower(s) Pilot test(s)
Ensure operation consistent Full-scale
with blower capabilities operation
Gas Flows Vent(s) Control system flow Full-scale operation
Determine air permeability and Pilot test(s)
blower performance required
Quantify contaminant mass Pilot test(s)
removal & Full-scale operation
Vapor In situ at vents Measure performance Full-scale operation
Concentrations
Above-ground piping Measure performance Pilot test(s)
(total &
& Full-scale operation
contaminants
of concern)
Offgas treatment Measure offgas treatment Full-scale operation
discharge system performance &
Discharge safety and permit
compliance
Soil Soil Samples Delineate contaminated area Pre-treatment
Concentration Establish treatment performance characterization
(total and and compliance
contaminants
of concern)
Temperature Flow meters Calculation of gas flow rates Pilot test(s)
and concentrations & Full-scale operation
corresponding to operating
conditions
Soil moisture Soil samples Establish initial conditions Vent installation
selected as contaminants of concern (COC), such as benzene, toluene,
ethylbenzene, and xylene (BTEX). Equivalent and comprehensive
measures are also used, such as total hydrocarbons/VOCs (gasoline
range organics) or total petroleum hydrocarbons (diesel range organics).
Reductions in COC concentrations do not necessarily correlate to over-
all contaminant removal.
Flow rates and concentration measurements help to monitor system
performance and can be used, potentially, to improve operations. When
removals are dominated by advection but are transitioning towards dif-
fusion-limited, rising extraction rates increase mass removal rates even
though offgas concentrations may decrease as a result of a higher pro-
portion of bypassing or reduction in gas residence times (allowing less
time for equilibration). When the removal rate is diffusion-limited
(Figure 7-2), increasing the extraction rate provides a negligible increase
in the mass removal rate. Combustion and catalytic oxidation methods
for offgas treatment benefit from high vapor concentrations, so
monitoring concentrations (in terms of fuel value) from individual
extraction vents can be used to optimize the performance of offgas treat-
ment.
Comprehensive site characterization of permeability and contaminant
distributions helps to locate extraction vents in the most permeable,
highest-concentration areas, and maximizes extracted vapor concentra-
tions, leading to maximum offgas treatment efficiency.
Status
SVE is a mature technology with thousands of applications. A selec-
tion of detailed case studies (U.S. EPA 1995 & 1998) summarizes site
and contaminant characteristics, system configuration and key design
criteria, operational performance, capital and O&M costs, regulatory
issues, lessons learned, technical contacts, and additional references.
CHAPTER 7 – REMEDIATION OF ORGANIC CHEMICALS IN THE VADOSE ZONE 969
The case studies “Modeling the Performance of a SVE Field Test,” by M.E. Beshry,
J.S. Gierke, and P.B. Bedient (see page 1157), and "Scale Dependent Mass Transfer During
SVE" by C.K. Ho, describe applications of this technology in more detail (see page 1170).
BAROMETRIC PUMPING: PASSIVE SOIL VAPOR EXTRACTION*
SVE installation and equipment operation is impractical at many
locations where it could benefit remediation. An inexpensive system
using a renewable energy source and operating in the gas phase can fill
the gap in these locations. Natural variations in atmospheric pressure,
due to diurnal temperature fluctuations or weather changes associated
with major fronts, can cause gases to flow to or from wells completed in
the vadose zone. This process, called “barometric pumping,” induces
large enough flow rates to provide meaningful remediation effects and
can also be used for subsurface characterization.
Barometric pressure, an important, easily measured property of the
near surface atmosphere, is the force per unit area generated by the
weight of an air column extending upward 160 km to the top of the
stratosphere (Hodgman 1952). It can be accurately measured using a
simple pressure gauge, or barometer. The weight of the air column
reflects the column’s air density, which varies markedly from the ground
to the stratosphere. Air density is a strong function of temperature and it
responds to heat radiated from land surfaces or water, or absorbed
directly from solar radiation. Density also varies with changes in humid-
ity, atmospheric chemistry, or other dynamic factors associated with
weather systems. As a result, records from barometers show regular
fluctuations or cycles. The daily cycle of sunlight and darkness causes
temperature changes in the atmosphere to produce a diurnal cycle of
barometric pressure that typically varies by less than a percent of the
total average pressure. A complicated interplay of thermal and chemical
effects in many areas cause even larger fluctuations in barometric pres-
sure, typically a few percent of the total pressure, which occur every few
days or weeks in response to major weather systems.
The fluctuating barometric pressure is transmitted into the subsurface
to cause variations in the pressure of vadose zone gases, resulting in air
flow from areas of high pressure to areas of low pressure in the subsur-
face, just as in the atmosphere. The pressure differences between adja-
cent zones in the subsurface that drive these flows are small and the
flows that they produce are modest, often only detectable under special
970 VADOSE ZONE SCIENCE AND TECHNOLOGY SOLUTIONS
*This section was contributed by J. Rossabi.
conditions. As a result, the subsurface flow caused by barometric fluc-
tuations, until recently, has been overlooked by an environmental com-
munity eager for quick solutions to vadose zone contamination.
However, when specific subsurface zones are connected directly to the
surface by a vadose zone well, pressure differences are much larger and
can produce flows as large as 700 liters per minute from 10 cm-diame-
ter wells. Barometric pumping can move significant volumes of air, it
occurs regularly, and it is free.
Barometric pumping was recognized as an interesting phenomenon
long before it was used for remediation. Native Americans used “blow-
holes” (areas that mysteriously drew in or blew out air at different times)
to forecast weather and as the focal point of rituals (Fisher 1992). Spele-
ologists recognized that some blowholes were actually caves, and they
showed that the air flow in “breathing” caves varied periodically as a
result of barometric cycles, wind-driven pressures, preferential solar
heating, or a combination of these processes. Hydrologists have recog-
nized barometric effects since at least 1896, when Fairbanks described
a well that intermittently released natural gas when barometric pressure
decreased and drew air in when pressure increased (Science 1896). He
noted that the rate of gas flow increased during periods of changing
weather. An early monograph describing the release of carbonic acid
from soil and its replacement with oxygen from the atmosphere also
mentions this effect (Buckingham 1904). Among other important obser-
vations, Buckingham predicted that the pressure fluctuation in the sub-
surface would lag behind fluctuations in the atmosphere, and the lag
time should increase with depth.
Several processes related to barometrically-derived subsurface flow
are environmentally important. Pressure fluctuations resulting from
barometric effects were observed in the subsurface during experiments
at the proposed Yucca Mountain, Nevada, repository for nuclear waste
(Ahlers et al. 1998). Gas flow accompanying the pressure fluctuations
can change the subsurface moisture content, which could significantly
affect the flow and transport of contaminants over long periods. Thus,
barometrically induced flow could affect the performance of the nuclear
waste repository. The naturally induced flow of radon gas through the
vadose zone and into buildings hits closer to home. Many researchers
(Owczarski et al. 1990; Narasimhan et al. 1990; Tsang and Narasimhan
1992; Garbesi et al. 1993; Robinson and Sextro 1995) have shown that
CHAPTER 7 – REMEDIATION OF ORGANIC CHEMICALS IN THE VADOSE ZONE 971
barometric pressure fluctuations affect the transport of radon gas into
houses. Other investigators in the environmental field (Little et al. 1992;
Massman and Farrier 1992; Pirkle et al. 1992; Forbes et al. 1993; Shan
1995; Auer et al. 1996; Ellerd et al. 1999; Rossabi 1999) examined the
potential effects of barometric fluctuations on the transport of VOCs.
They describe effects on shallow soil gas surveys, the transmission of
the surface pressure to depth, and resultant gas transport in natural sed-
iments with organic contamination.
Barometric pumping for remediation purposes has led to two primary
applications: the injection of air to increase the oxygen content and stim-
ulate aerobic biodegradation (Zachary 1993; Zwick et al. 1994), and the
recovery of air and contaminated vapors (Rohay and Cameron 1992;
Rossabi et al. 1994; Riha and Rossabi 1997; Ellerd et al. 1999). Both
applications have counterparts, bioventing and SVE, that use mechani-
cal pumps to move air, so the basic remedial processes employed by the
applications are well known. Both passive vapor extraction and passive
vapor injection can be used under the right conditions to control the
migration of subsurface gas (such as landfill gas). Barometric pumping
sacrifices the high flow rates achieved by pumps for the cost of operat-
ing and maintaining them. This tradeoff is attractive in circumstances
where contaminants occur at low, but significant, concentrations. How-
ever, it is important to be able to estimate the potential effects of baro-
metric pumping before it can be used for remediation.
Characterizing The Effect
At the Savannah River Site in South Carolina, significant flow of con-
taminated air out of vadose zone wells was observed following drops in
barometric pressure. The conceptual model explaining this occurrence
indicates that the air flow in and out of wells is a result of the difference
in pressure between the formation at the screened zone of the well and
the atmosphere at the surface. Atmospheric pressure fluctuations are
damped and delayed during transmittal through the subsurface. The
delay and attenuation of pressure changes in the subsurface with respect
to the surface pressure produces a pressure differential that drives flow
through wells between the subsurface and the atmosphere.
A test well was instrumented and monitored in detail to evaluate the
conceptual model and to provide data to assess the effectiveness of the-
972 VADOSE ZONE SCIENCE AND TECHNOLOGY SOLUTIONS
oretical predictions. The well was completed with a 2-m-long screen at
a depth of 30 m in partially saturated sands and silts. Barometric pres-
sure and the gas pressure at 30 m depth were recorded along with the gas
flow rate into and out of the well during a 30-day test period in the
spring of 1994.
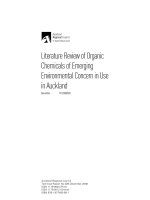
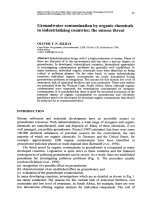
The barometric pressure varied diurnally by a few mbar, but it varied
by several tens of mbar over periods of three to five days during the test
(Figure 7-5). The subsurface pressure showed little diurnal variation, but
it always lagged approximately 12 hours behind the three- to five-day-
long barometric fluctuations. That lag produces a pressure differential
between the atmosphere and pore gases at a depth of 30 m. The pressure
differential was commonly 5 mbar, with the greatest being about
12 mbar (Figure 7-5). In general, the differential was positive (atmos-
pheric pressure is greatest, indicating that air flows into wells) when the
barometer was rising, and it was negative when the barometer was
falling (Figure 7-5).
Pressure differentials were sustained for approximately three to five
days before changing sign. This defined periods of several days when
the flow was either into or out of the well. For example, the pressure dif-
ferential indicated that air was flowing out of the well on days 0-4, 6-7,
CHAPTER 7 – REMEDIATION OF ORGANIC CHEMICALS IN THE VADOSE ZONE 973
Figure 7-5. Barometric pressure, observed subsurface pressure, and predicted sub-
surface pressure in a well 30.5 m deep with a 2-m-long screen at
Savannah River Site.
MHV 3A Subsurface Pressure Model (January)