TRENDS IN THE HEALTH OF THE ELDERLY ppt
Bạn đang xem bản rút gọn của tài liệu. Xem và tải ngay bản đầy đủ của tài liệu tại đây (412.57 KB, 22 trang )
13 Feb 2004 12:59 AR AR209-PU25-04.tex AR209-PU25-04.sgm LaTeX2e(2002/01/18) P1: IBD
10.1146/annurev.publhealth.25.102802.124401
Annu. Rev. Public Health 2004. 25:79–98
doi: 10.1146/annurev.publhealth.25.102802.124401
Copyright
c
2004 by Annual Reviews. All rights reserved
TRENDS IN THE HEALTH OF THE ELDERLY
Eileen M. Crimmins
Andrus Gerontology Center, University of Southern California, Los Angeles,
California 90089-0191; email:
Key Words disability, morbidity, mortality
■ Abstract Health among the older population as measured by most dimensions
has improved during the last two decades. Mortality has continued to decline, and
disability and functioning loss are less common now than in the past. However, the
prevalence of most diseases has increased in the older population as people survive
longer with disease, and the reduction in incidence does not counter the effect of
increased survival. On the other hand, having a disease appears to be less disabling
than in the past.
INTRODUCTION
Interest intrendsinthehealthof theelderlyhasbecome widespread in recentyears.
Until about two decades ago, trends in mortality were assumed to provide a good
indicator of the health of the elderly, and because mortality was decreasing fairly
steadily, it was assumed that health was improving. Subsequently, both researchers
and policy makers have come to understand that health is a multidimensional
concept and that trends in mortality do not necessarily represent trends in all other
dimensions of health; and, in fact, change in all dimensions does not have to be
similar (11, 78).
This recognition of the multidimensionality of health, and the potential for vari-
ability in trends in different aspects of health, have led to questions about whether
increases in life expectancy have been accompanied by increases in healthy life or
whether they have been concentrated in years of unhealthy life (36). Significant
research has focused on this topic in recent years (64, 68).
Of course, trends in healthy life can be defined in terms of any of the health
dimensions. In addition, information on the prevalence, incidence, and duration of
healthconditionsprovides differentanswersabout health trends.Insightsinto these
complex interacting processes affecting population health change have come from
the development of models and simulations linking these aspects of health change
(5,14).Theseeffortshaveallowed researcherstobetterunderstandthe mechanisms
underlying time trends in population health. Because empirical studies differ in
the definition of health used, the time period analyzed, and the population covered,
results on time trends have been somewhat confusing. However, in the 1990s time
0163-7525/04/0421-0079$14.00 79
Annu. Rev. Public. Health. 2004.25:79-98. Downloaded from arjournals.annualreviews.org
by University of Southern California on 02/02/07. For personal use only.
13 Feb 2004 12:59 AR AR209-PU25-04.tex AR209-PU25-04.sgm LaTeX2e(2002/01/18) P1: IBD
80 CRIMMINS
trends have become somewhat clearer as studies have reported most dimensions
of health to be improving.
This discussion first reviews early theoretical clarifications of how popula-
tion health change is linked to reduction in mortality at older ages. We briefly
discuss evidence of trends prior to recent decades, subsequent understanding of
trends from empirical models of health, and developments in understanding the
dimensions of health and the process of health change for an aging population.
Recent trends in each dimension of health are then reviewed, ending with a discus-
sion of trends in healthy life, which is a combination of mortality and morbidity
dimensions.
BACKGROUND
Theoretical Underpinnings of the Study of Trends in Health
Theoretical development in the area of health change in an older population began
with the realization that the rapid mortality decline among the old beginning in the
late 1960s could be linked to important population health consequences (15, 75).
Fries (36) generated some of the interest in trends in health with his promotion
of the idea that there was an ongoing “compression of morbidity.” His assertion
rested on assumptions that mortality at the older ages would reach a limit beyond
which there could be no further decline and that there was an ongoing increase in
the age of disability onset. Under these conditions, there would be a compression
of morbidity into a smaller number of years at the end of life. Subsequent research
has addressed both of these assumptions.
This optimistic view of Fries was replacing a pessimistic view, termed the
failure of success, expressed earlier by Gruenberg (38). This view, also based on
limited evidence, felt that the extension of life for persons with chronic conditions,
without areductionin the incidenceofthese conditions, wouldleadto deterioration
in population health. Manton (48) proposed a position somewhere between the
two outlined above. His view, termed dynamic equilibrium, hypothesized that the
severity and rate of progression of chronic disease would be related to mortality
changes so that, with mortality reduction, there would also be a reduction in the
rate of the deterioration of the vital organ systems of the body. Manton indicated
that this could result in more disease in the population, but the disease would be
at a lower level of severity.
The above theoretical discussions have been useful in clarifying that one needs
to use a basic epidemiological approach in thinking about the relationship between
trends in different aspects of health. Mortality is a dynamic process that removes
people from the population at a faster or slower rate over time. The number or pro-
portion of people who are not healthy in a population is an indicator of population
health—or a stock measure—at a point in time. This indicator is affectedbyanum-
ber of dynamic processes: the age-specific onset rates of unhealthy conditions, the
rate of health deterioration of people with these conditions, and the likelihood that
Annu. Rev. Public. Health. 2004.25:79-98. Downloaded from arjournals.annualreviews.org
by University of Southern California on 02/02/07. For personal use only.
13 Feb 2004 12:59 AR AR209-PU25-04.tex AR209-PU25-04.sgm LaTeX2e(2002/01/18) P1: IBD
TRENDS IN ELDERLY HEALTH 81
people with and without conditions will die. The number of processes involved
means that the relationship between changing mortality and changing health is
not as simple as once assumed and that understanding trends in health requires
understanding trends in a series of processes.
Models Linking Mortality Change and Health Change
The theoretical approaches described above were developed without reference to
empirical findings. Initial examinations of empirical health trends indicated that
the trends differed when different aspects of health were examined and that some
indicators showed improving health and some deteriorating health. For instance,
Verbrugge (76) noted that from 1972 to 1981 there were increases in reported
diseasepresenceanddisability,yetimprovementsinself-reportedhealth.Anumber
of researchers from a variety of countries noted that the 1970s were a period of
decreasing mortality and increasing disability (4, 19, 67).
Initially, the possibility that health could deteriorate while mortality improved
was dismissed, and instead the accuracy of self-reports of disability and disease
was questioned (70, 79). Subsequent analyses and further developments of models
linking health and mortality have made it clear that this is not only possible but
likely under some scenarios (5, 14). Through simulations of relationships among
changes in mortality, morbidity incidence, and the prevalence of health problems,
it has become clear that decreases in mortality or increases in life expectancy do
not have to be linked to improvements in population health. For incurable chronic
diseases, the prevalence of poor health is determined by the incidence of the dis-
ease and the length of time people have the disease. If mortality declines because
people with the disease are saved from death but the onset rate stays the same,
the proportion of the population with the disease will increase. On the other hand,
if mortality declines because the age-specific incidence of disease has been re-
duced, then longer life will be accompanied by fewer people with disease (5, 14,
76). The effects of change do not have to be consistent across all segments of the
population. Improvements in the health of persons in their 60s can be linked to
eventual deterioration in the health of those in their 80s (5). This understanding
of the complex process of health change has been important in our current ap-
proach to the question of how different aspects of health change are related. It has
also shown the value of simulation models in addressing some of the theoretical
questions.
Dimensions of Population Health
As noted above, early investigations of health trends did not differentiate among
the dimensions of health. A number of researchers and international organizations
have developed approaches to clarifying health dimensions during the past three
decades that allow us to better understand how trends in dimensions of health
may differ (65, 78). The underlying ideas developed in different classifications
are generally the same, although there are important differences in terminology
Annu. Rev. Public. Health. 2004.25:79-98. Downloaded from arjournals.annualreviews.org
by University of Southern California on 02/02/07. For personal use only.
13 Feb 2004 12:59 AR AR209-PU25-04.tex AR209-PU25-04.sgm LaTeX2e(2002/01/18) P1: IBD
82 CRIMMINS
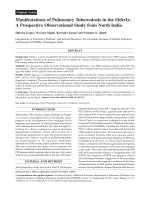
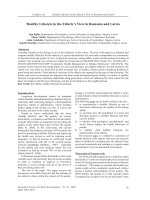
Figure 1 The process of population health change.
between Americans and that used in many other countries and many international
organizations.Figure 1isderivedfromthe discussionofVerbrugge&Jette(78) and
reflects an American view of the dimensions of health. The five boxes represent
different dimensions of health. Trends in any one of them have been used as
evidence of health trends overall, but they represent quite different aspects of
health and may be affected by different processes.
To begin, at the left of the figure, trends in risk factors or biological markers
such as cholesterol and other lipids, weight, and indicators of insulin regulation are
separate markers of underlying health and population propensity to disease. At the
population level, the age of onset of these factors generally precedes the onset of
related diseases like cardiovascular disease and diabetes. The second box includes
diseases, conditions,andimpairments. Sometimes itisdifficulttoseparatediseases
from conditions that may or may not have a clear disease process and may or may
not have associated impairment. Cognitive deterioration is not always linked to a
recognized disease process, and it is not always accompanied by impairment. This
example underscores that population health includes both mental and physical
conditions.
Functioning loss is the inability to perform certain physical or mental tasks,
such as lifting, walking, balancing, reading, writing, counting, and using fingers
and hands to grasp and open. Functioning loss generally results from the onset of
diseases and conditions and occurs at a later age than disease onset. Disability is
the inability to perform an expected social role. For older people, this has gen-
erally been defined as independent living and self-care. For middle-aged people,
disability is defined in terms of ability to work or do housework. For children,
disability is the inability to participate in mainstream education. An important
difference between functioning loss and disability is the potential influence of the
external environment. Although in practice it may sometimes be difficult to clearly
separate the two concepts, functioning loss is defined as a functioning deficit in
an individual; disability on the other hand is an inability to perform within the
environment. Disability can be affected by conditions external to the person. For
instance, moving to a house without stairs or a home with a walk-in shower might
allow someone to live independently who could not do so with different housing
characteristics.
All of these dimensions of health should be affected by changes in underlying
risk factors, and all can be influenced by interventions of various types. For in-
stance,healthcare interventionsfor thosewhohavea disease—heartdisease—may
Annu. Rev. Public. Health. 2004.25:79-98. Downloaded from arjournals.annualreviews.org
by University of Southern California on 02/02/07. For personal use only.
13 Feb 2004 12:59 AR AR209-PU25-04.tex AR209-PU25-04.sgm LaTeX2e(2002/01/18) P1: IBD
TRENDS IN ELDERLY HEALTH 83
delay theprogressof the disease andreducesubsequent functioning loss, disability,
and death from heart disease.
Figure 1 is simplified in that it provides a view of health change in a pop-
ulation, not change within individuals. Individuals do not have to pass through
all phases of health deterioration. Some people have a heart attack and die from
heart disease before they ever know they have the condition, before they have a
chance to be disabled. In addition, individuals can move in and out of some of
these health states: Disability and functioning loss may be transitory, and people
can return to full functioning and ability. Whether chronic diseases are absorbing
states from which there is no return to the healthy population depends somewhat
on the condition. We do not think of cures from heart disease, but we do speak
of cured cancer after some number of years have passed. Additionally, there is
a strong link between mortality and morbidity for some conditions, e.g., cardio-
vascular disease; for others, e.g., arthritis, there is no link between morbidity and
mortality.
HEALTH TRENDS
Mortality Trends
During the entire twentieth century, mortality among the old declined about 1%
per year, and the whole period has been a time of fairly regular increase in life
expectancy (43, 62, 81). There have been some years of more rapid decline in old
age mortality, such as from 1968 until the early 1980s, and years of slower decline,
such as from 1954 to 1968 (10, 43). Even the last two decades have been a mixture
of slower and more rapid periods of mortality decline for the older population (81).
Compared to the 1970s, there was substantial slowing in the rate of mortality
decline in the 1980s among the entire older population in the United States, but
it was due to a slowdown on the rate of decline among females. In the 1990s the
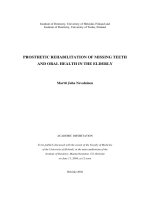
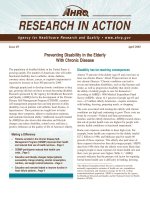
overall rate of decline was somewhat higher than in the 1980s. Trends in annual
death rates by gender from 1981 to 1998 for three age groups of the old are shown
in Figure 2. Mortality for males in each age group shows a fairly regular decline
during the 20 years. For females in some age groups, the early 1980s were not
even a period of decline. This differential trend by gender is almost the opposite of
what occurred in the 1970s when females experienced greater decline than males.
One explanation for the different gender patterns of change is that because of their
higher likelihood of smoking, men did not experience the same gains as women
in the 1970s; then, decreased smoking among men resulted in more mortality
improvement.
Since 1980, the decline in mortality in the United States has resulted in a three-
year increase in life expectancy at birth with an increase about half as great at age
65 (Table 1). Because of the differential mortality decline described above, men
above age 65 have gained about 2 years of life on average since 1980, whereas
women have gained about 1 year.
Annu. Rev. Public. Health. 2004.25:79-98. Downloaded from arjournals.annualreviews.org
by University of Southern California on 02/02/07. For personal use only.
13 Feb 2004 12:59 AR AR209-PU25-04.tex AR209-PU25-04.sgm LaTeX2e(2002/01/18) P1: IBD
84 CRIMMINS
Figure 2 Death rates, all causes, 65–74, 75–84, 85+, 1981–1998 (58).
There is mixed opinion on the likelihood of continued long-term increase in
life expectancy. Most demographers including Vaupel and Lee (44, 45, 62) are
optimistic about continued increases in life expectancy and decreases in mortality
among older persons. Olshansky (63) has been a promoter of the idea that future
increases will be minimal. The arguments for modest expectations generally rest
on the notion that it would take very substantial decreases in mortality at older
ages to achieve continued increases in life expectancy, and these would require
scientific understanding and an ability to address the basic mechanisms of aging
that are unlikely. The argument for continued optimism is that what would happen
in the future is likely to be similar in magnitude of effect to what has happened in
the past in terms of decreased mortality and scientific progress, and thus increases
in life expectancy would continue. In addition, empirical evidence provides no
sense that a limit to life expectancy, or old-age mortality decline, has been reached
(83). For the United States in particular, much decline is necessary to reach the life
expectancy of the current world leader, which is Japan; however, it seems likely
Annu. Rev. Public. Health. 2004.25:79-98. Downloaded from arjournals.annualreviews.org
by University of Southern California on 02/02/07. For personal use only.
13 Feb 2004 12:59 AR AR209-PU25-04.tex AR209-PU25-04.sgm LaTeX2e(2002/01/18) P1: IBD
TRENDS IN ELDERLY HEALTH 85
TABLE 1 Life expectancy in the United States at birth and
age 65: 1980–2000
a
At birth Age 65
Total Male Female Total Male Female
1980 73.7 70.0 77.4 16.4 14.1 18.3
1990 75.4 71.8 78.8 17.2 15.1 18.9
2000 76.7 73.9 79.4 17.9 16.3 19.2
a
Source: Natl. Cent. Health Stat. (61).
that we will reach the levels of life expectancy currently experienced by exemplar
countries like Japan in the coming decades.
Trends in Disability
Most investigations of trends in health among the old have actually focused on
trends in disability (21, 22, 37, 73). A rationale for this focus is that the small
percentage of people with extreme disability have large expenditures for the use
of nursing homes and other types of long-term care (74). Discussion of trends in
disability is complicated because disability can be defined and measured in many
ways(13,41,77).Most studies of disability among theolddefinedisabilityrelative
to ability to live independently and take care of one’s own personal needs. The
most severe disability is generally defined as inability to provide self-care, and
this is measured by the inability to perform what are known as activities of daily
living (ADLs). These include eating, bathing, dressing, toileting, transferring from
bed and chairs, and sometimes walking around the house. Somewhat less-severe
disability is indicated by the inability to perform or difficulty in performing instru-
mental activities of daily living (IADLs), which often include doing housework,
shopping, preparing meals, using the telephone, managing medications, managing
money, or using transportation. Although the use of these definitions of disabil-
ity is generally limited to the elderly, there are indicators of less-severe disability
that are used at all ages, including the elderly. These include an inability to work,
keep house, or to engage in any activities thought to be part of one’s normal
routine.
The earliest studies of disability trends addressed change in the less-severe type
of disability in the late 1960s and 1970s. The general conclusion of these studies
was that disability did not decrease in this period in the United States (19, 42, 75,
84). Although mild disability appears to have increased during these years, severe
disability did not change. These findings for the United States were similar to those
for a number of other countries: Canada (82), Great Britain (2, 66), Japan (66),
and Australia (54).
Most studies of the period from 1980 to the present have found some decline
in disability among the older population (9, 49). Freedman et al. (30) provide a
Annu. Rev. Public. Health. 2004.25:79-98. Downloaded from arjournals.annualreviews.org
by University of Southern California on 02/02/07. For personal use only.
13 Feb 2004 12:59 AR AR209-PU25-04.tex AR209-PU25-04.sgm LaTeX2e(2002/01/18) P1: IBD
86 CRIMMINS
synthesis of results from seven recent studies of trends in disability (20, 50, 52, 71,
80). Although the studies differ in population coverage, sample design, method
and periodicity of measurement, use of proxies, and treatment of nonresponse and
missing data, the authors conclude that most analyses using data from the post-
1980 period show declines in the percentage with moderate disability and IADL
disability. These declines have been shown to vary by gender (18, 47) and level of
education (18); and they also differ between the young-old and the old-old (19).
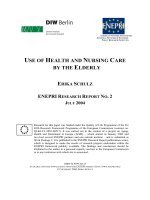
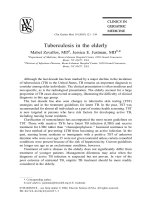
Generally, there is more improvement in less-severe disability. Figure 3 provides
a simple graphical presentation of the amount of change in IADL functioning
duringa recentseven-yearperiodfromtheMedicareBeneficiarySurvey(MCBS),a
longitudinalstudy oftheentireMedicarepopulation,includingthoseininstitutions.
There is, for example, a clear decline even during this short period in the percent
of the older population reporting difficulty doing heavy housework and shopping.
Declines are smaller but significant in the activities with lower levels of disability,
such as preparing meals and using the telephone.
Figure 3 Percentage with difficulties in performing IADLs, Medicare ben-
eficiaries, 65+, 1992–1998 (58).
Annu. Rev. Public. Health. 2004.25:79-98. Downloaded from arjournals.annualreviews.org
by University of Southern California on 02/02/07. For personal use only.
13 Feb 2004 12:59 AR AR209-PU25-04.tex AR209-PU25-04.sgm LaTeX2e(2002/01/18) P1: IBD
TRENDS IN ELDERLY HEALTH 87
Trends in needing help with such activities as housework or shopping may be
due to changes inthephysicalabilitiesoftheolder population, but theymayalsobe
relatedtothe availabilityofhelp in thehouse,either familialorpaid, theavailability
of appliances, and the accessibility of transportation (1, 12). However, causes of
trends in IADL functioning have not been apportioned to reasons residing in the
person and reasons outside the person.
The trends in what is termed ADL disability have not been nearly as consistent
as those in IADL disability (31). Conflicting evidence has been provided by a
number of researchers (18, 20, 47, 52, 71, 80). To help clarify trends in ADL
ability and see if any consensus could be achieved with reexamination of multiple
data sets, the National Institute on Aging convened a 12-person working group on
this topic in August 2002. This group examined a variety of definitions of ADL
disability from five surveys and concluded that ADL disability has been reduced
beginning at some time in the 1990s (30). There is no clear decline before that
time in any of the surveys.
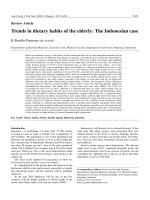
TheMCBSis oneof thesurveysshowingthe strongestdeclinesduring the1990s
in ADL difficulty. For most ADL tasks, there were reductions in the percentage of
persons with difficulty performing the task (Figure 4).
Trends in Physical Functioning
Declines in physical functioning problems throughout the 1980s and 1990s have
also been evaluated in a number of studies (19, 32–34, 47) and synthesized in
Freedman et al. (35). These studies have found improvements fairly consistently in
functioningabilityasindicatedby abilityto lift,carry,walkdistances,stoop,etc.As
anexample,shown inFigure5aredeclines inthepercentage ofthe olderpopulation
with difficulty performing a number of indicators of physical functioning reported
in the MCBS during the 1990s. The percentage of those above age 65 having
difficulty performing specified functions reflecting both upper- and lower-body
strength and mobility generally decreased during the seven years, with stooping
being the exception to this trend.
Trends in Disease Prevalence and Incidence
Most analysts report increases in disease prevalence in recent decades. For the
older population, Cutler & Richardson (23) report prevalence increases between
1970 and 1990 in arthritis, some cancers, cardiovascular disease, diabetes, hearing
problems, and orthopedic problems; only visual impairments decreased, whereas
the prevalence of paralysis remained the same.
Crimmins & Saito (17) report a higher prevalence in the 1990s than the 1980s
of many diseases in the population age 70 and above, particularly heart disease
and cancer (See Table 2). Manton et al. (53) found that the prevalence of some
conditions decreased among older persons from the 1980s to the 1990s (arthritis,
circulatory and cerebrovascular conditions), whereas others increased (pneumo-
nia, bronchitis, broken hips, and diabetes). Because their results report disease
Annu. Rev. Public. Health. 2004.25:79-98. Downloaded from arjournals.annualreviews.org
by University of Southern California on 02/02/07. For personal use only.
13 Feb 2004 12:59 AR AR209-PU25-04.tex AR209-PU25-04.sgm LaTeX2e(2002/01/18) P1: IBD
88 CRIMMINS
Figure 4 Percentage with difficulty performing ADLs, Medicare beneficia-
ries, 65+, 1992–1998 (58).
presence controlling for disability status, it is hard to compare them with other
reports.
Mortality from heart disease rose in the first few decades of this century and
began decreasing in the 1960s (25). Decreases in heart disease mortality since
the 1960s are the most important cause of the overall mortality decline at older
ages since 1968. However, a number of analysts report that the prevalence of
heart disease rose through the 1980s as death rates among those with heart disease
decreased(17,25,39). Cutler&Richardson(23) estimatefromtheNational Health
Interview Survey that the prevalence of heart disease increased by 2.2% annually
for the older population during the 1970-to-1990 period and that this estimate
is consistent with estimates from several major community studies such as the
Framingham Heart Study, the Minnesota Heart Survey, and the Rochester Heart
Study. The explanationforarising prevalence of heart diseaseisthattherehasbeen
Annu. Rev. Public. Health. 2004.25:79-98. Downloaded from arjournals.annualreviews.org
by University of Southern California on 02/02/07. For personal use only.
13 Feb 2004 12:59 AR AR209-PU25-04.tex AR209-PU25-04.sgm LaTeX2e(2002/01/18) P1: IBD
TRENDS IN ELDERLY HEALTH 89
Figure 5 Percentage with difficulty in physical functioning, Medicare ben-
eficiaries, 65+, 1992–1998 (58).
a greater decline incardiovascularmortalitythanin the incidence of cardiovascular
disease, which results in more persons with heart disease in the population. This
pattern has been confirmed in community studies where incidence can be tracked
(8, 24, 40, 55, 57).
Stroke is a vascular disease for which mortality and morbidity are relatively
well-documented because most stroke victims are admitted to hospitals. Trends in
stroke mortality, incidence, and prevalence are somewhat similar to those for other
cardiovascular conditions. Stroke mortality has been decreasing since the 1960s,
but without a consistent decrease in stroke incidence. Stroke incidence has even
been reported to have been higher in the 1980s than during the 1970s, and there
was no sustained decline in incidence during the 1990s (7, 56, 72).
Personssuffering from cardiovasculardisease andstroketend tobeless disabled
thaninthepast.Personswithcardiovascularandcerebrovascularconditionsintheir
50s and 60s were less likely to be disabled in the mid 1990s than they were in
the mid 1980s (16). Women above age 70 with heart disease or a stroke had less
Annu. Rev. Public. Health. 2004.25:79-98. Downloaded from arjournals.annualreviews.org
by University of Southern California on 02/02/07. For personal use only.
13 Feb 2004 12:59 AR AR209-PU25-04.tex AR209-PU25-04.sgm LaTeX2e(2002/01/18) P1: IBD
90 CRIMMINS
TABLE 2 Estimated probability of having specified disease at age 70: 1984
and 1994 U.S. noninstitutionalized population
Males Females
1984 1994 1984 1994
Mortal diseases Heart disease .19 .25 .12 .16
Hypertension .40 .43 .49 .47
Stroke .07 .09 — —
Cancer .12 .21 .11 .16
Diabetes .11 .14 .12 .13
Morbid conditions Arthritis .44 .49 .59 .62
Osteoporosis .01 .01 .05 .12
Broken hip ————
Glaucoma .04 .06 .05 .08
Impairments Cataracts .13 .16 .21 .24
Blindness — —
Hearing trouble
∗
————
Dizziness ————
—No significant change at .05 level.
∗
Hearing trouble includes deafness in one or both ears and other trouble hearing with one or both ears.
Source: Crimmins & Saito (17).
functioning loss and IADL disability in the mid 1990s than in the mid 1980s (17).
Older women with many other conditions also reported less disability in the 1990s
than the 1980s: arthritis, cancer, osteoporosis, cataracts, and hearing loss (17).
Younger persons—50 to 69—also report less arthritis and less disability linked to
the arthritis (16).
Among those above age 70, the average number of diseases that each person
reports has increased in recent years (17). This increase is because people have
survived a number of diseases that once would have been fatal, and they have
lived to acquire additional conditions, both potentially fatal and nonfatal, such as
arthritis. Thus, older people have more diseases, but less disability, than in the past.
Inclusion of indicators of cognitive functioning in nationally representative sur-
veys of the older population has allowed Freedman and colleagues (29) to estimate
change in the prevalence of cognitive impairment during a five-year period during
the mid 1990s. They estimate very significant reduction in this disabling condition.
Further replication of such results will be important to document this trend.
Trends in Risk Factors
Much has been written recently about the increase in weight and obesity as an
adverse trend in health over the past two decades (26, 27, 31). Older persons, like
those of other ages, are more likely to be overweight and obese now than in the
past. In the past two decades the percentage of obese has increased by about 0.5%
Annu. Rev. Public. Health. 2004.25:79-98. Downloaded from arjournals.annualreviews.org
by University of Southern California on 02/02/07. For personal use only.
13 Feb 2004 12:59 AR AR209-PU25-04.tex AR209-PU25-04.sgm LaTeX2e(2002/01/18) P1: IBD
TRENDS IN ELDERLY HEALTH 91
per year (59). On the other hand, the percentage of those age 65 and above who are
current smokers has declined by about 3% over the same period, which results in
about 12% current smokers (59). Trends in these two major behavioral risk factors
thus have moved in opposite directions.
There are a number of well-recognized indicators of biological risk for car-
diovascular disease, diabetes, and death for which change over some period of
time can be determined from the U.S. National Health and Nutrition Examination
Surveys (NHANES). Collection of some measures began as early as the 1960s,
and some are not available until the 1980s. NHANES data show that the percent-
age of the older population with high cholesterol has decreased since the 1960s,
somewhat faster for women than men (60). Examination of recent change shows
a reduction in average total cholesterol during the 1990s for the older population
(Table 2). Since the 1960s, at least for those ages 65–74, the percentage with high
blood pressure has decreased, partly because more people are using antihyper-
tensives and have controlled high blood pressure (60). On the other hand, during
the 1990s, for the whole older population, average diastolic blood pressure was
reduced, whereas systolic blood pressure increased significantly. Although only a
short period is represented in Table 3, there are significant decreases in average
levels of fasting triglycerides. On the other hand, there is no change in average
glycated hemoglobin. Thus, the evidence of change in biological risk for the older
population in the past decade is mixed.
Trends in Self-Reported Health
People’s assessments of their own health can be considered a summary indicator
related to trends in all dimensions of health. Survey respondents include what they
knowabout their ownhealth(diseases,risk factors,functioningloss, and disability)
in their reported self-assessments (46). Measures of self-reported health have been
collected fairly regularly during the 1980s and 1990s from the noninstitutional
population. Consistent declines have been seen since 1982 in the percentage of
TABLE 3 Average levels of specified biological risk factors: 65+ noninstitutionalized
population, 1988–1994 and 1999–2000
Biological risk factor 1988–1994 1999–2000 Sig. T T-Test Change
Diastolic blood pressure 71.5 69.8
∗
Better
Systolic blood pressure 140.0 143.0
∗
Worse
Total cholesterol 222.0 215.5
∗
Better
Fasting triglycerides 157.9 154.8 N.S. No change
Glycated hemoglobin 5.8 5.8 N.S. No change
Range of N 3,801–4,343 1,090–1,157
Source: Individual data from NHANES III and NHANES 1999–2000.
∗
Significant at 0.05 level or below.
Annu. Rev. Public. Health. 2004.25:79-98. Downloaded from arjournals.annualreviews.org
by University of Southern California on 02/02/07. For personal use only.
13 Feb 2004 12:59 AR AR209-PU25-04.tex AR209-PU25-04.sgm LaTeX2e(2002/01/18) P1: IBD
92 CRIMMINS
Figure 6 Self-reported health, 65+ (age-adjusted), noninstitutionalized
population, 1982–1999 (59).
the older population characterizing their health as fair or poor. During the 1980s
there was some increase in the percentage of the population reporting excellent
and very good health, but continued improvement was not observed in the 1990s
(Figure 6).
Trends in Measures that Combine Mortality and Morbidity
In the past two decades a number of investigators have attempted to combine mea-
sures of mortality and morbidity in order to address issues of whether Americans
are living longer, healthy lives, as well as just longer lives. In general, a life-table
approach is used to divide increases in years lived into healthy and unhealthy
years. These measures have the same useful characteristics as life-table measures
based only on mortality. They can be compared across time and place, and they
summarize a large amount of age-specific data. Because indicators of disability
are the most frequently collected measures in surveys, they have been used most
frequently to examine change overtime. This approach has shown that the increase
in life expectancy in the 1970s was concentrated in disabled years, but longer life
in the 1980s was concentrated in nondisabled years (19). As trends in disability
have been similar across countries, these changes in healthy and unhealthy life ex-
pectancycharacterizenot onlytheUnited Statesbut alsoCanada,France, andGreat
Annu. Rev. Public. Health. 2004.25:79-98. Downloaded from arjournals.annualreviews.org
by University of Southern California on 02/02/07. For personal use only.
13 Feb 2004 12:59 AR AR209-PU25-04.tex AR209-PU25-04.sgm LaTeX2e(2002/01/18) P1: IBD
TRENDS IN ELDERLY HEALTH 93
Britain (3, 69). Although most of this work on trends in healthy life has been based
on disability, other dimensions could be used or combined in the calculations.
CONCLUSIONS
The general picture is that older people of today are healthier than older people
of two decades ago. There have been improvements in most dimensions of health.
People live longer and have fewer disabilities, have less functioning loss, and
report themselves to be in better health. Over time there has been some reduction
in risk from smoking and a lowering of cholesterol and average triglyceride levels.
However, weight increase has been notable during this period. Because people live
longer, a greater percentage of people have some specific common diseases, and,
on average, older people live with more diseases. The decade of the 1990s was not
one of improvement in all risk factors.
The confusion that resulted from attempts to synthesize early studies of trends
in health is linked to the fact that not all dimensions of health have changed in the
same directionatthesametime. A number of theimprovementsinhealthdiscussed
here werenotnoted until the 1980sor1990s. In addition, forsomeindicators trends
have differed by age within the older population, with more improvement for those
in their 60s.
Therehavebeenfewsystematicexplanationsofobservedtrends inhealthamong
the older population (16, 22, 33, 51). Certainly, improved treatment and diagnosis
have led to an increased life expectancy for those with a disease, as well as a
delay in the progression of disease to disability, but there are also strong cohort
factors that are likely to have played a role in some of the improvements in health.
Education has increased markedly in recent years in the older population. The
compositional changeamongthe old toahigherlifelong socioeconomic statusmay
have important implications for reducing old age mortality. Further, recent older
cohorts had healthier younger lives than previous cohorts owing to the reduction in
infectious disease, which fueled the long-term mortality decline up to the middle
of the twentieth century. Further work on period and cohort factors that explain
trends is an important part of the research agenda.
Recent trends need to be put into a longer-term perspective. The assault on the
most common causes of old age mortality by public health and medical personnel
was only begun in the 1960s after the elimination of deaths from most infectious
diseases in the first half of the twentieth century. In an assault on new diseases, the
usual biomedical approach is to begin at the end of the disease process and save
people who have the disease from death. We learned more quickly how to prolong
the lives of those with diseases such as heart disease through treatment than how
to promote effective prevention and to diagnose disease earlier.
There appears to have been a period of lengthening life expectancy but dete-
riorating health in the 1970s. As prevention delayed the onset of disease among
younger cohorts and treatment delayed the progression among older cohorts, we
experienced the decade of the 1980s, when health improved by some measures for
Annu. Rev. Public. Health. 2004.25:79-98. Downloaded from arjournals.annualreviews.org
by University of Southern California on 02/02/07. For personal use only.
13 Feb 2004 12:59 AR AR209-PU25-04.tex AR209-PU25-04.sgm LaTeX2e(2002/01/18) P1: IBD
94 CRIMMINS
the older population. For those who could be regarded as the young old, health ap-
pears to have improved even more. In the 1990s, health improved by all indicators
except disease prevalence and some indicators of risk. In this period presence of
disease is not as closely linked to debilitation as it was a decade earlier. Thus, the
most recent decade was generally one of improving health. The key to continued
improvement in health is to delay the onset of risk factors, disease, and disability
in older-aged individuals. However, the complex process of health change may
result in future periods when population health appears to have deteriorated and
years when it appears to have improved, depending on which phases of the disease
and disability process are changing most rapidly.
ACKNOWLEDGMENT
Support for this research was provided by NIA Grant P30 AG17265.
The Annual Review of Public Health is online at
LITERATURE CITED
1. Agree EM, Freedman VA. 2000. Incorpo-
rating assistive devices into long term care
arrangements: analysis of the second sup-
plement onaging . J. AgingHealth 12:426–
50
2. Bebbington AC. 1984. The expectation
of life without disability in England and
Wales. Soc. Sci. Med. 27:321–26
3. Bebbington AC. 1991. The expectation
of life without disability in England and
Wales: 1976–88. Popul. Trends 66:26–29
4. Bone MR, Bebbington AC, Jagger C,
Morgan K, Nicolaas G. 1995. Health
Expectancy and its Uses. London: Her
Majesty’s Stat. Off.
5. Bonneux L, Barendregt JJ, Meeter K, Bon-
sel G, van der Mass PJ. 1994. Estimating
clinical morbidity due to ischemic heart
disease and congestive heart failure. Am.
J. Public Health 84:20–28
6. Deleted in proof
7. Brown RD, Whisnant JP, Sicks JD,
O’Fallon WM, Wiebers DO. 1996. Stroke
incidence, prevalence, and survival: secu-
lar trends inRochester, Minnesota,through
1989. Stroke 27:373–80
8. Burke GL, Sprafka JM, Folsom AR, Luep-
ker RV, Norsted SW, Blackburn H. 1989.
Trends in CHD mortality, morbidity, and
risk factor levels from 1960 to 1986: The
Minnesota Heart Survey. Int. J. Epidemiol.
18(Suppl. 1):S73–81
9. Chen J,MillarWJ.2000.Are recentcohorts
healthier than their predecessors? Health
Rep. 11:9–23
10. Crimmins E. 1981. The changing pattern
ofAmericanmortalitydecline, 1940–1977,
and its implications for the future. Popul.
Dev. Rev. 7:229–54
11. Crimmins EM. 1996. Mixed trends in
population health among older adults. J.
Gerontol. B Psychol. Sci. Soc. Sci. 51:
S223–25
12. Crimmins EM. 1997. Trends in mortal-
ity, morbidity, and disability: What should
we expect for the future of our ag-
ing population? In International Popula-
tion Conference: Beijing, 1997, 1:317–
25. Liege, Belgium: Int. Union Sci. Study
Popul.
13. Crimmins EM. 1998. Is disability declin-
ing among the elderly? Defining disability
Annu. Rev. Public. Health. 2004.25:79-98. Downloaded from arjournals.annualreviews.org
by University of Southern California on 02/02/07. For personal use only.
13 Feb 2004 12:59 AR AR209-PU25-04.tex AR209-PU25-04.sgm LaTeX2e(2002/01/18) P1: IBD
TRENDS IN ELDERLY HEALTH 95
and examining trends. Crit. Issues in Aging
2:10–11
14. Crimmins E, Hayward M, Saito Y. 1994.
Changingmortalityandmorbidity ratesand
the health status and life expectancy of
the olderpopulation. Demography31:159–
75
15. Crimmins EM, Ingegneri D. 1993. Trends
in health among the American popula-
tion. In Demography and Retirement: The
Twenty First Century, ed. AM Rappaport,
SJ Schieber, pp. 225–314. Westport, CT:
Praeger
16. Crimmins EM, Reynolds S, Saito Y. 1999.
Trends in health and ability to work
amongthe olderworking-agepopulation.J.
Gerontol. B Psychol. Sci. Soc. Sci. 54:S1–
10
17. Crimmins EM,SaitoY.2000.Changeinthe
prevalence of diseases among older Amer-
icans: 1984–1994. Demogr. Res. 3 (on-
line):Artic. 9, ographic-
research.org
18. Crimmins EM, Saito Y. 2001. Trends in
disability-free lifeexpectancyin theUnited
States, 1970–1990: gender, racial, and ed-
ucational differences. Soc. Sci. Med. 52:
1629–41
19. Crimmins EM, Saito Y, Ingegneri D. 1997.
Trends in disability-free life expectancy
in the U.S.: 1970–1990. Popul. Dev. Rev.
23:555–72
20. Crimmins EM, Saito Y, Reynolds SL.
1997. Further evidence on recent trends in
the prevalence and incidence of disability
among older Americans from two sources:
The LSOA and the NHIS. J. Gerontol. B
Psychol. Sci. Soc. Sci. 52:S59–71
21. Cutler DM. 2001. Declining disability
among the elderly. Health Aff. (Millwood)
20:11–27
22. Cutler DM. 2001. The reduction in disabil-
ityamongtheelderly.Proc.Natl. Acad.Sci.
USA 98:6546–47
23. Cutler DM, Richardson E. 1997. Measur-
ing the health of the U.S. population. In
Brookings Papers on Economic Activity:
Microeconomics, ed. M Baily, P Reiss,
C Winston, pp. 214–82. Washington, DC:
Brookings Inst.
24. Demirovic J, Blackburn H, McGovern P,
Sprafka JM, Doliszny K. 1993. Sex differ-
ences in coronary heart disease mortality
trends:The MinnesotaHeartSurvey,1970–
1988. Epidemiology 4:79–82
25. Feinleib M.1995. Trends inheart diseasein
the United States. Am.J. Med. Sci. 310:S8–
14
26. Flegal KM, Carroll MD, Kuczmarski RJ,
Johnson CL.1998. Overweight andobesity
in the United States: prevalence and trends,
1960–1994. Int. J. Obes. 22:39–47
27. Flegal KM, Carroll MD, Ogden CL, John-
sonCL. 2002.Prevalenceand trendsinobe-
sity among US adults, 1999–2000. JAMA
288:1723–27
28. Deleted in proof
29. Freedman VA, Aykan H, Martin LG. 2002.
Another look at aggregate changes in se-
vere cognitive impairment: cumulative ef-
fects of three survey design issues. J.
Gerontol. B Psychol. Sci. Soc. Sci. 57:
S126–31
30. Freedman VA, Crimmins EM, Schoeni RF,
Spillman B, Aykan H, et al. 2003. Re-
solving inconsistencies in old-age disabil-
ity trends: report from a technical work-
ing group. Presented at Annu. Meet. Popul.
Assoc. America, 68th, Minneapolis
31. Freedman DS, Khan LK, Serdula MK,
Galuska DA, Dietz WH. 2002. Trends and
correlates of class 3 obesity in the United
States from 1990 through 2000. JAMA
288:1758–61
32. Freedman VA, Martin LG. 1998. Under-
standing trends in functional limitations
among older Americans. Am. J. Public
Health 88:1457–62
33. Freedman VA, Martin LG. 1999. The role
of education in explaining and forecast-
ing trends in functional limitations among
older Americans. Demography 36:461–73
34. Freedman VA, Martin LG. 2000. Contri-
bution of chronic conditions to aggregate
changesin old-agefunctioning.Am. J.Pub-
lic Health 90:1755–60
Annu. Rev. Public. Health. 2004.25:79-98. Downloaded from arjournals.annualreviews.org
by University of Southern California on 02/02/07. For personal use only.
13 Feb 2004 12:59 AR AR209-PU25-04.tex AR209-PU25-04.sgm LaTeX2e(2002/01/18) P1: IBD
96 CRIMMINS
35. Freedman VA, Martin LG, Schoeni RF.
2002. Recent trends in disability and func-
tioning among older Americans: a sys-
tematic review of the evidence. JAMA
288:3137–46
36. Fries JF. 1980. Aging,natural death andthe
compression of morbidity. N. Engl. J. Med.
303:130–35
37. Fries JF. 2002. Reducing disability in older
age. JAMA 288:3164
38. Gruenberg EM. 1977. The failures of suc-
cess. Milbank Mem. Fund Q. Health Soc.
55:3–24
39. Haan MN, Selby JV, Rice DP,Quesenberry
CP Jr, Schofield KA, et al. 1996. Trends
incardiovasculardiseaseincidenceandsur-
vival in the elderly.Ann. Epidemiol. 6:348–
56
40. Hunink MG, Goldman L, Tosteson AN,
Mittleman MA, Goldman PA, et al. 1997.
The recent decline in mortality from coro-
nary heart disease. 1980–1990: the effect
of secular trends in risk factors and assess-
ment. JAMA 277:534–42
41. Jette AM. 1994. How measurement tech-
niques influence estimates of disability in
older populations. Soc. Sci. Med. 38:937–
42
42. Kaplan G. 1991. Epidemiologic observa-
tions on the compression of morbidity: ev-
idence from the Alameda County study. J.
Aging Health 3:155–71
43. Lee RD, Carter L. 1992. Modeling and
forecasting the time series of U.S. mortal-
ity. J. Am. Stat. Assoc. 87:659–71
44. Lee RD, Miller T. 2001. Evaluating the
performance of the Lee-Carter method
for forecasting mortality. Demography 38:
537–49
45. Lee R, Skinner J. 1996. Assessing fore-
casts of mortality, health status, and health
costs during baby boomers’ retirement. In
AssessingKnowledge ofRetirementBehav-
ior, ed. C Citro, pp. 195–243. Washington,
DC: Natl. Acad. Sci.
46. Liang J.1986.Self-reportedphysicalhealth
among aged adults. J. Gerontol. B Psychol.
Sci. Soc. Sci. 41:248–60
47. Liao Y, McGee DL, Cao G, Cooper RS.
2001. Recent changes in the health status
of the older U.S. population: findings from
the 1984 and 1994 Supplement on Aging.
J. Am. Geriatr. Soc. 49:443–49
48. Manton KG. 1982. Changing concepts of
morbidity and mortality in the elderly pop-
ulation.MilbankMem. FundQ.HealthSoc.
60:183–244
49. Manton KG, Corder L, Stallard E. 1993.
Estimates of change in chronic disability
and institutional incidence and prevalence
rates in the US elderly population from the
1982, 1984, and 1989 National Long Term
Care Survey. J. Gerontol. B Psychol. Sci.
Soc. Sci. 48:S153–66
50. Manton KG, Corder LS, Stallard E. 1997.
Chronic disability trends in elderly United
States populations: 1982–1994. Proc. Natl.
Acad. Sci. 94:2593–98
51. Manton KG, Corder LS, Stallard E. 1997.
Monitoring changes in the health of the
U.S. elderly population: correlates with
biomedical research and clinical innova-
tions. FASEB J. 11:923–30
52. Manton KG, Gu X. 2001. Changes in
the prevalence of chronic disability in
the United States black and nonblack
populationaboveage65from1982to 1999.
Proc. Natl. Acad. Sci. 98:6354–59
53. Manton KG, Stallard E, Corder L. 1995.
Changes in morbidity and chronic dis-
ability in the U.S. elderly population: ev-
idence from the 1982, 1984, and 1989
National Long Term Care Surveys. J.
Gerontol. B Psychol. Sci. Soc. Sci. 50:
S194–204
54. Mathers CD. 1990. Disability-Free and
Handicap-Free Life Expectancy in Aus-
tralia. Canberra: Aust. Inst. Health
55. McGovern PG, Folsom AR, Sprafka JM,
Burke GL, Doliszny KM, et al. 1992.
Trends in survival of hospitalized myocar-
dial infarction patients between 1970 and
1985: The Minnesota Heart Survey. Circu-
lation 85:172–79
56. McGovern PG, Shahar E, Sprafka JM,
Pankow JS. 1993. The role of stroke
Annu. Rev. Public. Health. 2004.25:79-98. Downloaded from arjournals.annualreviews.org
by University of Southern California on 02/02/07. For personal use only.
13 Feb 2004 12:59 AR AR209-PU25-04.tex AR209-PU25-04.sgm LaTeX2e(2002/01/18) P1: IBD
TRENDS IN ELDERLY HEALTH 97
attack rate and case fatality in the decline
of stroke mortality: The Minnesota Heart
Survey. Ann. Epidemiol. 3:483–87
57. McGovern PG, Pankow JS, Shahar E,
Doliszny KM, Folsom AR, et al. 1996. Re-
cent trends in acute coronary heart disease:
mortality, morbidity, medical care, and risk
factors. N. Engl. J. Med. 334:884–90
58. Natl. Cent. Health Stat. 2002. Data Ware-
house on Trends in Health and Aging:
Data from the Medicare Current Bene-
ficiaries Survey. />agingact.htm
59. Natl. Cent. Health Stat. 2002. Data Ware-
house on Trends in Health and Aging: Data
from the NationalHealth InterviewSurvey.
/>60. Natl. Cent. Health Stat. 2002. Health,
United States, 2002: With Chartbook on
Trends in the Health of Americans. Wash-
ington, DC: Author DHHS Publ. No. 1232
61. Natl. Cent. Health Stat. 2002. Life Ex-
pectancy atBirth, at 65Yearsof Age,and at
75YearsofAge,AccordingtoRaceandSex:
United States, Selected Years 1900–2000.
Washington, DC: Author DHHS Publ. No.
1232
62. Oeppen J, Vaupel JW. 2002. Broken limits
to life expectancy. Science 296:1029–31
63. Olshansky SJ, Carnes BA, Desesquelles A.
2001. Prospects for human longevity. Sci-
ence 291:1491–92
64. Olshansky SJ, Wilkins R. 1998. Policy im-
plications of the measures and trends in
health expectancy: report from Reves 8.
J. Aging Health 10:123–35
65. Pope AM, Tarlov AR, eds.1991.Disability
in America: Toward a National Agenda for
Prevention. Washington, DC: Natl. Acad.
Press
66. Riley JC.1990. The riskof beingsick: mor-
bidity trends in four countries. Popul. Dev.
Rev. 16:403–32
67. Robine JM, Bucquet D, Ritchie K. 1991.
L’esperance de vie sans incapacite, un in-
dicateur de l’evolution des conditions de
sante au cours de temps: vingt ans de cal-
cul. Cahiers Que. Demogr. 20:205–35
68. Robine JM, Jagger C, Mathers CD, Crim-
mins EM, Suzman RM. 2003. Determin-
ingHealth Expectancies.West Sussex,UK:
Wiley. 428 pp.
69. Robine JM, Mormiche P, Sermet C. 1998.
Examination of the causes and mecha-
nisms of the increase in disability-free
life expectancy. J. Aging Health 10:171–
91
70. Rogers R, Rogers A, Belanger A. 1990.
Longer life but worse health? Measure-
ment anddynamics. Gerontologist 30:640–
49
71. Schoeni R,FreedmanVA,Wallace R.2001.
Persistent, consistent, widespread, and ro-
bust? Another look at recent trends in old-
age disability. J. Gerontol. B Psychol. Sci.
Soc. Sci. 56:S206–18
72. Shahar E, McGovern PG, Pankow JS,
Doliszny KM, Smith MA, et al. 1997.
Stroke rates during the 1980s: The Min-
nesota Stroke Survey. Stroke 28:275–
79
73. Singer BH, Manton KG. 1998. The effects
of health changes on projections of health
service needs for the elderly population of
the United States. Proc. Natl. Acad. Sci.
USA 95:15618–22
74. Trupin L, Rice DP, Max W. 1995. Medi-
cal Expenditures for People With Disabili-
ties intheUnitedStates,1987. Washington,
DC: U.S. Dep. Educ., Natl. Inst. Disabil.
Rehabil. Res.
75. VerbruggeL. 1984. Longerlife but worsen-
ing health? Trends in health and mortality
of middle-aged and older persons. Milbank
Mem. Q. 62:475–519
76. Verbrugge LM. 1989. Recent, present, and
future health of American adults. Annu.
Rev. Public Health 10:333–61
77. Verbrugge LM. 1990. The iceberg of dis-
ability. In The Legacy of Longevity: Health
and Health Care in Late Life, ed. S. Stahl,
pp. 55–75. Newbury Park, CA: Sage
78. Verbrugge LM, Jette A. 1994. The disable-
ment process. Soc. Sci. Med. 39:1–14
79. Waidmann T, Bound J, Schoenbaum M.
1995. The illusion of failure: trends in the
Annu. Rev. Public. Health. 2004.25:79-98. Downloaded from arjournals.annualreviews.org
by University of Southern California on 02/02/07. For personal use only.
13 Feb 2004 12:59 AR AR209-PU25-04.tex AR209-PU25-04.sgm LaTeX2e(2002/01/18) P1: IBD
98 CRIMMINS
self-reportedhealth oftheU.S. elderly.Mil-
bank Q. 73:253–87
80. Waidmann T,LiuK.2000. Disabilitytrends
among the elderly and implications for the
future. J. Gerontol. BPsychol. Sci.Soc. Sci.
55:S298–307
81. White KM. 2002. Longevity advances in
high-income countries, 1955–96. Popul.
Dev. Rev. 28:59–76
82. Wilkins R, Adams OB. 1983. Health ex-
pectancy in Canada, late 1970s: demo-
graphic, regional and social dimensions.
Am. J. Public Health 73:1073–80
83. Wilmoth JR. 1997. In search of limits. In
Between Zeus and the Salmon: The Biode-
mography of Longevity, ed. KW Wachter,
CE Finch, 3:38–64. Washington, DC: Natl.
Acad. Press
84. Ycas MA. 1987. Recent trends in health
near the age of retirement: new findings
from the health interview survey. Soc. Se-
cur. Bull. 50:5–30
Annu. Rev. Public. Health. 2004.25:79-98. Downloaded from arjournals.annualreviews.org
by University of Southern California on 02/02/07. For personal use only.
P1: FRK
February 20, 2004 14:36 Annual Reviews AR209-FM
Annual Review of Public Health
Volume 25, 2004
CONTENTS
PERSPECTIVES
The Third Revolution in Health, Lester Breslow xiii
EPIDEMIOLOGY AND BIOSTATISTICS
Can Dementia Be Prevented? Brain Aging in a Population-Based Context,
Mary N. Haan and Robert Wallace 1
Public Health Surveillance of Low-Frequency Populations,
Elena M. Andresen, Paula H. Diehr, and Douglas A. Luke 25
Statistical and Substantive Inferences in Public Health: Issues in the
Application of Multilevel Models, Jeffrey B. Bingenheimer
and Stephen W. Raudenbush 53
Trends in the Health of the Elderly, Eileen M. Crimmins 79
What Do We Do with Missing Data? Some Options for Analysis
of Incomplete Data, Trivellore E. Raghunathan 99
ENVIRONMENTAL AND OCCUPATIONAL HEALTH
Emission Trading and Public Health, Alexander E. Farrell
and Lester B. Lave 119
Genetic Testing in the Workplace: Ethical, Legal, and Social Implications,
Paul W. Brandt-Rauf and Sherry I. Brandt-Rauf 139
Health Effects of Chronic Pesticide Exposure: Cancer and Neurotoxicity,
Michael C.R. Alavanja, Jane A. Hoppin, and Freya Kamel 155
Implications of the Precautionary Principle for Primary Prevention
and Research, Philippe Grandjean 199
Issues of Agricultural Safety and Health, Arthur L. Frank,
Robert McKnight, Steven R. Kirkhorn, and Paul Gunderson 225
Time-Series Studies of Particulate Matter, Michelle L. Bell,
Jonathan Samet, and Francesca Dominici 247
PUBLIC HEALTH PRACTICE
Developing and Using the Guide to Community Preventive Services:
Lessons Learned About Evidence-Based Public Health, Peter A. Briss,
Ross C. Brownson, Jonathan E. Fielding, and Stephanie Zaza 281
vii
Annu. Rev. Public. Health. 2004.25:79-98. Downloaded from arjournals.annualreviews.org
by University of Southern California on 02/02/07. For personal use only.
P1: FRK
February 24, 2004 20:39 Annual Reviews AR209-FM
viii CONTENTS
Modeling Infection Transmission, Jim Koopman 303
The Current State of Public Health in China, Liming Lee 327
The Public Health Workforce, Hugh Tilson and Kristine M. Gebbie 341
Lessons Learned from Public Health Mass Media Campaigns: Marketing
Health in a Crowded Media World, Whitney Randolph and K. Viswanath 419
SOCIAL ENVIRONMENT AND BEHAVIOR
Assuring the Health of Immigrants: What the Leading Health Indicators
Tell Us, Namratha R. Kandula, Margaret Kersey, and Nicole Lurie 357
Harm Reduction Approaches to Reducing Tobacco-Related Mortality,
Dorothy K. Hatsukami, Jack E. Henningfield, and Michael Kotlyar 377
Housing and Public Health, Mary Shaw 397
Lessons Learned from Public Health Mass Media Campaigns: Marketing
Health in a Crowded Media World, Whitney Randolph and K. Viswanath 419
The Role of Culture in Health Communication, Matthew W. Kreuter
and Stephanie M. McClure 439
HEALTH SERVICES
Economic Implications of Increased Longevity in the United States,
Dorothy P. Rice and Norman Fineman 457
International Differences in Drug Prices, Judith L. Wagner
and Elizabeth McCarthy 475
Physician Gender and Patient-Centered Communication: A Critical
Review of Empirical Research, Debra L. Roter and Judith A. Hall 497
The Direct Care Worker: The Third Rail of Home Care Policy, Robyn Stone 521
Developing and Using the Guide to Community Preventive Services:
Lessons Learned About Evidence-Based Public Health, Peter A. Briss,
Ross C. Brownson, Jonathan E. Fielding, and Stephanie Zaza 281
INDEXES
Subject Index 539
Cumulative Index of Contributing Authors, Volumes 16–25 577
Cumulative Index of Chapter Titles, Volumes 16–25 581
ERRATA
An online log of corrections to Annual Review of Public Health
chapters may be found at />Annu. Rev. Public. Health. 2004.25:79-98. Downloaded from arjournals.annualreviews.org
by University of Southern California on 02/02/07. For personal use only.