Historical and current predictors of self-reported health status among elderly persons in Barbados pot
Bạn đang xem bản rút gọn của tài liệu. Xem và tải ngay bản đầy đủ của tài liệu tại đây (99.01 KB, 11 trang )
342 Rev Panam Salud Publica/Pan Am J Public Health 17(5/6), 2005
Historical and current predictors of
self-reported health status among elderly
persons in Barbados
Ian R. Hambleton,
1
Kadene Clarke,
1
Hedy L. Broome,
2
Henry S. Fraser,
2,3
Farley Brathwaite,
4
and Anselm J. Hennis
2,3
Objective. To understand the relative contribution of past events and of current experi-
ences as determinants of health status among the elderly in the Caribbean nation of Barbados,
in order to help develop timely public health interventions for that population.
Methods. The information for this prevalence study was collected in Barbados between De-
cember 1999 and June 2000 as part of the “SABE project,” a multicenter survey in seven
urban areas of Latin America and the Caribbean that evaluated determinants of health and
well-being in elderly populations (persons 60 and older). We used ordinal logistic regression
to model determinants of self-reported health status, and we assessed the relative contribution
of historical socioeconomic indicators and of three current modifiable predictor groups (current
socioeconomic indicators, lifestyle risk factors, and disease indicators), using simple measures
of association and model fit.
Results. Historical determinants of health status accounted for 5.2% of the variation in re-
ported health status, and this was reduced to 2.0% when mediating current experiences were
considered. Current socioeconomic indicators accounted for 4.1% of the variation in reported
health status, lifestyle risk factors for 7.1%, and current disease indicators for 33.5%.
Conclusions. Past socioeconomic experience influenced self-reported health status in elderly
Barbadians. Over half of this influence from past events was mediated through current so-
cioeconomic, lifestyle, and disease experiences. Caring for the sick and reducing lifestyle risk
factors should be important considerations in the support of the current elderly. In addition,
ongoing programs for poverty reduction and increased access to health care and education
should be considered as long-term strategies to improve the health of the future elderly.
Health status, aged, socioeconomic factors, Barbados.
ABSTRACT
The average age of the population in
countries around the world continues
to rise, reflecting the concurrent de-
clines in fertility and adult mortality
(1). Population aging represents a pub-
lic health success story, but it simulta-
Key words
Investigación original / Original research
Hambleton IR, Clarke K, Broome HL, Fraser HS, Brathwaite F, Hennis AJ. Historical and current pre-
dictors of self-reported health status among elderly persons in Barbados. Rev Panam Salud Publica.
2005;17(5/6):342–52.
Suggested citation
1
University of the West Indies, Tropical Medicine
Research Institute, Kingston, Jamaica.
2
University of the West Indies, Tropical Medicine
Research Institute, Chronic Disease Research Cen-
tre, Bridgetown, Barbados. Send correspondence
to: Anselm Hennis, Chronic Disease Research Cen-
tre, Jemmott’s Lane, Bridgetown, Barbados; tele-
phone: 246 426 6416; fax: 246 426 8406; e-mail:
3
University of the West Indies, Cave Hill Campus,
School of Clinical Medicine and Research, Bridge-
town, Barbados.
4
University of the West Indies, Cave Hill Campus,
Faculty of Social Sciences, Bridgetown, Barbados.
neously creates new economic and so-
cial challenges. The elderly experience
disproportionate levels of chronic dis-
ease and disability, which reduces their
quality of life and increases the demand
for health care and social services. In re-
cent decades the speed of population
aging in many less-developed coun-
tries has been dramatic (2), and in these
countries this aging is likely to exceed
the wealth accumulation needed to
cope with the increased economic bur-
den on society (3).
Public health programs to meet the
challenges of aging focus on the con-
cept of “active aging” (4), which pro-
motes the optimization of health;
participation of the elderly in the
socioeconomic, cultural, and spiritual
activities of the community; and so-
cial, financial, and physical security as
the central tenets for an improved
quality of life. As one strand of this
public health response, “health” refers
to mental and social well-being as well
as physical aspects (5). Self-reported
health status has been widely used in
censuses, surveys, and observational
studies as a succinct measure that may
encompass these subjective concepts
(6, 7). Determinants of self-reported
health status have been widely studied
(8-10), and this health outcome has
been shown to predict future morbid-
ity and mortality (11–13).
Research should help to inform and
focus public health policy. Until a rela-
tively short time ago, published evi-
dence on the health of the elderly in de-
veloping nations had been lacking.
However, recently completed surveys
now provide a wealth of data on health
and aging in regions with rapidly
aging populations (14). The quantity of
collected information available to the
analyst can be overwhelming, and it is
important that public health questions
be answered using appropriate analy-
sis strategies. Although univariate ex-
amination of possible health predictors
can be insightful, methods to account
for associations between predictors are
generally preferred. However, widely
available automation of variable selec-
tion strategies has led to statistical sig-
nificance becoming synonymous with
practical importance, which is not al-
ways appropriate. Rather than auto-
mated selection of health predictors,
we have developed a conceptual model
of health status predictors that identi-
fies distinct life phases, and we have
examined possible predictors within
this theoretical framework. From a
public health perspective, we must be
certain that changes in behavior are
possible, and that these changes can
improve health. This question is partic-
ularly relevant for persons who are
now elderly. They have experienced
the majority of their life course, and
their current health may be decisively
informed by past events.
In this study we investigated se-
lected social and clinical determinants
of self-reported health status among
elderly persons in the Caribbean na-
tion of Barbados. Below we first pre-
sent our conceptual model of health
status predictors, and then we exam-
ine the relative contribution of histori-
cal and modifiable factors on self-
perceived health status.
Conceptual model
Many studies have linked socioeco-
nomic indicators with health (15–18).
In addition, the causal order of various
socioeconomic indicators (SEIs) as de-
terminants of health has been dis-
cussed (19, 20), with attention focusing
on education, occupation, and income
as key indicators. Education is gener-
ally experienced first in the life course,
and it influences income through its
direct effect on occupation. In our Bar-
bados sample all three of those indica-
tors were interrelated, with correlation
coefficients ranging from 0.34 to 0.44.
As these simple relationships high-
light, considering each indicator on its
own will ignore interactions with
other factors. These interactions may
in turn reflect pathways through a per-
son’s life course (21).
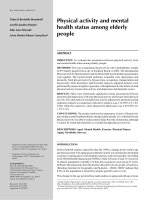
More generally, we might classify
possible predictors of self-reported
health into four distinct groups: one
group of past events (historical SEIs)
and three groups summarizing ongo-
ing experience (lifestyle risk factors,
current SEIs, and disease indicators)
(Figure 1). Historical SEIs refer to so-
cioeconomic experiences from earlier
in the life course. Although these past
experiences may affect health report-
ing through their influence on in-
termediate conditions, as historical
events they cannot directly modify
health status and cannot be modified
by current public health policy. Cur-
rent SEIs reflect current socioeconomic
conditions. Modification is feasible, al-
though in many resource-poor situa-
tions it may be impractical. Current
Rev Panam Salud Publica/Pan Am J Public Health 17(5/6), 2005 343
Hambleton et al. • Predictors of self-reported health status among elderly persons in Barbados Original research
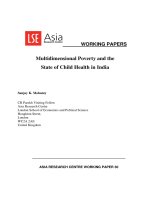
FIGURE 1. Pathways among socioeconomic indicators (SEIs), lifestyle risk factors, and dis-
ease indicators and self-repaorted health, as assessed in study of historical and current
predictors of self-reported health status in elderly persons, Barbados, 1999–2000
Current experience
Past experience
Historical
SEIs
Disease
indicators
Lifestyle
risk factors
Current SEIs
Self-reported
health
Lifestyle Disease Health status
risk factors reflect individual lifestyle
choices and are the most readily al-
tered influences on health. Disease in-
dicators are just one aspect of self-
reported health, but because they
often reflect recent experience they are
likely to be strong determinants of in-
dividuals’ health perceptions.
Proactive public health intervention
to promote the agenda of “active
aging” would focus on readily modifi-
able features of people’s current expe-
rience (lifestyle risk factors and, to
some extent, current SEIs). The success
of such intervention may partly de-
pend on to what extent past experi-
ence shapes individuals’ perceptions
of their current health status.
Aims of this study
Our main aim was to examine the
socioeconomic and lifestyle determi-
nants of self-reported health status
among elderly men and women in
Barbados. In particular, we wanted to
examine the strength of selected deter-
minants from each predictor group,
the strength of associations between
the four predictor groups, and the ex-
tent to which earlier life course effects
on health are mediated through more
recent experiences.
DATA AND METHODS
Data
The Barbados study is part of a
cross-sectional survey evaluating de-
terminants of health and well-being in
Latin America and the Caribbean
(Salud, Bienestar y Envejecimiento en
América Latina y el Caribe (Health, Well-
Being, and Aging in Latin America and
the Caribbean), known as the “SABE
project”) (22). SABE consisted of a
cross-sectional survey of people born
in 1939 or earlier (60 years or older in
1999) from seven cities in Latin Amer-
ica and the Caribbean, including
Bridgetown, Barbados (14). The study
design stipulated a minimum sample
size of 1 500 respondents from each
city. The Bridgetown survey, which
was conducted between December
1999 and June 2000, identified 1 878
eligible persons, and it collected com-
pleted information on 1 508 of them
(an overall response rate of 80%). Re-
sponse varied by age and gender, from
a low of 73% among men between 60
and 64 to a high of 88% among women
aged 85 and over. Weights were ap-
plied to all analyses to account for the
sampling design and nonresponse.
Sixty-five respondents did not pass a
preliminary cognitive test and were as-
signed a proxy respondent to provide
help with questionnaire responses. Be-
cause of the subjective nature of self-
reported health, we excluded these
participants from the current analysis.
Our selection of potential determi-
nants of self-reported health status for
each of the four predictor groups is
presented in Table 1.
Historical socioeconomic indicators
We considered six historical SEIs as
potential predictors of self-reported
health status. We classified education
as elementary, secondary, or higher,
with the third category consisting of
any post-secondary or university train-
ing. We defined occupation as the job
in which a participant worked for the
majority of his or her life, or the most
recent principal employment. We first
classified occupation according to the
International Standard Classification
of Occupations (ISCO-88), which is a
classification system produced by the
International Labor Organization. We
then grouped the occupations into
three broader classifications: profes-
sionals (managers, senior officials, and
professionals), semiprofessionals (tech-
nicians, office workers, and skilled la-
borers), and nonprofessionals (service
and sales workers, farmers, unskilled
workers, and homemakers).
We recorded information on aspects
of the participants’ childhood experi-
ences by asking three questions about
the first 15 years of their life: whether
their economic situation was good,
average, or poor; whether their health
was excellent, good, or poor; and
whether there was a time when they
didn’t have enough to eat and were
hungry. We also asked participants to
list any diseases they had had as a child,
and we used a list of common child-
hood conditions to aid recollection.
344 Rev Panam Salud Publica/Pan Am J Public Health 17(5/6), 2005
Original research Hambleton et al. • Predictors of self-reported health status among elderly persons in Barbados
TABLE 1. Potential determinants of self-reported health status, study of historical and cur-
rent predictors of self-reported health status in elderly persons, Barbados, 1999–2000
Predictor group Individual predictors in each predictor group
Historical socioeconomic indicators
Current socioeconomic indicators
Current lifestyle risk factors
Disease indicators
a
Illnesses included hypertension, diabetes, cancer, chronic lung disease, coronary heart disease, cerebrovascular accident,
and arthritis.
b
Symptoms included chest pain, shortness of breath, back pain, severe fatigue or tiredness, joint problems, persistent swelling
in the feet or ankles, persistent dizziness, persistent headaches, persistent wheezing, cough or phlegm, persistent nausea or
vomiting, and persistent thirst or excessive sweating.
Education, occupation, childhood economic situation,
childhood nutrition, childhood health, number of childhood
diseases
Income, financial means, household crowding, living alone,
currently married, number of people in the household, number
of children living outside household, number of siblings living
outside household, number of other family and friends living
outside household
Body mass index, waist circumference, categories of disease
risk, nutrition, smoking, exercise
Number of illnesses,
a
number of symptoms,
b
Geriatric
Depression Scale score, number of nights in hospital in
4-month period, number of medical contacts in 4-month period
Current socioeconomic indicators
We calculated monthly income as
the sum of the current salary (for em-
ployed individuals) and all other
sources of income such as pensions
and retirement benefits. We recorded
self-reported financial means by asking
participants if they had enough money
to meet daily living expenses. We cal-
culated household room density as the
number of people in a household di-
vided by the number of rooms, exclud-
ing the kitchen and bathroom. Social
networks have been reported as an in-
fluence on health (23, 24). We collected
basic information on social networks
by recording whether the participant
was married, the number of people liv-
ing in the household, the number of
children living outside of the house-
hold, the number of siblings living out-
side of the household, the number of
other family and friends living outside
of the household, and whether the par-
ticipant received assistance from any
institutions in the community (such as
social services, senior citizen’s center,
or church group). Household mem-
bers, children, and siblings did not
need to give or receive assistance in
order to be considered part of the re-
spondent’s social network.
Lifestyle risk factors
To classify adiposity, we used body
mass index (BMI) and waist circumfer-
ence. Using BMI, we defined partici-
pants as normal (BMI < 25 kg/m
2
),
overweight (25 ≤ BMI < 30 kg/m
2
), or
obese (BMI ≥ 30 kg/m
2
). Waist circum-
ference is an approximate index of
intra-abdominal fat mass and total
body fat, and it may be a risk factor for
cardiovascular and other chronic dis-
eases. We classified participants as
high risk for metabolic complications
if they were above recommended
gender-specific thresholds (men ≥ 102
cm and women ≥ 88 cm) (25). We also
calculated an index of disease risk rela-
tive to normal weight and waist
circumference in five categories: nor-
mal, increased, high, very high, and ex-
tremely high (26). We recorded infor-
mation on exercise, smoking, and nu-
trition. We asked participants whether
they had exercised or participated in
vigorous physical activity three or
more times a week over the past 12
months, if they were current or past
smokers, and whether they considered
themselves well nourished.
Disease indicators
For this study we summarized de-
tailed disease information to create
four indicators of current disease sta-
tus: the number of illnesses experi-
enced, the number of disease symp-
toms in the previous 12 months, the
number of nights spent in the hospital
in the previous 4 months, and the
number of times medical care was
sought in the previous 4 months. The
list of illnesses consisted of: high blood
pressure/hypertension, diabetes, ma-
lignant tumor (excluding minor skin
cancers), chronic lung disease, cardiac
disease, stroke, and arthritis. We also
used the 15-item Geriatric Depression
Scale (GDS) to measure depression
(27). During the GDS tabulations we
categorized a GDS score of more than
5 to indicate depression, and during
all modeling we used the quantitative
GDS scores.
Self-reported health status
We rated self-reported health status
on a five-point scale: poor, fair, good,
very good, and excellent. Because of
low responses in the extreme cate-
gories, we modeled self-reported health
status in three categories: poor or fair,
good, and very good or excellent.
Statistical methods
We were interested in the individual
and joint effects of variables from each
predictor group (historical SEIs, cur-
rent SEIs, lifestyle risk factors, disease
indicators) on self-reported health sta-
tus, and we used ordinal logistic re-
gression at all times. This technique is
an extension of logistic regression for
an outcome with three or more or-
dered categories (in our case we used
three categories of improving health
status: poor or fair, good, and very
good or excellent).
We addressed our goals in two
stages. In stage one, we modeled each
of the four predictor groups sepa-
rately. We added statistically impor-
tant terms to each model one at a time,
using a manual stepwise technique,
after adjusting for the confounding ef-
fects of age and gender. The results of
each of the four models are presented
as odds ratios (ORs) with associated
95% confidence intervals (CIs). We ex-
amined the statistical importance of
each additional predictor using a Wald
test, using a lenient model inclusion
criterion of 10% significance. This crite-
rion allowed a number of weakly pre-
dictive terms to contribute to stage two
of the analysis. We assessed the pair-
wise associations between our four
models by obtaining predicted proba-
bilities of self-reported health status,
and correlating these predictions.
In stage two we examined the joint
effect of the four predictor groups by
adding all important predictor terms
into a single model. We built this
model by first including all important
historical SEIs, then adding, in three
steps, all important terms from current
SEIs, from lifestyle risk factors, and
from disease indicators. After each
addition of a predictor group, we
recorded a simple measure of the extra
variation explained by the additional
important terms. We were interested
in how the amount of information ex-
plained by the model changed when
further prediction groups were added.
We used Stata version 8 software for
all analyses (28).
RESULTS
Distribution of historical
socioeconomic indicators
We present the distributions of the
historical SEIs in Table 2. The majority
of the participants reported nonprofes-
sional occupations. There were gender
differences in occupation, with a
Rev Panam Salud Publica/Pan Am J Public Health 17(5/6), 2005 345
Hambleton et al. • Predictors of self-reported health status among elderly persons in Barbados Original research
greater proportion of women classi-
fied as nonprofessionals. Although
men reported a less favorable eco-
nomic and nutritional situation in
childhood, they also reported better
health and fewer diseases.
Distribution of current
socioeconomic indicators
We present the distributions of the
current SEIs in Table 3. Self-reported
income was disclosed by 1 079 partici-
pants (a response rate of 75%). We im-
puted unreported income using an
iterative regression algorithm (29),
using age, gender, financial means, ed-
ucation, and occupation as income
predictors. The imputed income distri-
bution included a larger proportion of
“high-earners,” suggesting that the
well-paid were more reticent about di-
vulging income details. The median
reported annual income of US$ 3 132
(interquartile range of US$ 2 088 to
US$ 6 096) was less than the gross na-
tional income per capita of US$ 9 750
(30). Reported monthly income among
the elderly was lower among women
(median monthly income in women
was US$ 213, and in men it was
US$ 379), and this was in line with the
reported occupational disparity. For a
simple question about having ade-
quate or inadequate financial means,
the majority of the participants (and a
greater proportion of women than
men) considered their financial situa-
tion as being inadequate to meet their
daily needs (women 65%, men 56%).
The crowding index showed little
variation among the participants, with
most households having 1 person or
less per room (women 91%, men 90%).
Basic summaries of human support
networks indicated that just over 20%
of participants were living alone, two-
thirds of women and one-third of men
were unmarried, 20% of participants
were without children, 25% were
without living siblings, 90% did not re-
port other relatives and friends, and
95% received no assistance from com-
munity sources. These data suggest
that elderly Barbadians primarily de-
pend on immediate family members
for social contact and support.
Lifestyle risk factors
We present the distributions of
the lifestyle risk factors in Table 4.
Women had a higher mean BMI value
(28.2 kg/m
2
) than did men (25.3
kg/m
2
), and a higher proportion of the
women (32%) were obese than were
men (12%). Based on waist circumfer-
ence cutpoints, many more women
were at high risk of chronic disease
(women 63%, men 15%). Almost all
the participants considered them-
selves well nourished, only a small mi-
nority continued to smoke (women
1%, men 14%), and just under half re-
ported regular exercise (women 42%,
men 49%).
Disease indicators and health status
Table 5 shows the distributions of
the disease indicators. In comparison
to the men, the women reported both a
higher average number of illnesses
(1.6 vs. 1.1) and a higher mean number
of disease symptoms (1.6 vs. 1.1). Only
3% of the women and 4% of the men
reported spending one or more nights
in the hospital in the previous four
months, and 77% of the women and
61% of the men reported making at
least one visit to a doctor over the
same period. Similar numbers of men
and women were depressed (5% of
women, 6% of men), according to a
standard GDS cutpoint for identifying
depression (GDS > 5). Men reported
better health: 21% of the men and
13% of the women reported very good
or excellent health, and 52% of the
women and 41% of the men reported
poor or fair health.
Individual regressions
We present the effect of historical
SEIs on health status in Table 6. For
historical SEIs, the odds of reporting
better health status was higher among
participants employed as profession-
346 Rev Panam Salud Publica/Pan Am J Public Health 17(5/6), 2005
Original research Hambleton et al. • Predictors of self-reported health status among elderly persons in Barbados
TABLE 2. Distribution (%) of historical socioeconomic indicators among 1 443 elderly
persons in study of historical and current predictors of self-reported health status,
Barbados, 1999–2000
Response rate Women (%) Men (%)
Indicator (%) (
n
= 879) (
n
= 564)
Occupation 98.1
Nonprofessionals 76 55
Semiprofessionals 15 27
Professionals 10 18
Education 98.8
Basic 77 74
Secondary 17 17
Higher 6 9
Childhood economic situation 98.7
Poor 33 44
Average 48 39
Good 19 17
Childhood nutrition 97.5
Not hungry 86 79
Hungry 14 21
Childhood health 99.7
Below excellent 51 42
Excellent 49 58
Number of childhood diseases 100
0–2 48 56
3 or more 52 44
als, those with higher education, and
those reporting a good economic situ-
ation and excellent health during
childhood.
Based on current SEIs, the odds of
reporting better health status was
higher among participants who re-
ported adequate finances to meet daily
needs (Table 7). The effect of support
networks was mixed, with better
health status reported among partici-
pants with more siblings, but margin-
ally worse health status reported as
the number of people in the household
increased.
We present the effect of lifestyle
risk factors on health status in Table 8.
The odds of reporting better health sta-
tus was lower among obese partici-
pants, among the undernourished, and
among those who did not exercise reg-
ularly. Smoking offered a contradic-
tory result, with current smokers re-
porting better health than nonsmokers.
This smoking effect was only seen in
women (women, OR = 2.62; 95% CI,
1.18 to 5.73, vs. men, OR = 1.44, 95% CI,
0.85 to 2.85), but only 1% of the women
were current smokers.
The effect of disease indicators on
health status is shown in Table 9. The
odds of reporting better health status
was lower among participants report-
ing more illness, more disease symp-
toms, and higher scores on the Geri-
atric Depression Scale.
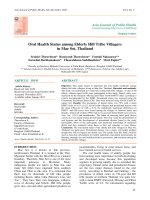
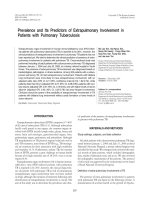
Predicted probabilities from the four
models showed strong and statisti-
cally important correlations with each
other (P < 0.001 in all cases). These cor-
relations attenuated as we compared
regressions from predictor groups fur-
ther apart on the pathway outlined in
Figure 1, so that the correlation of the
historical SEIs regression with the cur-
rent SEIs regression was 0.64 (95% CI,
0.61 to 0.68), with the lifestyle regres-
sion was 0.55 (95% CI, 0.51 to 0.59),
and with the disease regression was
0.32 (95% CI, 0.27 to 0.38), and so on
(Figure 2).
In Table 10 we present the amount of
variation in reported health status ex-
plained by a single model, using the
important predictors from each of
the four predictor groups. In this table
there are three columns reporting the
variation in the data that can be ex-
plained by the predictor groups in-
cluded in the model. “Model varia-
tion” reports the variation explained
by all predictor groups in the model,
after adjusting for age and sex. “Com-
mon variation” reports the difference
in variation between single-predictor-
group models and those models con-
taining more than one predictor group,
and is interpreted as the variation that
can be jointly ascribed to all predictor
groups in the model. For the “Histori-
cal SEI + Current SEI” model, the com-
mon variation is: Historical SEI model
variation + Current SEI model varia-
tion – (Historical SEI + Current SEI)
model variation, or 5.2% + 4.1 –7.9% =
1.4%, and so on. “Historical variation”
is the variation explained by the histor-
ical SEI predictor group alone, after all
other terms in the model have been
added. In univariate models, age and
gender accounted, respectively, for
Rev Panam Salud Publica/Pan Am J Public Health 17(5/6), 2005 347
Hambleton et al. • Predictors of self-reported health status among elderly persons in Barbados Original research
TABLE 3. Distribution (%) of current socioeconomic indicators among 1 443 elderly persons
in study of historical and current predictors of self-reported health status, Barbados,
1999–2000
Response rate Women (%) Men (%)
Indicator (%) (
n
= 879) (
n
= 564)
Self-reported monthly income (US$) 74.8
Less than 175 49 29
175 to less than 350 27 27
350 or more 24 47
Imputed monthly income (US$) 100
Less than 175 40 21
175 to less than 350 34 29
350 or more 27 50
Financial means
a
93.0
Inadequate 65 56
Adequate 35 44
Crowding
b
99.6
Less than 0.4 41 40
0.4 to less than 0.6 31 30
0.6 and higher 28 31
Living alone 100
Yes 21 22
No 79 78
Currently married 99.8
No 67 39
Yes 33 61
Number of people in household 100
0 21 22
1–2 54 53
3 or more 26 25
Number of children living outside the household 100
0 24 18
1–2 32 30
3 or more 45 52
Number of siblings living outside the household 100
0 25 23
1–2 38 34
3 or more 37 42
Other relatives and friends living outside the household 100
0 90 94
1–2 96
3 or more 1 0
a
Financial means was assessed by asking participants if they had enough money to meet daily living expenses.
b
Crowding was calculated as the number of people living in the household divided by the number of rooms in the house
(excluding the kitchen and bathroom).
6.1% and 3.1% of variation in health
status reporting, and we included these
confounders in all models.
After adjusting for age and sex, his-
torical SEIs explained an additional
5.2% of total variation, which com-
pared to 4.1% from current SEIs, 7.1%
from lifestyle risk factors, and 33.6%
from disease indicators. As other pre-
dictor groups are added to the model,
the percentage of the variation ex-
plained by historical predictors alone
decreases, indicating that health status
information contained in the historical
SEIs was mediated through current
predictors. The unique information ex-
plained by historical SEIs fell to 3.8%
using current SEIs, 4.0% using lifestyle
risk factors, 2.7% using disease indica-
tors, and 2.0% using all other predictor
groups together. This suggests that in
Barbadian participants, over 60% of
historical SEI information was medi-
ated through current socioeconomic,
lifestyle, and disease determinants of
self-reported health.
DISCUSSION
When persons answer questions
about their health, they draw on a
wealth of past and current experiences
that shape their responses. The simple
Likert scale of self-perceived health
status belies the breadth of information
it contains, and it is not surprising that
it can be adequately modeled using
alternative groups of predictors. This
presents a challenge for the analyst
who is looking to develop a predictive
model of this health outcome. Through
repeated analyses, the classic socioeco-
nomic indicators of education, occupa-
tion, and income have emerged as ro-
bust predictors of current health in
adults (31–33). Among the elderly, ed-
ucation, occupation, and other socio-
economic determinants represent past
experiences. These historical events are
likely to have a smaller effect on health
status over time, and any predictive ef-
fect that remains will be partly medi-
ated through current lifestyle and dis-
ease experience. Although this may
mean that historical SEIs are statisti-
cally insignificant in a single model of
348 Rev Panam Salud Publica/Pan Am J Public Health 17(5/6), 2005
Original research Hambleton et al. • Predictors of self-reported health status among elderly persons in Barbados
TABLE 4. Distribution (%) of current lifestyle risk factors among 1 443 elderly persons in
study of historical and current predictors of self-reported health status, Barbados, 1999–2000
Response rate Women (%) Men (%)
Risk factor (%) (
n
= 879) (
n
= 564)
Body mass index 95.4
Normal 36 57
Overweight 32 31
Obese 32 12
Waist circumference 98.5
Low risk 37 85
High risk 63 15
Disease risk
a
95.3
Normal 36 57
Increased 9 24
High 24 10
Very/Extremely high 31 9
Nutrition 98.1
Well nourished 97 97
Not well nourished 3 3
Smoking 99.9
Never smoked 91 47
Ex-smoker 8 39
Current smoker 1 14
Exercise 99.8
Yes 42 49
No 58 51
a
We calculated an index of disease risk using body mass index and waist circumference, with five categories: normal, in-
creased, high, very high, and extremely high.
TABLE 5. Distribution (%) of self-reported health status and disease indicators among
1 443 elderly persons in study of historical and current predictors of self-reported health
status, Barbados, 1999–2000
Response rate Women (%) Men (%)
Health status/Disease indicator (%) (
n
= 879) (
n
= 564)
Health status 99.7
Poor 54
Fair 47 37
Good 35 38
Very good 10 15
Excellent 3 6
Number of illnesses 100
0 17 34
1–2 64 57
3 or more 19 9
Geriatric Depression Scale 100
Not depressed (GDS ≤ 5) 95 94
Depressed (GD > 5) 5 6
Number of symptoms 100
0 31 50
1–2 44 39
3 or more 25 11
Nights in hospital in 4-month period 99.4
0 97 96
1–2 12
3 or more 2 2
Number of medical contacts in 4-month period 98.8
0 24 39
1–2 70 54
3 or more 07 07
health status in the elderly, it does
not follow that they are conceptually
unimportant. This introduces a clear
time dimension to this cross-sectional
study, which is rarely considered and
which requires careful modeling. We
have developed a conceptual frame-
work for our analysis, and have
modeled health status within this
framework in an attempt to identify
pertinent predictors within specific
predictor groups, and to then assess
the relative strength of these predictor
groups, and the quantity of historical
information that is mediated through
current signals.
We confirm the expected associa-
tions of better education, professional
occupation, and better childhood eco-
nomic situation and health with im-
proved health status in the elderly.
Historical predictors explained 5.2%
of variation in reported health status,
but that fell to 2.0% (a decline of over
60%) after adjusting for current SEI,
lifestyle, and disease predictors.
Current SEI, lifestyle, and disease
predictors of health status broadly
followed convention, with the excep-
tion of female current smokers, who
reported better health than nonsmok-
ers. This seemingly anomalous result
may reflect a bias among the group
of surviving female smokers, and
our inability to explain this result is
the major drawback of such cross-
sectional work. Indicators of disease
dominated the prediction of health
status, suggesting that while this sin-
gle measure of health may summarize
a complex health “trait,” the partici-
pants’ health perceptions were heavily
influenced by their disease experience.
Quality-of-life (QoL) tools can provide
additional insights into health percep-
tions, but with increased survey costs.
A QoL tool investigating active aging
has recently been suggested and ex-
amined (34, 35).
Study limitations
Our survey is cross-sectional, and so
causal inference is not possible. Many
of our findings are intuitive and con-
firmatory, and a few appear to be con-
Rev Panam Salud Publica/Pan Am J Public Health 17(5/6), 2005 349
Hambleton et al. • Predictors of self-reported health status among elderly persons in Barbados Original research
TABLE 6. The effect of selected historical socioeconomic indicators on better self-reported
health status among 1 147 elderly persons in study of historical and current predictors of
self-reported health status, Barbados, 1999–2000
Historical socioeconomic indicator OR
a
95% CI
b
P
Occupation
Nonprofessional 1.00
Semiprofessional 1.08 0.79 to 1.47 0.64
Professional 1.55 1.03 to 2.34 0.04
Education
Basic 1.00
Secondary 1.12 0.78 to 1.59 0.54
Higher 1.50 0.94 to 2.40 0.09
Childhood economic situation
Poor 1.00
Average 1.00 0.77 to 1.32 0.97
Good 1.67 1.15 to 2.42 0.01
Childhood health
Below excellent 1.00
Excellent 1.48 1.15 to 1.90 0.002
a
OR = odds ratio.
b
95% CI = 95% confidence interval.
TABLE 7. The effect of selected current socioeconomic indicators on better self-reported
health status among 1 147 elderly persons in study of historical and current predictors of
self-reported health status, Barbados, 1999–2000
Current socioeconomic indicator OR
a
95% CI
b
P
Financial means
Inadequate 1.00
Adequate 1.51 1.17 to 1.94 0.001
Number of people in household 0.92 0.85 to 0.99 0.03
Number of siblings living outside the household 1.06 1.01 to 1.12 0.03
Others living outside the household 0.81 0.64 to 1.03 0.08
a
OR = odds ratio.
b
95% CI = 95% confidence interval.
TABLE 8. The effect of selected current disease mediators on better self-reported health
status among 1 147 elderly persons in study of historical and current predictors of self-
reported health status, Barbados, 1999–2000
Disease mediator OR
a
95% CI
b
P
Body mass index
Normal 1.00
Overweight 0.81 0.61 to 1.08 0.14
Obese 0.51 0.37 to 0.71 < 0.001
Nutrition
Well nourished 1.00
Not well nourished 0.45 0.20 to 1.03 0.06
Smoking
Never smoked 1.00
Ex-smoker 1.01 0.73 to 1.40 0.94
Current smoker 1.66 1.00 to 2.74 0.05
Exercise
Yes 1.00
No 0.59 0.46 to 0.75 < 0.001
a
OR = odds ratio.
b
95% CI = 95% confidence interval.
tradictory, with explanations that can
only be considered speculative.
Our conceptual model was designed
to guide the modeling process and is
rather simplistic. In particular, the dis-
tinction between historical and current
health predictors is not clear-cut: In-
come and disease indicators are two
important variables that have both his-
torical and current components. More-
over, the relative importance of our
four predictor groups is based funda-
mentally on identifying all important
potential determinants of health sta-
tus. As with most observational work,
it is unlikely that we have accounted
for all important determinants of
health status. The possibility of omit-
ted predictors means that we cannot
allocate absolute importance to our
predictor groups. That is, the variance
explained by each group serves only
as a general guide. There are different
numbers of predictors in each predic-
tor group, which complicates direct
comparison of the variation explained
by each group. To partly correct for
this problem, we used a measure of
variation that included a downward
adjustment for the number of predic-
tor terms in a model; we reduced the
variation explained by larger models
by a larger amount relative to smaller
models.
Public health implications
Past events cannot be changed, but
they retain a minor influence on the
perceived health of the persons who
are now elderly in Barbados and else-
where. Ongoing public health pro-
grams to reduce poverty and to im-
prove access to health care, utilities,
and education can be considered as
long-term strategies to improve the
health of those who will be elderly in
the future. Current SEIs influence self-
reported health status, and so inter-
ventions to support vulnerable groups
in society (such as those living with
limited means or with poor access to
social support) could promote in-
creased well-being among the elderly.
In this study we considered four
lifestyle risk factors of health status:
obesity (measured using BMI and
waist circumference), nutrition, exer-
cise, and smoking. Education pro-
grams targeting these lifestyle deter-
minants of health status represent a
potentially cost-effective intervention
to improve health among the elderly.
Despite our surprising finding for fe-
male smokers, education programs
targeted at the elderly should pro-
mote the health benefits of weight re-
duction among the overweight and
obese as well as of good nutrition, ex-
ercise, and quitting smoking. Current
disease was the overwhelming pre-
dictor of self-reported health in our
study. The reactive strategy of target-
ing the sick with clinical care, along
with aggressive promotion of lifestyle
risk-factor reduction, could lessen the
likelihood of disease progression and
thus improve health status. Interven-
tions in these four lifestyle-risk areas
are complementary, and it will be im-
portant to understand the relative
costs and benefits of each approach
before decisions can be made on the
allocation of funding.
350 Rev Panam Salud Publica/Pan Am J Public Health 17(5/6), 2005
Original research Hambleton et al. • Predictors of self-reported health status among elderly persons in Barbados
TABLE 9. The effect of selected current disease indicators on better self-reported health
status among 1 147 elderly persons in study of historical and current predictors of self-
reported health status, Barbados, 1999–2000
Disease indicator OR
a
95% CI
b
P
Number of illnesses 0.55 0.48 to 0.64 < 0.001
Signs of illness 0.71 0.64 to 0.79 < 0.001
Geriatric Depression Scale 0.85 0.78 to 0.94 < 0.001
a
OR = odds ratio.
b
95% CI = 95% confidence interval.
FIGURE 2. Pairwise correlation (with 95% confidence interval (Cl)) of regression predictions
from regressions using four prediction groups: historical socioeconomic indicators (H),
current socioeconomic indicators (C), lifestyle risk factors (L), and disease indicators (D),
in study of historical and current predictors of self-reported health status, Barbados,
1999–2000
◆
◆
◆
◆
◆
◆
◆
0.7
0.6
0.5
0.4
0.3
0.2
H-C
Correlation
H-L H-D
95% CICorrelation coefficient
C-L C-D L-D
Rev Panam Salud Publica/Pan Am J Public Health 17(5/6), 2005 351
Hambleton et al. • Predictors of self-reported health status among elderly persons in Barbados Original research
Summary
Ultimately, the question for policy-
makers is whether a healthy and active
old age is a realistic goal in Barbados
and elsewhere. It is accepted that
aging per se does not affect health (36).
Although we all expect some level of
functional decline as we age, a goal is
to promote the separation of the per-
ceived association between age and ill-
health. As at any age, the elderly with
better health habits can live healthily
and actively for longer.
In influencing the health of the el-
derly, the compressed profile of mor-
bidity has been reported in developed
countries (37), with markers of aging
developing later in life. These suc-
cesses have been attributed to disease
postponement or improved disease
management, and they reflect the dual
benefits of medical advances and pub-
lic health advances.
In this study we have shown that for
our study participants in Barbados,
historical SEIs explain only a small
proportion of variation in self-
reported health status, and over half of
that variation is mediated through cur-
rent experience. The fact that current
experience dominates our health per-
ceptions means that these perceptions
are conducive to adaptation through
public health programs. Based on our
results, we have suggested several
broad routes for public health inter-
vention. More comprehensive guide-
lines for programs to support active
aging are available (38). Detailed data
from the Americas are only recently
available, and the SABE project is well
placed to provide important guidance
for public health policymakers. To
maximize the use of these data, we
must also consider the particular fea-
tures of modeling cross-sectional data
in the elderly.
Acknowledgements. Funding was
provided by the Caribbean Develop-
ment Bank, the Chronic Disease Re-
search Centre Appeal Fund, the Pan
American Health Organization, and
the Caribbean Health Research Coun-
cil. We acknowledge the support of the
project coordinator, Ms. P. Howard,
and our research staff who conducted
interviews.
TABLE 10. The joint influence of prediction groups on self-reported health status among
1 147 Barbadian participants, using variation explained (%) by each model in study of
historical and current predictors of self-reported health status, Barbados, 1999–2000
Variation explained (%)
Model Common Historical
Model
a
variation
b
variation
c
variation
d
Single predictor group
Historical 5.2 — 5.2
Current 4.1 — 4.1
Lifestyle 7.1 — 7.1
Disease 33.6 — 33.6
Multiple predictor groups
Historical + Current 7.9 1.4 3.8
Historical + Lifestyle 11.2 1.1 4.0
Historical + Disease 36.2 3.0 2.7
Historical + Current + Lifestyle 13.7 2.7 2.9
Historical + Current + Disease 36.9 6.4 2.4
Historical + Lifestyle + Disease 37.6 8.7 2.4
Historical + Current + Lifestyle + Disease 38.2 12.2 2.0
a
All models adjusted for age and gender.
b
“Model variation” reports the variation explained by all predictor groups in the model, after adjusting for age and sex.
c
“Common variation” reports the difference in variation between single predictor group models and those models containing
more than one predictor group, and is interpreted as the variation that can be jointly ascribed to all predictor groups in the
model.
d
“Historical variation” is the variation explained by historical predictor group alone, after all other terms in the model have been
added.
1. United Nations. Report of the Second World
Assembly on Ageing. New York: U.N.; 2002.
2. Palloni A, Pinto-Aguirre G, Pelaez M. Demo-
graphic and health conditions of aging in
Latin America and the Caribbean. Int J Epi-
demiol. 2002;31:762–71.
3. Kalache A, Keller I. The greying world. A
challenge for the twenty-first century. Sci
Prog. 2000;83(1):33–54.
4. World Health Organization. Active ageing: a
policy framework. Geneva: WHO; 2002.
(WHO/NMH/NPH/02.8).
5. World Health Organization. Ottawa Charter
on Health Promotion. Copenhagen: WHO Re-
gional Office for Europe; 1986.
6. Moss C. Selection of topics and questions for the
2001 census. Popul Trends. 1999;97(9):28–36.
7. Miilunpalo S, Vuori I, Oja P, Pasanen M, Ur-
ponen H. Self-rated health status as a health
measure: the predictive value of self-reported
health status on the use of physician services
and on mortality in the working-age popula-
tion. J Clin Epidemiol. 1997;50(5):517–28.
8. McLeod CB, Lavis JN, Mustard CA, Stoddart
GL. Income inequality, household income,
and health status in Canada: a prospective co-
hort study. Am J Public Health. 2003;93(8):
1287–93.
9. Borrell C, Muntaner C, Benach J, Artazcoz L.
Social class and self-reported health status
among men and women: what is the role of
work organisation, household material stan-
dards and household labour? Soc Sci Med.
2004;58(10):1869–87.
10. Jones DJ, Beach SR, Forehand R, Foster SE.
Self-reported health in HIV-positive African
American women: the role of family stress
and depressive symptoms. J Behav Med. 2003;
26(6):577–99.
11. Wannamethee G, Shaper AG. Self-assessment
of health status and mortality in middle-
aged British men. Int J Epidemiol. 1991;20:
239–45.
12. McGee DL, Liao Y, Cao G, Cooper RS. Self-
reported health status and mortality in a
multiethnic US cohort. Am J Epidemiol.
1999;149: 41–6.
13. Goldberg P, Guéguen A, Schmaus A,
Nakache J-P, Goldberg M. Longitudinal study
of associations between perceived health sta-
tus and self reported diseases in the French
REFERENCES
352 Rev Panam Salud Publica/Pan Am J Public Health 17(5/6), 2005
Original research Hambleton et al. • Predictors of self-reported health status among elderly persons in Barbados
Gazel cohort. J Epidemiol Community Health.
2001;55:233–8.
14. Palloni A. SABE Project. Protocol of the multi-
center study: Health, Well-being and Aging in
Latin America and the Caribbean. Washing-
ton, D.C.: Pan American Health Organization;
1999.
15. Regidor E, Banegas JR, Gutiérrez-Fisac JL,
Domínguez V, Rodríguez-Artalejo F. Socio-
economic position in childhood and cardio-
vascular risk factors in older Spanish people.
Int J Epidemiol. 2004;33:1–8.
16. Kaplan GA, Salonen J. Socioeconomic condi-
tions in childhood and ischaemic heart dis-
ease during middle age. Br Med J. 1990;301:
1121–3.
17. Davey Smith G, Hart C, Blane D, Hole DJ.
Adverse socioeconomic conditions in child-
hood and cause specific adult mortality:
prospective observational study. Br Med J.
1998; 316:1631–5.
18. Von dem Knesebeck O, Luschen G, Cocker-
ham WC, Siegrist J. Socioeconomic status and
health among the aged in the United States
and Germany: a comparative cross-sectional
study. Soc Sci Med. 2003;57(9):1643–52.
19. Kaufman JS, Kaufman S, Poole C. Causal in-
ference from randomized trials in social epi-
demiology. Soc Sci Med. 2003;57(12): 2397–
2409.
20. Liberatos P, Link BG, Kelsey JL. The measure-
ment of social class in epidemiology. Epi-
demiol Rev. 1988;10:87–121.
21. Lahelma E, Martikainen P, Laaksonen M, Ait-
tomaki A. Pathways between socioeconomic
determinants of health. J Epidemiol Commu-
nity Health. 2003;58:327–32.
22. Peláez M, Palloni A, Albala C, Alfonso JC,
Ham-Chande R, Hennis A, et al. Survey on
Aging, Health and Wellbeing, 2000: Washing-
ton, D.C.: Pan American Health Organization;
2003.
23. Litwin H. Social network type and health sta-
tus in a national sample of elderly Israelis. Soc
Sci Med. 1998;46(4-5):599–609.
24. Lahuerta C, Borrell C, Rodríguez-Sanz M,
Pérez K, Nebot M. La influencia de la red so-
cial en la salud mental de la población an-
ciana. Gac Sanit. 2004;18(2):83–91.
25. Joint WHO/FAO Expert Consultation on
Diet, Nutrition and the Prevention of Chronic
Diseases. Diet, nutrition and the prevention of
chronic diseases: report of a joint WHO/FAO
expert consultation, 28 January–1 February,
2002. Geneva: World Health Organization;
2002. (WHO technical report series 916).
26. United States, National Institutes of Health.
Clinical guidelines on the identification, eval-
uation, and treatment of overweight and obe-
sity in adults. Bethesda: NIH; 1998. (NIH Pub-
lication No. 98-4083).
27. Sheikh JI, Yesavage JA. Geriatric Depression
Scale (GDS): recent evidence and develop-
ment of a shorter version. In: Brink TL, ed.
Clinical gerontology: a guide to assessment
and intervention. New York: The Haworth
Press; 1986. Pp. 165–73.
28. StataCorp. Stata Statistical Software: release
8.0. College Station: StataCorp; 2003.
29. Little RJA, Rubin DB. Statistical analysis with
missing data. New York: John Wiley & Sons;
1987.
30. World Bank. World development indicators
database [Web site]. Available from: http://
devdata.worldbank.org/external/CPProfile.
asp?SelectedCountry=BRB&CCODE=BRB&
CNAME=Barbados&PTYPE=CP. Accessed 25
May 2004.
31. Hay DI. Socioeconomic status and health sta-
tus: a study of males in the Canada Health
Survey. Soc Sci Med. 1988;27:1317–25.
32. House JS, Kessler RC, Herzog AR, Kinney
AM, Mero RP, Breslow MF. Age, socioeco-
nomic status, and health. Milbank Q. 1990;68:
383–411.
33. Rogers RG. Living and dying in the USA:
sociodemographic determinants of death
among Blacks and Whites. Demography.
1992;29:287–303.
34. Rowe JW, Kahn RL. Successful aging. Geron-
tologist. 1997;37:433–40.
35. Strawbridge WJ, Wallhagen MI, Cohen RD.
Successful aging and well-being: self-rated
compared with Rowe and Kahn. Gerontolo-
gist. 2002;42:727–33.
36. McMurdo MET. A healthy old age: realistic or
futile goal? Br Med J. 2003;321:1149–51.
37. Kalache A, Aboderin I, Hoskins I. Compres-
sion of morbidity and active ageing: key prior-
ities for public health policy in the 21st century.
Bull World Health Organ. 2002;80(3):243–4.
38. Pan American Health Organization. Plan of
action on health and aging: older adults in
the Americas 1999–2002. Washington, D.C.:
PAHO; 1999.
Manuscript received 29 June 2004. Accepted for publica-
tion 1 December 2004.
Objetivo. Determinar la contribución relativa de sucesos del pasado y experiencias del
presente al estado de salud de las personas de edad en Barbados, a fin de idear interven-
ciones sanitarias oportunas para esa población.
Métodos. La información usada para este estudio de prevalencia se recogió en Barbados
entre diciembre de 1999 y junio de 2000 como parte del “proyecto SABE,” encuesta multi-
céntrica efectuada en siete centros urbanos de América Latina y el Caribe para evaluar los
factores que inciden en la salud y el bienestar de las personas de edad (de 60 años o más).
Mediante regresión logística para datos ordinales se modelaron los factores que inciden en el
estado de salud autonotificado, y también se evaluó la contribución relativa de algunos in-
dicadores socioeconómicos del pasado, así como la de tres grupos de factores modificables,
relativos al momento presente, con valor pronóstico —indicadores de situación socioeconó-
mica, factores de riesgo asociados con el estilo de vida e indicadores de enfermedad—,
usando medidas sencillas para calcular el grado de asociación y el ajuste del modelo.
Resultados. Los sucesos del pasado que tuvieron un efecto determinante sobre la salud
explicaron 5,2% de la variación del estado de salud autonotificado, cifra que se redujo a
2,0% cuando se tuvo en cuenta la mediación de experiencias del presente. Los indicadores
de la situación socioeconómica actual explicaron 4,1% de la variación en el estado de salud
autonotificado; los factores de riesgo relacionados con el estilo de vida explicaron 7,1%, y
los indicadores de enfermedad actual, 33,5%.
Conclusiones. Las experiencias pasadas de orden socioeconómico influyeron sobre el es-
tado de salud autonotificado por ancianos barbadenses. Más de la mitad de la influencia
ejercida por sucesos pasados se vio mediada por experiencias del presente relacionadas con
la situación socioeconómica, el estilo de vida y la presencia de enfermedades. El cuidado de
los enfermos y la reducción de los factores de riesgo relacionados con el estilo de vida son
aspectos de importancia que deben tenerse presentes al prestarles apoyo a las personas que
son ancianas en la actualidad. Además, los programas que están en marcha ahora para re-
ducir la pobreza y aumentar el acceso a la atención de salud y a la educación deben consi-
derarse estrategias de largo plazo orientadas a mejorar la salud de los ancianos del futuro.
Estado de salud, anciano, factores socioeconómicos, Barbados.
RESUMEN
Sucesos del pasado y del
presente que determinan
el estado de salud, según
autonotificación, de las
personas de edad
en Barbados
Palabras clave