Reliability and Intensity of the Six-Minute Walk Test in Healthy Elderly Subjects docx
Bạn đang xem bản rút gọn của tài liệu. Xem và tải ngay bản đầy đủ của tài liệu tại đây (152.34 KB, 6 trang )
Reliability and Intensity of the Six-Minute
Walk Test in Healthy Elderly Subjects
GAELLE KERVIO
1
, FRANCOIS CARRE
1
, and NATHALIE S. VILLE
2
1
Groupe de Recherche Cardio-Vasculaire, Universite´ Rennes 1, Rennes, FRANCE; and
2
Laboratoire de Physiologie et de
Biome´canique de L’Exercice Musculaire, Universite´ Rennes 2, Rennes, FRANCE
ABSTRACT
KERVIO, G., F. CARRE, and N. S. VILLE. Reliability and Intensity of the Six-Minute Walk Test in Healthy Elderly Subjects. Med.
Sci. Sports Exerc., Vol. 35, No. 1, pp. 169–174, 2003. Purpose: The 6-min walk test (6-MWT) is an easy and validated field test,
generally used in patients to assess their physical capacity. We think that the 6-MWT could also be conducted in the same perspective
in healthy subjects, aged 60–70 yr. However, little is known about the effect of the familiarization on the 6-MWT performance and
the relative intensity of this test. The aims of this study were therefore to bring precision to the 6-MWT reliability and intensity in this
population. Methods: Over 3 d, 12 subjects performed two maximal exercise tests on treadmill and five 6-MWT (two in the morning
and three in the afternoon) with a portable metabolic measurement system (Cosmed K4, Rome, Italy). The distance, walking speed,
oxygen uptake (V
˙
O
2
), and heart rate (HR) values were measured during the 6-MWT. Results: Distance, walking speed, and V
˙
O
2
were
only lower during the first two 6-MWT (respectively, P Ͻ 0.001, P Ͻ 0.001, and P Ͻ 0.05). HR was reliable from the first 6-MWT
and was higher during the tests performed in the afternoon (P Ͻ 0.001). The intensity of the 6-MWT corresponded to 79.6 Ϯ 4.5%
of the V
˙
O
2max
, 85.8 Ϯ 2.5% of the HR
max
, and 78.0 Ϯ 6.3% of the HR
reserve
. Moreover, it was higher than the ventilatory threshold
in each subject (P Ͻ 0.01). Conclusion: In healthy elderly subjects, the 6-MWT represents a submaximal exercise, but at almost 80%
of the V
˙
O
2max
. To be exploitable, two familiarization attempts are required to limit the learning effect. Finally, the 6-MWT time of
day must be taken into account when assessing HR. Key Words: FIELD TEST, FAMILIARIZATION, ASSESSMENT OF
PHYSICAL CAPACITY, PORTABLE METABOLIC MEASUREMENT SYSTEM, CARDIORESPIRATORY PARAMETERS
T
he cardiovascular, respiratory, and muscular benefits
of physical training in healthy elderly subjects have
been largely underscored (11,20). Maximal oxygen
uptake (V
˙
O
2max
) is usually used before and after physical
training to evaluate the physical capacity. The regular use of
this test to assess the subjects’ progress may incite motiva-
tion to maintain a physical activity. However, this well-
validated test (25) is still complex, requiring specially
trained staff, and cumbersome and expensive equipment
(19,24,29). Therefore, other more simple and inexpensive
test is required in complement of the maximal exercise one.
The 6-min walk test (6-MWT) is a validated, simple, safe,
and low-cost field test, often used in chronic heart failure
(CHF) and chronic obstructive pulmonary disease (COPD)
patients to regularly assess their functional exercise capacity
and the effects of a rehabilitation program (8,16,21). Indeed,
a premeasured level hallway, stopwatch, and specific in-
structions are all that are necessary for such a test (9).
Moreover, the 6-MWT requires one only to walk and can be
performed easily by young and old people. Different pa-
rameters in patients such as the 6-MWT familiarization
(8,16,22) can, however, influence the performance obtained.
Because there are few field tests applicable to healthy
subjects aged more than 60 yr, we think that the 6-MWT
could be used in the same perspective in subjects without
physical activity contra-indications. The aims of the present
study were therefore to assess the distance and cardiorespi-
ratory parameters during the 6-MWT in healthy subjects
aged 60–70 yr to study (i) the test reliability on successive
days and on the same day, and (ii) the test relative intensity.
METHODS
Subjects. Twelve subjects aged 60–70 yr were re-
cruited. They had a medical examination and completed a
health status questionnaire. Medication, smoking habits, and
physical activities (27) were also noted. Their anthropomet-
ric values are indicated in Table 1. The classical inclusion-
ary factors for the healthy elderly subset (10) were used: no
current smoking, free from drugs, chronic disease, history of
stroke, and body mass index lower than 35. None of the
subjects had neurologic and orthopedic conditions that
could influence successful completion of the exercise tests,
and exhibited any significant anxiety or difficulty in under-
standing the test protocols. All were active but not involved
in any regular physical training. The study was approved by
the institutional committee on human research, and written
informed consent was obtained from all subjects.
Address for correspondence: Gae¨lle Kervio, Ph.D., Service de Me´decine du
Sport, CHU Pontchaillou, 2 rue Henri Le Guilloux, 35 000 Rennes, France;
E-mail:
Submitted for publication January 2002.
Accepted for publication September 2002.
0195-9131/03/3501-0169/$3.00/0
MEDICINE & SCIENCE IN SPORTS & EXERCISE
®
Copyright © 2003 by the American College of Sports Medicine
DOI: 10.1249/01.MSS.0000043545.02712.A7
169
Study design. Individuals performed two maximal ex-
ercise tests and five 6-MWT on3d(1–2 d apart) according
to the following manner: day 1 in the morning: 6-MWT and
maximal exercise test, and in the afternoon: 6-MWT; day 2
in the morning: 6-MWT, and in the afternoon: 6-MWT; day
3 in the morning: maximal exercise test, and in the after-
noon: 6-MWT. During all tests, they carried the Cosmed K4
(Rome, Italy), portable metabolic measurement system, to
record the cardiorespiratory parameters.
Metabolic parameters. The Cosmed K4 is a well-
validated portable metabolic measurement system (12,17)
composed of a soft mask to sample exhaled air, a sensor
system to measure ventilation, and O
2
and carbon dioxide
(CO
2
) analyzers. The total weight carried by the subject is
about 800 g. The radio transmission range in an open field
using a small 30-cm-long receiving antenna is about 800 m.
The respiratory flow was measured by a turbine fixed to the
face mask, and expired gas concentrations were measured
with a polarographic electrode for the O
2
fraction and with
an infrared electrode for the CO
2
fraction. These gas ana
-
lyzers were thermostated and compensated for barometric
pressure and environmental humidity variations. The
Cosmed K4 system was calibrated before each test accord-
ing to the manufacturer’s recommended procedures (oper-
ator’s manual of K4 system). Heart rate (HR) was simulta-
neously recorded with a polar portable system (Polar Electro
OY, Kempele, Finland). The sampling of the parameters
studied (V
˙
O
2
and HR) was carried out at 30-s intervals.
Furthermore, the apparatus includes a communication inter-
face to download all recorded parameters onto a personal
computer. Data was collected and analyzed using the soft-
ware “K4 for Windows.”
Maximal exercise test. Each subject underwent two
maximal cardiorespiratory exercise tests on treadmill (Mar-
quette Electronics, Milwaukee, WI). The first was used as a
familiarization and exclusion test, eliminating from our
study the participants presenting an exercise contra-indica-
tion. A conventional exercise protocol namely the “chrono-
tropic assessment exercise protocol,” well tolerated in el-
derly healthy subjects, was used (23). It started at 1.6
km·h
Ϫ1
and increased (speed 0.8 km·h
Ϫ1
and slope 1%)
every 2 min. Blood pressure was measured manually in the
left arm at each end stage by using a quartz transducer. A
12-lead electrocardiogram (Cardio System Marquette
Hellige, Milwaukee, WI) was continuously monitored. The
exercise test was stopped when at least three classical cri-
teria of V
˙
O
2max
were reached (11). Because of a possible
influence of the familiarization test, only the results of the
second exercise test were analyzed.
V
˙
O
2max
and HR
max
were defined as the mean V
˙
O
2
and
HR values obtained during the last minute of exercise.
HR
reserve
was calculated (HR
reserve
ϭ HR
max
Ϫ HR
resting
)
(18). Ventilatory threshold was determined in a blind man-
ner by three technicians using the Beaver et al. method (3).
If not conclusive, the Wasserman method was used (28).
The 6-min walk test. The medically supervised
6-MWT was performed in an 18-m-long hospital corridor
free from all obstacles. Subjects were asked to walk back
and forth at a regular pace, covering as great a distance as
possible during the allotted time (16). Resting stops were
allowed. Standardized encouragement was given every 30 s
(4). The time remaining was called every 2 min (4). The
supervisor stopped the subject when the 6 min had elapsed.
So as not to influence their walking speed, subjects were
unaccompanied. Medical staff and subjects were blind to all
previous test results.
The total distance covered in meters was measured and
the walking speed in m·s
Ϫ1
lap by lap was calculated. To
better characterize the metabolic evolution during the
6-MWT, V
˙
O
2
and HR were noted every 30 s. The reliability
and intensity of the 6-MWT were assessed using the mean
V
˙
O
2
and HR values recorded during the last minute of the
walking test. Before and after each test, dyspnea was as-
sessed on a 10-cm visual analog scale with “not breathless
at all” at one end of the scale and “as breathless as you could
ever imagine” at the other (7).
Conducting five 6-MWT in a strictly standardized proce-
dure permitted us to assess the test familiarization and
reliability over several days. Both 6-MWT performed on the
second day of the study (one in the morning and the other in
the afternoon) have been used to assess the test daily reli-
ability. The fifth 6-MWT, conducted on the same day as the
maximal exercise test, served as a reference to evaluate its
relative intensity (i.e., in comparison with individual
V
˙
O
2max
,HR
max
, and HR
reserve
) and to assess the variations
in speed and metabolic parameters within the test.
Statistical analysis. All data is expressed as mean Ϯ
SE. The reliability of the parameters obtained from the
6-MWT was assessed using several complementary meth-
ods (2): a Friedman test, a Bland and Altman graphic rep-
resentation (5) between the first two and the last two
6-MWT, the coefficient of variation (CV), and standard
deviation (SD) calculation (15). During the fifth 6-MWT,
the walking speed and the metabolic parameters (V
˙
O
2
and
HR) were evaluated, respectively, lap by lap and 30 s by
30 s using a Friedman test. Then, a Wilcoxon signed rank
test was used for the pairwise analysis. It was also used to
compare the 6-MWT intensity with the ventilatory thresh-
old. In their recent study, some authors (10,14,26) have
proposed a regression equation based on sex, age, height,
and weight to predict the distance covered during the
6-MWT. A Wilcoxon signed rank test was used to compare
the predicted 6-MWT distances using the different equa-
tions (10,14,26) and the real 6-MWT distance performed by
our participants. A Bland and Altman graphic representation
(5) was then performed between the predicted 6-MWT
distance, using the Troosters et al. equation (26), and the
TABLE 1. Characteristics of the studied subjects (N ϭ 12).
Variable Mean ؎ SE
Sex (M/F) 6/6
Age (yr) 64.7 Ϯ 1.4
Weight (kg) 68.4 Ϯ 2.6
Height (cm) 160.8 Ϯ 2.2
BMI (kg⅐m
Ϫ2
)
26.4 Ϯ 0.7
M, male; F, female; BMI, body mass index.
170
Official Journal of the American College of Sports Medicine
real distance to measure the agreement between the two
measurements. Finally, a linear multiple regression analysis
based on age, anthropometric values (weight, height), and
on the 6-MWT distance, V
˙
O
2
, and HR was used to predict
V
˙
O
2max
of our subjects. For all analysis, a P Ͻ 0.05 level
was accepted as significant.
RESULTS
Maximal exercise test. No adverse events were noted
during the treadmill tests. The mean V
˙
O
2max
and HR
max
values were, respectively, 30.1 Ϯ 1.0 mL·kg
Ϫ1
·min
Ϫ1
and
152.0 Ϯ 4.0 beats·min
Ϫ1
. The mean ventilatory threshold
value corresponded to 65.4 Ϯ 2.9% of the V
˙
O
2max
.
The 6-min walk test. None of the 6-MWT was inter-
rupted. The mean distance increased by 45.3 m over the five
trials. The distance performed and consequently the walking
speed were significantly lower during the first two 6-MWT
(P Ͻ 0.001, Table 2 and Fig. 1). During the last 6-MWT,
subjects walked 570.1 Ϯ 22.7 m. Moreover, the mean CV
for the distance was lower than 6%. These values clearly
reduced after the first two 6-MWT, as did the SD (Table 3).
The distance was not significantly different between morn-
ing and afternoon (Table 2). Concerning the walking speed,
a significant change occurred throughout the last 6-MWT (P
Ͻ 0.001). Indeed, the mean pace reached 1.64 Ϯ 0.06 m·s
Ϫ1
during the first three laps and only 1.58 Ϯ 0.07 m·s
Ϫ1
during
the others (Table 4). On the other hand, the predicted
6-MWT distances by using the equations of Enright and
Sherill (10) and Gibbons et al. (14) were, respectively,
significantly lower (P Ͻ 0.01) and higher (P Ͻ 0.01) than
the real distance walked by our subjects during the 6-MWT.
On the contrary, no significant difference was noted be-
tween the Troosters et al. (26) predicted and the real dis-
tances. Figure 2 shows the measurement of the agreement
between these two values.
V
˙
O
2
recorded during the 6-MWT was significantly lower
in the first two 6-MWT than in the last one (P Ͻ 0.05, Table
2). The mean CV and SD for V
˙
O
2
, respectively, ranged from
7.1 to 8.7% and from 1.5 to 2.0 mL·kg
Ϫ1
·min
Ϫ1
(Table 3).
No significant difference was observed between morning
and afternoon (Table 2). Otherwise, HR was significantly
lower during the 6-MWT performed in the morning than in
the afternoon (test 3 vs test 4, P Ͻ 0.001, Table 2). The
mean CV and SD, respectively, reached 4.0% and 5.0
beats·min
Ϫ1
(Table 3). On the other hand, no HR difference
was noted between tests 1 and 3 performed in the morning
and tests 2, 4, and 5 performed in the afternoon (Table 2).
Concerning the metabolic analysis within the last 6-MWT,
V
˙
O
2
and HR did not change significantly from each 30-s
recording to the other, after, respectively, 2 and 2:30 min of
exercise. Nevertheless, a slight drift in HR is observed until
the end of the test (Table 4).
The 6-MWT intensity corresponded to 79.6 Ϯ 4.5% of
the V
˙
O
2max
, 85.8 Ϯ 2.5% of the HR
max
, and 78.0 Ϯ 6.3%
of the HR
reserve
. The 6-MWT V
˙
O
2
was significantly higher
than the ventilatory threshold in each subject (23.8 Ϯ 1.8 vs
19.5 Ϯ 0.9 mL·kg
Ϫ1
·min
Ϫ1
, P Ͻ 0.01).
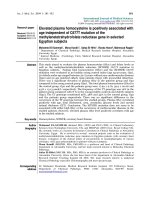
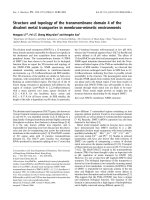
FIGURE 1—The calculated bias between the two first 6-min walk tests
(6-MWT) (i.e., between the first and second 6-MWT) and between the
two last 6-MWT (i.e., between the fourth and fifth 6-MWT).
TABLE 3. Comparison of the parameters recorded during the five 6-min walk test
(6-MWT): coefficients of variation (CV) and standard deviations (SD) between the
first and second 6-MWT (T1–T2), the second and third 6-MWT (T2–T3), the third
and fourth 6-MWT (T3–T4), and the fourth and fifth 6-MWT (T4 –T5).
T1–T2 T2–T3 T3–T4 T4–T5
Distance
CV (%) 5.0 3.3 1.7 2.4
SD (m) 26.6 18.3 10.0 13.5
V
˙
O
2
CV (%) 7.1 7.4 7.0 8.7
SD (mL⅐kg
Ϫ1
⅐min
Ϫ1
)
1.5 1.6 1.6 2.0
HR
CV (%) 7.6 5.3 4.0 3.3
SD (beats⅐min
Ϫ1
)
9.6 6.6 5.0 4.2
V
˙
O
2
, oxygen uptake; HR, heart rate.
TABLE 2. Values (mean Ϯ SE) of the parameters recorded during each 6-min walk test (6-MWT).
First 6-MWT Second 6-MWT Third 6-MWT Fourth 6-MWT Fifth 6-MWT
Distance (m) 524.8 Ϯ 19.0*** 545.0 Ϯ 21.2*** 564.4 Ϯ 20.1 563.4 Ϯ 18.8 570.1 Ϯ 22.7
Speed (m⅐s
Ϫ1
)
1.47 Ϯ 0.05*** 1.51 Ϯ 0.06*** 1.57 Ϯ 0.06 1.58 Ϯ 0.06 1.59 Ϯ 0.06
V
˙
O
2
(mL⅐kg
Ϫ1
⅐min
Ϫ1
)
22.0 Ϯ 1.2# 21.9 Ϯ 1.4# 23.2 Ϯ 1.7 23.1 Ϯ 1.2 23.8 Ϯ 1.8
% of the V
˙
O
2max
73.2 Ϯ 4.0# 73.4 Ϯ 3.3# 77.4 Ϯ 4.5 77.1 Ϯ 3.0 79.6 Ϯ 4.5
HR (beats⅐min
Ϫ1
)
123.9 Ϯ 4.8††† 127.4 Ϯ 5.0 121.8 Ϯ 4.1††† 128.2 Ϯ 4.1 130.3 Ϯ 4.4
% of the HR
max
80.0 Ϯ 3.0††† 83.9 Ϯ 2.7 80.4 Ϯ 3.0††† 84.8 Ϯ 2.6 85.8 Ϯ 2.5
Dyspnea 3.5 Ϯ 0.9 5.0 Ϯ 0.8 4.5 Ϯ 0.8 4.8 Ϯ 0.7 4.5 Ϯ 0.7
V
˙
O
2
, oxygen uptake; HR, heart rate.
*** P Ͻ 0.001, comparison between all the 6-MWT.
# P Ͻ 0.05, compared with the fifth 6-MWT.
††† P Ͻ 0.001 between morning and afternoon.
SIX-MINUTE WALK TEST IN HEALTHY ELDERLY PEOPLE Medicine & Science in Sports & Exercise
ா
171
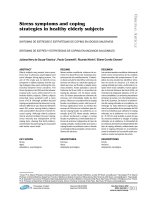
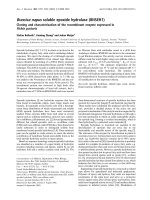
A significant correlation has been obtained between
V
˙
O
2max
and both anthropometric values and 6-MWT pa
-
rameters (r ϭ 0.97, r
2
ϭ 0.94, P Ͻ 0.01, SEE ϭ 177.6
mL·min
Ϫ1
): V
˙
O
2max
ϭ 2830.6 Ϫ (45.2 ϫ age) ϩ (4.70 ϫ
weight) ϩ (12.3 ϫ height) ϩ (1.75 ϫ distance) ϩ (0.309 ϫ
V
˙
O
2
) Ϫ(12.4 ϫ HR), with V
˙
O
2max
and V
˙
O
2
(mL·min
Ϫ1
),
age (yr), weight (kg), height (cm), distance (m), and HR
(beats·min
Ϫ1
).
Figure 3 illustrates the relationship between
the predicted and the real V
˙
O
2max
.
Mean dyspnea value measured after each 6-MWT was set
between 3.5 and 5, indicating a moderated dyspnea (Table 2).
DISCUSSION
This 6-MWT study is original and interesting in that it
focuses on the reliability, on a day-to-day and between
morning to afternoon basis, of the distance, and cardiore-
spiratory parameters measured in healthy subjects aged
60–70 yr. The main results indicate a good reliability of the
6-MWT only from the third test, concerning the distance,
walking speed, V
˙
O
2
, and % of the V
˙
O
2max
. Otherwise, HR
and % of the HR
max
are lower during the tests performed in
the morning. In this population, the 6-MWT represents a
submaximal exercise. Nevertheless, its intensity is always
greater than the individual ventilatory threshold.
The use of CV and SD in addition to classical statistical
analysis has been recommended to study a method’s reli-
ability (2). In this work, CV and SD for the distance de-
crease more than half between the first two and last two
6-MWT. This confirms that a familiarization to the 6-MWT
is required in healthy elderly subjects. After two 6-MWT,
the distance performed appears reproducible day to day and
between morning and afternoon. Figure 1 shows that only in
one subject the distance attained between the last two
6-MWT seems less reproducible. It can be explained by the
fact that in the fifth test, the subject has a tendency to run.
Moreover, this underscores that to obtain a good reliability,
the instructions for undertaking the 6-MWT must be well
explained and respected. Recently, Gibbons et al. (14) have
also been interested in the reliability of the 6-MWT. In their
study, a wide age range of healthy subjects performed four
6-MWT on the same day. However, no data or precisions
were given as to the time of day the tests were conducted,
and recordings of cardiorespiratory parameters were not
made. These authors noted a “learning effect” for the dis-
tance. Indeed, between their first and fourth tests, the dis-
tance increased by about 30 m, whereas the average differ-
ence between the last two 6-MWT was only 11 m. Thus, this
study and our results underscore the necessity of a famil-
iarization to the 6-MWT to limit the skill effect and to obtain
the best distance performed. Moreover, our data complete
that of Gibbons et al. (14), as they show that at least two
familiarization tests are required. Otherwise, it can be noted
that in CHF and COPD patients, respectively, the distances
walked appear reliable after one and two attempts (8,16,22).
The dyspnea and/or fatigue perceptions or the psychological
factors could explain this slight divergence obtained in our
data from healthy subjects.
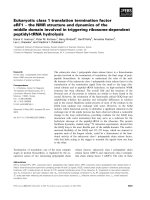
FIGURE 2—Measurement of the concordance between the Troost-
ers et al. (26) predicted 6-MWT distance and the real distance
performed by our participants during the 6-min walk test, express-
ing the individual differences in distance versus the individual
means in distance.
TABLE 4. Values (mean Ϯ SE) of the walking speed and metabolic parameters
recorded, respectively, lap by lap and 30 s by 30 s during the fifth 6-min walk test
(6-MWT), * P Ͻ 0.05 and ** P Ͻ 0.01 compared with the following lap or
30-s recording.
Lap by
Lap
Walking
Speed (m⅐s
؊1
)
30-s
Recordings
V
˙
O
2
(mL⅐kg
؊1
⅐min
؊1
)
HR
(beats⅐min
؊1
)
1 1.63 Ϯ 0.07* 1 9.5 Ϯ 0.5** 106.7 Ϯ 3.1**
2 1.65 Ϯ 0.06* 2 16.1 Ϯ 0.8** 115.9 Ϯ 3.4**
3 1.61 Ϯ 0.07 3 21.4 Ϯ 1.4** 122.6 Ϯ 3.6*
4 1.60 Ϯ 0.08 4 23.5 Ϯ 1.6 125.1 Ϯ 4.1*
5 1.59 Ϯ 0.07 5 23.5 Ϯ 1.1 127.1 Ϯ 4.3
6 1.57 Ϯ 0.07 6 23.4 Ϯ 1.4 127.3 Ϯ 4.2
7 1.59 Ϯ 0.07 7 23.6 Ϯ 1.4 127.2 Ϯ 4.3
8 1.55 Ϯ 0.07 8 23.6 Ϯ 1.5 127.9 Ϯ 4.3
9 1.54 Ϯ 0.06 9 23.7 Ϯ 1.7 128.7 Ϯ 4.4
10 1.56 Ϯ 0.07 10 23.4 Ϯ 1.8 129.1 Ϯ 4.3
11 1.56 Ϯ 0.07 11 23.5 Ϯ 1.7 129.9 Ϯ 4.3
12 1.55 Ϯ 0.06 12 23.7 Ϯ 1.6 130.6 Ϯ 4.4
V
˙
O
2
, oxygen uptake; HR, heart rate.
FIGURE 3—Predicted maximal oxygen uptake (V
˙
O
2max
) against real
V
˙
O
2max.
The line of identity (
___
) and the 95% confidence intervals
(- - -) are plotted.
172
Official Journal of the American College of Sports Medicine
The distances covered in our study can be compared to
both the predicted values (10,14,26) and the real distances
already assessed in other healthy populations (10,14,19,26).
In our subjects, the best prediction was obtained with the
Troosters et al. (26) formula. However, as the confidence
interval of the difference was around 50 m, the agreement
between the predicted and real distances is limited. In ad-
dition and similarly when using the Enright and Sherill (10)
formula, most of the distances predicted were lower than
those measured. Conversely, the use of the Gibbons et al.
(14) equation overestimated the distances performed by our
subjects. Concerning the real 6-MWT distance, discrepan-
cies also exist in the literature as it does in our study
compared with others (10,14,19,26). Several hypotheses can
be suggested to explain all these discrepancies. Gender is a
well-established factor of the 6-MWT distance variation
(10,14,26). In our study, given that the proportion between
men and women is similar to the other works (almost
50%-50%), the gender factor cannot be thought to explain
the divergence. Height and age have been recently reported
as the essential determinants of the 6-MWT distance
(10,14,26). A taller height is associated with a longer stride
and a more efficient walk (10). The relatively smaller height
and higher age of our subjects compared with those of other
populations might result in the lower distance walked
(14,19,26). Moreover, in our study, some factors concerning
the 6-MWT protocol, such as the regular walking pace and
the familiarization, could also explain the discrepancy with
all studies (10,14,19,26). Finally, the length of the corridor
could also influence the performance. Indeed, too many laps
could imply a loss of energy and thus decrease the distance
walked. Nevertheless, it is important to note that our sub-
jects continued to walk at each turn. In two studies, the
corridor was longer than ours (10,26), whereas it was similar
in two others (14,19). Thus, this discussion underscores that
the discrepancy between all 6-MWT distances published is
multifactorial.
To the best of our knowledge, this study is the first to
analyze the gas exchanges during the 6-MWT in healthy
people. It obviously produces more relevant physiological
data. The increase in V
˙
O
2
during the first two 6-MWT can
be explained by a higher energy requirement for a higher
distance walked. After the familiarization period, V
˙
O
2
is
reliable, with satisfactory CV and SD. Indeed, as the por-
table system’s measurement error is about 5% (12,17), the
mean CV and SD for the V
˙
O
2
appears to be low. Otherwise,
concerning the 6-MWT relative intensity, Troosters et al.
(26) using the predicted HR
max
, have proposed that the
6-MWT represents a submaximal exercise in healthy sub-
jects. In our study, the gas exchanges analysis showed that
the 6-MWT intensity was significantly higher than the ven-
tilatory threshold. Thus, our result confirmed that the
6-MWT is a submaximal test of quite a high level of
intensity (80% of the V
˙
O
2max
), which could be in favor of
a preliminary medical and particularly cardiovascular
screening in this population.
When the 6-MWT were performed at the same time of
day, HR shows a good reliability, with weak CV and SD
values (tests 4 and 5, Table 3). Conversely, several ex-
ternal and internal factors can influence the daily varia-
tions of the exercise adaptation in healthy subjects. Thus,
the higher HR values observed during the 6-MWT per-
formed in the afternoon than in the morning can be
partially explained by the diurnal fluctuations in adren-
ergic activity and body temperature (1,13). Our results
show that the 6-MWT must be performed always at the
same time of day (i.e., either in the morning or in the
afternoon) to assess the evolution of cardiac parameters
during a physical capacity follow-up.
Our study indicates that during the fifth 6-MWT, subjects
stabilized their walking pace from the third lap. According
to the reference values for the walking speed determined
recently by Bohannon (6), they walked between their com-
fortable and maximum pace. Moreover, during this time-
limited self-controlled test (22), our subjects selected a
comfortable ventilatory rate, as shown by moderate dyspnea
scores. They also attained a steady state for the V
˙
O
2
values,
with a weak drift for the HR values.
Some potential limitations of our study should be con-
sidered. First, we studied a relatively small sample size of
population composed of both men and women. Therefore,
our results require confirmation in a larger population of
each gender. Second, the use of an 18-m corridor, which
induces numerous laps (14,26), could lead to an underesti-
mation of the distance walked during the 6-MWT and to an
overestimation of the familiarization period. To verify this
hypothesis, it would be interesting to conduct the familiar-
ization period using the same sample of population on
different corridor lengths or on a continuous track. How-
ever, we show that the V
˙
O
2
reliability needs also a famil
-
iarization period, and, as suggested by others (14), the
influence of the 6-MWT repetition seems to be much greater
than the influence of the corridor length. Moreover, in our
opinion, the main point is to perform the 6-MWT in well-
standardized conditions to compare groups of subjects or to
assess the effects of a physical training. Finally, given the
weak number of subjects included in this study, the equation
proposed to predict V
˙
O
2max
must be used with precaution.
Furthermore, it needs to be validated in a greater sample of
healthy elderly subjects.
In conclusion, two familiarization 6-MWT are required to
obtain a good reliability in healthy subjects aged 60–70 yr.
The 6-MWT daily schedule depends upon studied parame-
ters. Indeed, the time of day must be taken into account
when assessing HR. The 6-MWT is well tolerated in this
population. Nevertheless, it is performed above the ventila-
tory threshold. After familiarization, its high reliability
makes it interesting for assessing functional capacity in
healthy subjects having a regular physical activity.
Preliminary results of this work have been presented in an oral
communication at the third congress of muscular physiology (Cler-
mont-Ferrand, 2001).
We gratefully thank the medical and technical staff of the Center
Cardio-Pneumologique (Rennes) and the volunteers for their gener-
ous cooperation with our project. English proofreading and rewriting
were done by David James.
SIX-MINUTE WALK TEST IN HEALTHY ELDERLY PEOPLE Medicine & Science in Sports & Exercise
ா
173
REFERENCES
1. ALDEMIR, H., G. ATKINSON,T.CABLE,B.EDWARDS,J.WATERHOUSE,
and T. R
EILLY. A comparison of the immediate effects of moderate
exercise in the early morning and late afternoon on core temper-
ature and cutaneous thermoregulatory mechanisms. Chronobiol.
Int. 17:197–207, 2000.
2. A
TKINSON, G., and A. M. NEVILL. Statistical methods for assessing
measurement error (reliability) in variables relevant to sports med-
icine. Sports Med. 26:217–238, 1998.
3. B
EAVER, W. L., K. WASSERMAN, and B. J. WHIPP. A new method for
detecting anaerobic threshold by gas exchange. J. Appl. Physiol.
60:2020–2027, 1986.
4. B
ITTNER, V., D. H. WEINER,S.YUSSUF, et al. for the SOLVD
investigators. Prediction of mortality and morbidity with a six
minute walk test in patients with left ventricular dysfunction.
JAMA 270:1702–1707, 1993.
5. B
LAND, J. M., and D. G. ALTMAN. Statistical methods for assessing
agreement between two methods of clinical measurement. Lancet
8:307–310, 1986.
6. B
OHANNON, R. W. Comfortable and maximum walking speed of
adults aged 20–79 years: reference values and determinants. Age
Ageing 26:15–19, 1997.
7. B
OND, A., and M. LADER. The use of analogue scales in rating
subjective feelings. Br. J. Med. Psychol. 47:211–218, 1974.
8. B
UTLAND, R. J., J. PANG,E.R.GROSS,A.A.WOODCOCK, and D. M.
G
EDDES. Two-, six-, and 12-minute walk tests in respiratory dis-
ease. Br. Med. J. 284:1607–1608, 1982.
9. C
AHALIN, L. P., M. A. MATHIER,M.J.SEMIGRAN,G.W.DEC, and
T. G. D
ISALVO. The six-minute walk test predicts peak oxygen
uptake and survival in patients with advanced heart failure. Chest
110:325–332, 1996.
10. E
NRIGHT, P. L., and D. L. SHERILL. Reference equations for the
six-minute walk in healthy adults. Am. J. Respir. Crit. Care Med.
158:1384–1387, 1998.
11. F
ABRE, C., J. MASS
´
E-BIRON,S.AHMAIDI,B.ADAM, and C. PR
´
EFAUT.
Effectiveness of individualized aerobic training at the ventilatory
threshold in the elderly. J. Gerontol. A. Biol. Sci. Med. Sci.
52:B260–B266, 1997.
12. F
AINA, M., R. PISTELI,G.FRANZOSO,G.PETRELLI, and A. DAL
MONTE. Validity and reliability of a new telemetric portable sys-
tem with CO
2
analyzer (Cosmed K4). In: Proceedings of the First
Annual Congress Frontiers in Sports Science: The European Per-
spective, P. Marconnet, J. Gaulard, I. Margaritis, and F. Tessier
(Eds.). Nice, 1996, pp. 572–573.
13. G
IACOMONI, M., T. BERNARD,O.GAVARRY,S.ALTARE, and G.
F
ALGAIRETTE. Diurnal variations in ventilatory and cardiorespira-
tory responses to submaximal treadmill exercise in females. Eur.
J. Appl. Physiol. 80:591–597, 1999.
14. G
IBBONS, W. J., N. FRUTCHER,S.SLOAN, and R. D. LEVY. Reference
values for a multiple repetition six-minute walk test in healthy
adults older than 20 years. J. Cardiopulm. Rehabil. 21:87–93,
2001.
15. G
LUER, C., G. BLAKE,Y.LU,A.BLUNT,M.JERGAS, and H. K.
G
ENANT. Accurate assessment of precision errors: how to measure
the reliability of bone densitometry techniques. Osteoporos. Int.
5:262–270, 1995.
16. G
UYATT, G. H., M. J. SULLIVAN,P.L.THOMPSON, et al. The six
minute walk: a new measure of exercise capacity in patients with
chronic heart failure. Can. Med. Assoc. J. 132:919–923, 1985.
17. H
AUSSWIRTH, C., A. X. BIGARD, and J. M. LE CHEVALIER. The
Cosmed K4 telemetry system as an accurate device for oxygen
uptake measurements during exercise. Int. J. Sports Med. 18:449–
453, 1997.
18. K
ARVONEN, M. J., E. KENTALA, and O. MUSTALA. The effects of
training heart rate: a longitudinal study. Ann. Med. Exp. Biol.
Fenn. 35:307–315, 1957.
19. L
IPKIN, D. P., A. J. SCRIVEN,T.CRAKE, and P. A. POOLE-WILSON.
Six minute walk test for assessing exercise capacity in chronic
heart failure. Br. Med. J. 292:653–655, 1986.
20. M
AIORANA, A., G. O’DRISCOLL,L.DEMBO,C.GOODMAN,R.TAY-
LOR, and D. GREEN. Exercise training, vascular function, and func-
tional capacity in middle-aged subjects. Med. Sci. Sports Exerc.
33:2022–2028, 2001.
21. M
EYER, K., M. SCHWAIBOLD,S.WESTBROOK, et al. Effects of
exercise training and activity restriction on six minute walk test
performance in patients with chronic heart failure. Am. Heart J.
133:447–453, 1997.
22. M
ORALES, F. J., A. MARTINEZ,M.MENDEZ, and A. AGARRADO.A
shuttle walk test for assessment of functional capacity in chronic
heart failure. Am. Heart J. 138:291–298, 1999.
23. P
AGE, E., J. L. BONNET, and C. DURAND. Comparison of metabolic
expenditure during CAEP versus a test adapted to aerobic capacity
(harbor test) in elderly healthy subjects. Pacing Clin. Electro-
physiol. 23:1772–1777, 2000.
24. R
OSTAGNO, C., G. GALANTI,M.COMEGLIO,V.BODDI, and G. OLIVO.
Comparison of different methods of functional evaluation in pa-
tients with chronic heart failure. Eur. J. Heart Fail. 2:273–280,
2000.
25. T
ERAMOTO, S., E. OHGA,T.ISHII,Y.YAMAGUCHI,H.YAMAMOTO,
and T. M
ASTSUSE. Reference value of six-minute walk distance in
healthy middle-aged and older subjects. Eur. Respir. J. 15:1132–
1133, 2000.
26. T
ROOSTERS, T., R. GOSSELINK, and M. DECRAMER. Six minute walk
distance in healthy elderly subjects. Eur. Respir. J. 14:270–274,
1999.
27. V
OORIPS, L. E., A. C. J. RAVELLI,P.C.A.DONGELMANS,P.DU-
RENBERG, and W. A. VAN STARVEREN. A physical activity question-
naire for the elderly. Med. Sci. Sports Exerc. 23:974–979, 1991.
28. W
ASSERMAN,K.Principles of Exercise Testing and Interpretation.
Baltimore: Lippincott Williams & Wilkins, 1999, pp. 73–76.
29. Z
UGCK, C., C. KR
¨
UGER,S.Du¨RR, et al. Is the 6-minute walk test a
reliable substitute for peak oxygen uptake in patients with dilated
cardiomyopathy? Eur. Heart J. 21:540–549, 2000.
174
Official Journal of the American College of Sports Medicine