Analysis of the atmospheric distribution, sources, and sinks of oxygenated volatile organic chemicals based on measurements over the Pacific during TRACE-P pdf
Bạn đang xem bản rút gọn của tài liệu. Xem và tải ngay bản đầy đủ của tài liệu tại đây (726.11 KB, 20 trang )
Analysis of the atmospheric distribution, sources, and sinks
of oxygenated volatile organic chemicals based on
measurements over the Pacific during TRACE-P
H. B. Singh,
1
L. J. Salas,
1
R. B. Chatfield,
1
E. Czech,
1
A. Fried,
2
J. Walega,
2
M. J. Evans,
3
B. D. Field,
3
D. J. Jacob,
3
D. Blake,
4
B. Heikes,
5
R. Talbot,
6
G. Sachse,
7
J. H. Crawford,
7
M. A. Avery,
7
S. Sandholm,
8
and H. Fuelberg
9
Received 18 June 2003; revised 14 October 2003; accepted 7 November 2003; published 3 June 2004.
[1] Airborne measurements of a large number of oxygenated volatile organic chemicals
(OVOC) were carried out in the Pacific troposphere (0.1–12 km) in winter/spring of
2001 (24 February to 10 April). Specifically, these measurements included acetone
(CH
3
COCH
3
), methylethyl ketone (CH
3
COC
2
H
5
, MEK), methanol (CH
3
OH), ethanol
(C
2
H
5
OH), acetaldehyde (CH
3
CHO), propionaldehyde (C
2
H
5
CHO), peroxyacylnitrates
(PANs) (C
n
H
2n+1
COO
2
NO
2
), and organic nitrates (C
n
H
2n+1
ONO
2
). Complementary
measurements of formaldehyde (HCHO), methyl hydroperoxide (CH
3
OOH), and
selected tracers were also available. OVOC were abundant in the clean troposphere and
were greatly enhanced in the outflow regions from Asia. Background mixing ratios were
typically highest in the lower troposphere and declined toward the upper troposphere
and the lowermost stratosphere. Their total abundance (SOVOC) was nearly twice
that of nonmethane hydrocarbons (SC
2
-C
8
NMHC). Throughout the troposphere, the
OH reactivity of OVOC is comparable to that of methane and far exceeds that of
NMHC. A comparison of these data with western Pacific observations collected some
7 years earlier (February–March 1994) did not reveal significant differences. Mixing
ratios of OVOC were strongly correlated with each other as well as with tracers of fossil
and biomass/biofuel combustion. Analysis of the relative enhancement of selected
OVOC with respect to CH
3
Cl and CO in 12 plumes originating from fires and sampled in
the free troposphere (3–11 km) is used to assess their primary and secondary
emissions from biomass combustion. The composition of these plumes also indicates a
large shift of reactive nitrogen into the PAN reservoir thereby limiting ozone formation.
A three-dimensional global model that uses state of the art chemistry and source
information is used to compare measured and simulated mixing ratios of selected
OVOC. While there is reasonable agreement in many cases, measured aldehyde
concentrations are significantly larger than predicted. At their observed levels,
acetaldehyde mixing ratios are shown to be an important source of HCHO (and HO
x
)
and PAN in the troposphere. On the basis of presently known chemistry, measured
mixing ratios of aldehydes and PANs are mutually incompatible. We provide
rough estimates of the global sources of several OVOC and conclude that collectively
these are extremely large (150–500 Tg C yr
1
) but remain poorly quantified. INDEX
TERMS: 0315 Atmospheric Composition and Structure: Biosphere/atmosphere interactions; 0322
Atmospheric Composition and Structure: Constituent sources and sinks; 0317 Atmospheric Composition and
Structure: Chemical kinetic and photochemical properties; 0365 Atmospheric Composition and
5
Center for Atmospheric Chemistry Studies, Graduate School of Ocean-
ography, University of Rhode Island, Narragansett, Rhode Island, USA.
6
Institute for the Study of Earth, Oceans, and Space, University of New
Hampshire, Durham, New Hampshire, USA.
7
NASA Langley Research Center, Hampton, Virginia, USA.
8
School of Earth and Atmospheric Sciences, Georgia Institute of
Technology, Atlanta, Georgia, USA.
9
Meteorology Department, Florida State University, Tallahassee,
Florida, USA.
JOURNAL OF GEOPHYSICAL RESEARCH, VOL. 109, D15S07, doi:10.1029/2003JD003883, 2004
1
NASA Ames Research Center, Moffett Field, California, USA.
2
Atmospheric Chemistry Division, National Center for Atmospheric
Research, Boulder, Colorado, USA.
3
Division of Applied Sciences, Harvard University, Cambridge,
Massachusetts, USA.
4
Department of Chemistry, University of California, Irvine, California,
USA.
Copyright 2004 by the American Geophysical Union.
0148-0227/04/2003JD003883$09.00
D15S07 1of20
Structure: Troposphere—composition and chemistry; 0368 Atmospheric Composition and Structure:
Troposphere—constituent transport and chemistry; K
EYWORDS: oxygenated organics, PANs, acetone
Citation: Singh, H. B., et al. (2004), Analysis of the atmospheric distribution, sources, and sinks of oxygenated volatile organic
chemicals based on measurements over the Pacific during TRACE-P, J. Geophys. Res., 109, D15S07, doi:10.1029/2003JD003883.
1. Introduction
[2] In recent years it has become evident that significant
concentrations of a large number of oxygenated organic
chemicals (OVOC) are present in the global troposphere
[Singh et al., 2001; Wisthaler et al., 2002]. While the role of
formaldehyde (HCHO) as a product of methane oxidation
has been studied for over two decades, interest in other
OVOC is relatively new. These chemicals are expected to
play an important role in the chemistry of the atmosphere.
For example, acetone can influence ozone chemistry by
sequestering nitrogen oxides (NO
x
) in the form of peroxy-
acetylnitrates (PAN) and by providing HO
x
free radicals in
critical regions of the atmosphere [Singh et al., 1994, 1995;
McKeen et al., 1997; Wennberg et al., 1998; Jaegle et al.,
2001]. OVOC may also contribute to organic carbon in
aerosol via cloud interactions and processes of polymeriza-
tion [Li et al., 2001; Jang et al., 2002; Tabazadeh et al.,
2004]. OVOC are believed to have large terrestrial sources,
but our quantitative knowledge about these is rudimentary
[Singh et al., 1994; Guenther et al., 1995, 2000; Fall, 1999,
also manuscript in preparation, 2003; Jacob et al., 2002;
Galbally and Kirstine, 2002; Heikes et al., 2002]. Attempts
to reconcile atmospheric observations with known sources
have led to suggestions that oceanic sources may be quite
significant, although no direct evidence is presently avail-
able [de Laat et al., 2001; Singh et al., 2001, 2003b; Jacob
et al., 2002].
[
3] The spring 2001 TRACE-P study utilized the NASA
DC-8 flying laboratory to measure a large number of
OVOC and chemical tracers in the polluted and unpolluted
Pacific troposphere. An overview of the mission payload,
flight profiles, and prevalent meteorological conditions has
been provided by Jacob et al. [2003] and Fuelberg et al.
[2003]. Here we investigate and analyze the distribution
of oxygenated chemicals in the troposphere and the
lowermost stratosphere, and use their relationships with
select tracers along with models to assess their sources
and fate.
2. Experimental Methods
[4] Results presented here are principally based on mea-
surements carried out by the NASA Ames group aboard the
NASA DC-8 aircraft using the PANAK (PAN-Aldehydes-
Alcohols-Ketones) instrument package. PANAK, a three-
channel gas chromatographic instrument equipped with
capillary columns and multiple detectors, was u sed to
measure oxygenated species and selected tracers. Specifi-
cally, these measurements included acetone (CH
3
COCH
3
,
propanone), methylethyl ketone (CH
3
COC
2
H
5
, butanone,
MEK), methanol (CH
3
OH), ethanol (C
2
H
5
OH), acetalde-
hyde (CH
3
CHO, ethanal), propionaldehyde (C
2
H
5
CHO,
propanal), PANs, (C
n
H
2n+1
COO
2
NO
2
, peroxyacyl nitrates),
and alkyl nitrates (C
n
H
2n+1
ONO
2
). The instrument was also
adapted to measure HCN and CH
3
CN, both tracers of
biomass combustion, and these results are discussed else-
where [Singh et al., 2003a]. The basic instrument has
been previously described and details are not repeated here
[Singh et al. , 2000, 2001]. Briefly, PAN, peroxypropionyl
nitrate (PPN), alkyl nitrates, and C
2
Cl
4
, were separated on
two gas chromatograph (GC) columns equipped with
electron capture detectors; while carbonyls, alcohols, and
nitriles were measured on the third column in which a
photoionization detector (PID) and a reduction gas detec-
tor (RGD) were placed in series. Ambient air was
sampled via a back facing probe and drawn through a
Teflon manifold at a flow rate of 5 standard liters min
1
.
Typically, a 200 mL aliq uot of air was cryogenically
trapped at 140°C prior to analysis. For carbonyl/alcohol/
nitrile analysis, moisture was greatly reduced by passing
air through a water trap held at 40°C during sampling
and 50°C between samples. Laboratory tests were per-
formed to ensure the integrity of oxygenates during this
drying process. The calibration standards were added to
the ambient air stream in the main manifold and were
analyzed in a manner that was identical to normal
ambient sampling. This procedure was designed to com-
pensate for any line losses. It was possible to obtain near
zero backgrounds when sampling ultra purified air. PAN
standard mixtures in air were obtained from a PAN/n-
tridecane mixture in a diffusion tube held at 0°C. Both
permeation tubes and pressurized cylinders were used to
obtain standards for carbonyls, alcohols, and alkyl
nitrates. A dilution system on board allowed varied
concentrations to be prepared. The sensitivity of detection
of reactive nitrogen species was 1 ppt, while that of
other oxygenates was 5–20 ppt. Overall measurement
precision and accuracy are estimated to be ±10% and
±20%, respectively, except perhaps for >C
1
aldehydes.
There was indication of artifact OVOC formation under
high O
3
concentrations in the stratosphere. Subsequent
laboratory tests showed that for the typical O
3
levels
encountered in the troposphere during TRACE-P (10–
100 ppb), enhancements due to this artifact were probably
small (0–20%), and no corrections to the data have been
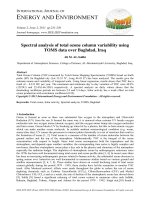
applied. A chromatogram showing the separation and
detection of alcohols and carbonyls from ambient air is
shown in Figure 1. Other chemicals considered in this
study include HCHO and CH
3
OOH whose measurement
methods have also been previously described [Fried et
al., 2003; O’Sullivan et al., 2004]. In addition, a large
number of nonmethane hydrocarbons (NMHCs), as well
as tracers of urban pollution (e.g., CO, C
2
Cl
4
), biomass
combustion (e.g., CH
3
Cl), and marine emissions (e.g.,
CHBr
3
), were analyzed from pressurized canister samples
[Blake et al., 1999].
3. Results and Discussion
[5] In this study we analyze and interpret measurements
of carbonyls, alcohols, and organic peroxides performed
D15S07 SINGH ET AL.: OXYGENATED ORGANICS IN THE ATMOSPHERE
2of20
D15S07
aboard the NASA DC-8 during TRACE-P. Some of these
measurements were duplicated using independent tech-
niques and have been discussed further by Eisele et al.
[2003]. In the analysis that follows, we use measurements
of >C
1
carbonyls and alcohol from the NASA Ames group,
HCHO from the NCAR group [Fried et al., 2003], and
CH
3
OOH from the University of Rhode Island group [Lee
et al., 1995; O’Sullivan et al., 2004]. This somewhat
subjective selection took into account factors such as known
shortcomings in techniques and anomalous data behavior
against known tracers. To relate measurements acquired at
differing frequencies, merged data files were created. In
much of the analysis that follows, the 5-min merged data set
has been used. When appropriate, the Pacific region has
been divided into areas representing the western Pacific
(longitude 100 –180°E) and central eastern Pacific (longi-
tude 160–240°E). Unless noted otherwise, only data from
the troposphere are considered. A convenient filter (O
3
>
100 ppb for z > 10 km; also CO < 50 ppb) was used to
remove stra tospheric influences. We used methyl chloride
(CH
3
Cl), potassium, and HCN as tracers of biomass com-
busti on and CO as a more generic tracer of pollution.
Although CH
3
Cl is known to have a diffuse oceanic and
possibly biogenic source [Butler, 2000], it was possible to
use it as a tracer of biomass combustion in discreet
plumes downwind of terrestrial sources. Tetrachloroethylene
(C
2
Cl
4
), a synthetic organic chemical, was mainly used as a
tracer of urban pollution. When appropria te, an arbitrary
‘‘pollution filter’’ based on the lower two quartiles of the CO
and C
2
Cl
4
mixing ratios was employed to mitigate the effect
of pollution. Figure 2 shows the CO mixing ratios as a
function of latitude and their frequency distribution with and
without this pollution filter. This filter eliminated all major
pollution influences and r esulted in mean tropospheric
mixing ratios of 102(±20) ppb/CO and 3(±1) ppt/C
2
Cl
4
and is assumed to represent near-background conditions.
[
6] The analysis of OVOC measurements is further
facilitated by the use of the GEOS-CHEM three-dimensional
(3-D) global model. Here the troposphere is divided into
20 vertical layers, and the model has a horizontal resolution
of 2° latitude 2.5° longitude. The model uses assimilated
meteorology from the NASA Global Modeling and Assim-
ilation Office and includes an extensive representation of
ozone-NO
x
-VOC chemistry (80 species, 300 reac tions).
The model simulations were conducted for the TRACE-P
period, and model results were sampled along the aircraft
flight tracks. More details about the GEOS-CHEM model
and its applications can be found elsewhere [Bey et al.,
2001; Jacob et al., 2002; Staudt et al., 2003; Heald et al.,
2003]. The 3-D model simulations were available along the
flight tracks for the entire TRACE-P period. An updated
version of an earlier 1-D model [ Chatfield et al., 1996] with
Figure 1. Chromatogram showing the separation and detection of oxygenated organic species in
ambient air.
D15S07 SINGH ET AL.: OXYGENATED ORGANICS IN THE ATMOSPHERE
3of20
D15S07
detailed C
1
-C
4
hydrocarbon chemistry was also employed
as an exploratory tool to s tudy the potential role of
CH
3
CHO in atmospheric chemistry.
3.1. Atmospheric Distributions
3.1.1. TRACE-P Measurements and 3-D Model
Simulations
[
7] Tropospheric mixing ratios (mean, median, and s)of
important OVOC and select tracers measured in this study
are presented in Table 1. Mixing ratios are shown with a
2-km vertical resolution with and without the pollution filter
described above. A dramatic effect of the pollution filter can
be seen in PAN whose median marine boundary layer
(MBL, 0–2 km) mixing ratios declined from 165 to 2 ppt
(Table 1). Except in the case of CH
3
OOH, mixing ratios of
OVOC were elevated under polluted conditions. CH
3
OOH
is an exception whose mixing rat ios are lowe r under
polluted conditions (Table 1). This is not surprising as its
synthesis is most efficient under low NO
x
conditions,
typically associated with unpolluted air [Lee et al., 2000].
Mean mixing ratios of all of the measured OVOC with the
pollution filter are presented in Figure 3a in 1 km altitude
bins. Methanol and CH
3
COCH
3
are clearly the most abun-
dant with median concentrations of 649 and 537 ppt,
respectively. However, sizable concentrations of a host of
other oxygenates are present. CH
3
OOH mixing ratios are
large in the marine boundary layer (MBL, 0–2 km) and
decline rapidly in the free troposphere. In the free tropo-
sphere, total alkyl nitrates (TAN, SRONO
2
) and PPN
mixing ratios are quite small, and nearly 90% of the organic
reactive nitrogen is contained in the form of PAN. Although
MEK has been previously measured in urban and rural
environments [Grosjean, 1982; Snider and Dawson, 1985;
Fehsenfeld et al., 1992; Goldan et al., 1995; Solberg et al.,
1996; Riemer et al., 1998], these are its first measurements
in the remote troposphere. Its median abun dance of 20 ppt
in the clean troposphere is a small fraction of CH
3
COCH
3
(537 ppt).
[
8] An unusual finding from Figure 3a is that large
mixing ratios of CH
3
CHO, exceeding those of HCHO, are
found to be present. We also report the first tropospheric
profile of C
2
H
5
CHO. Me asurements of CH
3
CHO and
C
2
H
5
CHO in the free troposphere from other regions vary
from sparse to nonexistent. However, CH
3
CHO data from
the MBL have been published from a number of locations
utilizing a variety of measurement techniques. Mean
CH
3
CHO mixing ratios of 100– 400 ppt in the MBL have
been reported from the northern and southern Pacific [Singh
et al., 1995, 2001], the Atlantic [Zhou and Mopper, 1993;
Arlander et al. , 1995; Tanner et al., 1996], and the Indian
Ocean [Wisthaler et al., 2002]. Not all the methods used are
equally reliable, and the wet chemical derivative methods
are often prone to interferences. Wisthaler et al. [2002],
using a new mass spectrometric technique, report MBL
mixing ratios of 212 ± 29 ppt and 178 ± 30 ppt from the
northern (0–20°N) and southern (0–15°S) Indian Ocean,
respectively, under the cleanest conditions. This can be
compared with the pollution-filtered MBL (0– 2 km) mixing
ratios of 204 ± 40 ppt measured in this study over the
Northern Hemisphere Pacific (Table 1). The ensemble of
observations supports the view that substantial CH
3
CHO
concent rations are pres ent throughout the global tr opo-
sphere. No comparable measurements of C
2
H
5
CHO are
available. As we shall see later, C
2
H
5
CHO and CH
3
CHO
behave very similarly, and it is likely that C
2
H
5
CHO is also
globally ubiquitous albeit at lower mixing ratios (MBL 68 ±
24 ppt).
[
9] Collectively, these OVOC are nearly twice as abun-
dant as all C
2
-C
8
hydrocarbons combined (Figure 3b). On
the basis of these measurements and the kinetic data
available from R. A tkinson et al. (IUPAC evaluated
kinetic data, 2002, available at http://ww w.iupac-kinetic.
ch.cam.ac.uk/) and S. P. Sander et al. (Chemical kinetics
and photochemical data for use in stratospheric modeling,
Evaluation 14, JPL 02-25, available at http:// jpldatae-
val.jpl.nasa.gov/, 2002), we calculate that the OH oxida-
tion rate of OVOC (SC
ovoci
OH k
OHi
)inthe
troposphere is comparable to that of methane (C
CH4
OH k
OHCH
4
) and some 5 times larger than that of NMHC
(SC
NMHCi
OH k
OHi
). Compared to NMHC, mixing
Figure 2. Effect of the pollution filter used in this study on CO mixing ratios. (left) CO data that were
excluded (red circles). The blue data and the line represent the background CO profile assumed in this
study. (right) CO frequency distribution with and without the pollution filter.
D15S07 SINGH ET AL.: OXYGENATED ORGANICS IN THE ATMOSPHERE
4of20
D15S07
Table 1. Mean Concentrations of Selected Oxygenated Organic Species and Tracers in the Pacific Troposphere
Altitude, km
Acetone,
a
ppt
MEK,
ppt
CH
3
OH,
ppt
C
2
H
5
OH,
ppt
CH
3
CHO,
ppt
C
2
H
5
CHO,
ppt
HCHO,
ppt
CH
3
OOH,
ppt
PAN,
ppt
PPN,
ppt
CO,
ppb
C
2
Cl
4
,
ppt
Tropical Data, No Filter
0 –2 816 ± 500
(722, 251)
125 ± 145
(81, 251)
1096 ± 1246
(765, 249)
165 ± 246
(75, 197)
371 ± 416
(286, 240)
140 ± 186
(104, 251)
469 ± 681
(326, 382)
417 ± 387
(263, 311)
382 ± 566
(165, 301)
30 ± 29
(23, 224)
194 ± 89
(173, 428)
10 ± 9
(9, 393)
2 –4 822 ± 295
(769, 177)
75 ± 52
(64, 177)
1250 ± 691
(1014, 177)
77 ± 69
(47, 139)
226 ± 89
(203, 169)
77 ± 34
(69, 177)
188 ± 133
(165, 264)
364 ± 246
(306, 200)
196 ± 213
(128, 237)
11 ± 13
(7, 174)
151 ± 54
(131, 281)
7±6
(6, 264)
4 –6 725 ± 267
(723, 126)
65 ± 55
(47, 122)
1044 ± 551
(903, 126)
73 ± 70
(45, 87)
173 ± 74
(159, 121)
58 ± 24
(54, 126)
101 ± 69
(88, 175)
265 ± 134
(241, 136)
206 ± 217
(139, 171)
12 ± 14
(7, 109)
131 ± 46
(116, 218)
5±3
(4, 200)
6 –8 685 ± 278
(656, 146)
56 ± 44
(45, 129)
925 ± 533
(852, 146)
56 ± 49
(39, 85)
127 ± 53
(121, 142)
45 ± 18
(43, 144)
83 ± 58
(73, 186)
190 ± 100
(172, 118)
185 ± 146
(156, 195)
9±9
(6, 124)
119 ± 40
(110, 229)
4±2
(4, 220)
8 –10 660 ± 280
(629, 206)
36 ± 27
(26, 178)
973 ± 681
(815, 206)
61 ± 49
(41, 96)
104 ± 47
(94, 187)
41 ± 17
(38, 187)
69 ± 41
(60, 238)
194 ± 148
(149, 135)
175 ± 158
(123, 266)
7±7
(4, 129)
120 ± 44
(108, 314)
3±2
(3, 294)
10 –12 559 ± 286
(437, 132)
38 ± 25
(31, 81)
777 ± 703
(464, 132)
69 ± 54
(45, 49)
79 ± 45
(64, 123)
33 ± 14
(30, 88)
51 ± 37
(41, 143)
154 ± 89
(130, 76)
111 ± 134
(70, 168)
6±
4 (4, 49)
102 ± 36
(86, 206)
2±1
(2, 199)
0 –12 724 ± 358
(669, 1038)
74 ± 90
(54, 938)
1027 ± 839
(818, 1036)
97 ± 151
(48, 653)
199 ± 239
(155, 982)
75 ± 105
(54, 973)
206 ± 401
(110, 1388)
306 ± 278
(220, 976)
222 ± 323
(127, 1338)
15 ± 20
(7, 809)
143 ± 68
(127, 1676)
6±6
(4, 1570)
Tropical Data, Pollution Filter
b
0 –2 466 ± 97
(437, 26)
35 ± 22
(23, 26)
575 ± 211
(563, 26)
23 ± 24
(<20, 26)
204 ± 40
(205, 26)
68 ± 24
(60, 26)
211 ± 144
(170, 39)
755 ± 544
(897, 36)
15 ± 24
(2, 35)
2±2
(<1, 35)
111 ± 16
(107, 49)
5±2
(4, 42)
2 –4 642 ± 207
(636, 80)
48 ± 33
(42, 80)
840 ± 258
(744, 80)
33 ± 41
(23, 80)
173 ± 45
(171, 74)
60 ± 21
(54, 80)
126 ± 81
(115, 125)
275 ± 264
(168, 114)
90 ± 75
(81, 109)
4±4
(3, 111)
113 ± 16
(113, 133)
5±2
(5, 123)
4 –6 641 ± 228
(633, 85)
44 ± 35
(33, 85)
866 ± 406
(812, 85)
31 ± 28
(24, 85)
148 ± 48
(145, 80)
53 ± 21
(51, 85)
89 ± 60
(76, 119)
208 ± 155
(204, 112)
117 ± 86
(102, 117)
4±4
(2, 117)
108 ± 20
(108, 151)
4±2
(4, 137)
6 –8 591 ± 239
(573, 106)
37 ± 36
(21, 106)
732 ± 325
(655, 106)
22 ± 18
(<20, 105)
112 ± 34
(110, 102)
40 ± 15
(38, 106)
79 ± 60
(67, 143)
125 ± 111
(110, 129)
130 ± 75
(132, 148)
4±4.
(2, 147)
102 ± 17
(104, 177)
3±2
(3, 167)
8 –10 539 ± 171
(552, 141)
21 ± 15
(18, 141)
653 ± 314
(571, 141)
19 ± 16
(<20, 141)
88 ± 31
(83, 122)
35 ± 19
(31, 141)
62 ± 43
(55, 172)
91 ± 129
(<25, 157)
108 ± 78
(98, 179)
1±2
(<1, 179)
100 ± 17
(98, 216)
3±1
(2, 193)
10 –12 444 ± 203
(389, 98)
15 ± 17
(<10, 98)
516 ± 380
(333, 98)
18 ± 20
(<20, 98)
64 ± 33
(53, 89)
22 ± 16
(16, 96)
47 ± 34
(37, 107)
61 ± 77
(<25, 109)
64 ± 69
(35, 130)
1±1
(<1, 130)
86 ± 18
(8, 160)
2±1
(2, 151)
0 –12 560 ± 216
(537, 536)
31 ± 30
(20, 536)
701 ± 354
(649, 536)
24 ± 25
(<20, 535)
117 ± 56
(110, 493)
42 ± 23
(41, 534)
87 ± 76
(67, 705)
181 ± 253
(105, 657)
99 ± 80
(88, 718)
3±3
(<1, 719)
102 ± 20
(101, 886)
3±2
(3, 813)
a
Indicates mean ±1 standard deviation (median, number of data points).
b
Data are filtered to minimize the effects of pollution (see text).
D15S07 SINGH ET AL.: OXYGENATED ORGANICS IN THE ATMOSPHERE
5of20
D15S07
ratios of OVOC declined rather slowly toward the upper
troposphere (UT). In addition, strong latitudinal gradients
were present. Figure 4 shows the latitudinal distributions
of selected OVOC in the UT (8 –12 km) for the data set
with the pollution filter. A north to south gradient in
virtually all cases, except HCHO, can be seen. CH
3
OOH
distribution was somewhat more complex and showed a
minimum at around 25°N that coincided with the NO
x
maxima in a manner consistent with expectations [Lee et
al., 2000]. Lack of any latitudinal trend in HCHO is in
part due to measurements close to the limit of detection
(30 ppt at 2s for 5-min averages) and in part due to the
homogeneity of the sources and sinks in the UT. This
north–south latitudinal behavior for these gases is mainly
dictated by the presence of more efficient removal (higher
OH and hn) at the lower latitudes and is broadly captured
by the GEOS-CHEM model (B. D. Field et al., manu-
script in preparation, 2003).
Figure 4. Latitudinal distribution of selected OVOC in the upper troposphere (8–12 km). A filter is
used to minimize pollution influences as in Figure 2. The lines represent a best fit to the data.
ΣΣ
ΣΣ
Figure 3. Oxygenated organic chemicals in the Pacific troposphere. (a) Mean altitude profiles of
individual oxygenated species. (b) Comparison of total oxygenated volatile organic chemical (SOVOC)
abundance with that of total nonmethane hydrocarbons (SNMHC). TAN is the sum of all alkyl nitrates
(SRONO
2
). A variable filter is used to minimize pollution influences (Figure 2). The altitude showing
SOVOC is shifted by 0.25 km for clarity. Horizontal lines show first quartile, mean, median, and third
quartile. See text for more details.
D15S07 SINGH ET AL.: OXYGENATED ORGANICS IN THE ATMOSPHERE
6of20
D15S07
[10] During TRACE-P, air masses representing the low-
ermost stratosphere (O
3
< 700 ppb) were occasionally
sampled. Figure 5 presents these data for a select set of
chemicals. A rapid decline in the concentrations of CO,
PAN, CH
3
COCH
3
, and CH
3
OH as a function of O
3
is
evident. Ethanol was below its detection limit here, and
extremely high O
3
concentrations precluded reliable
measurements of CH
3
CHO and CH
3
OOH. A relat ively
low level of OVOC is present in the lower stratosphere.
We further note that our measurement methods have not
been tested for stratospheric conditions. These results are in
general agreement with previous findings [Arnold et al.,
1997; Singh et al., 2000].
[
11] Figure 6 shows the vertical structure of a selected
group of OVOC that were also simulated by the GEOS-
CHEM model. The model simulations are along the flight
tracks and are segregated into subsets with pollution filter
(Figure 6, bottom) and without it (Figure 6, top). This model
is successful in simulating mean structures of chemicals
with large primary (e.g., CH
3
COCH
3
) as well as secondary
sources arising from NMHC/NO
x
(e.g., PAN) and CH
4
/NO
x
(e.g., CH
3
OOH) chemistry. It is not our intention to imply
that the GEOS-CHEM simulations are accurate under all
conditions, but rather that it is possible to capture the mean
structures. More detailed analysis by B. D. Field et al.
(manuscript in preparation, 2003) shows that the model can
only partially explain the observed latitudinal structures. In
many cases, poor knowledge of sources, as well as sinks,
does not a llow a ccurate simulations. For exa mple, the
model s ignificantly over predicts CH
3
COCH
3
in the
MBL. In large part this is due to the inclusion of a rather
large oceanic source (14 Tg yr
1
) inferred by Jacob et al.
[2002] via inverse modeling. TRACE-P observations imply
that the oceanic CH
3
COCH
3
emissions may be much
smaller than assumed. Singh et al. [2003b] argue that the
TRACE-P data are consistent with an oceanic sink of
acetone.
[
12] In Figu re 7 we plot the o bser ved and mode led
altitude profile for CH
3
OH and the CH
3
OH/CH
3
COCH
3
ratio for the filtered data set. A significant divergence in the
measured and modeled mixing ratios can be seen. One
could infer the presence of unknown CH
3
OH sinks in the
free troposphere not presently simulated and/or the presence
of incorrect CH
3
OH sources in the model. Except for
HCHO, all of the OVOC considered in this study are quite
insoluble (R. Sander, Compilation of Henry’s law constants
for inorganic and organic species of potential importance in
environmental chemistry, a vailable at http: //www.mpch-
mainz.mpg.de/~sander/res/henry.html, version 3, 1999)
and rainout/washout processes are expected to be unimpor-
tant. Yokelson et al. [2003] studied one cloud system over
fires in South Africa and found c omplete depleti on of
CH
3
OH within a 10-min period. Tabazadeh et al. [2004]
have further investigated these observations and find that
the only possible explanation for this rapid loss would be
due to extremely fast but unknown heterogeneous reactions
on cloud droplets. Gas phase and liquid phase reactions with
OH, Cl, HCl, and NO
2
cannot explain the observed rapid
disappearance of methanol. To test the hypothesis of meth-
anol losses in clouds, TRACE-P data were segregated into
Figure 5. Distribution of selected OVOC and CO in the lowermost stratosphere.
D15S07 SINGH ET AL.: OXYGENATED ORGANICS IN THE ATMOSPHERE
7of20
D15S07
in-cloud and clear air categories [Crawford et al., 2003]. A
comparison of the mixing ratios in and out of clouds is
shown in Figure 8 directly and when normalized to CO.
There is clear evidence of higher pollutant levels within
clouds due to convective uplifting. The median in-cloud
CH
3
OH/CO ratio of 6.7 is somewhat lower than the 7.2
found in clear air. This does not rule out the possibility of
in-cloud losses, but this difference is statistically not sig-
nificant. No conclusive evidence for CH
3
OH loss due to
cloud processes could be ascertained from TRACE-P mea-
Figure 7. Comparison of observed and modeled methanol and methanol to acetone ratio. Filtered data
are as in Figure 2. Symbols are as in Figures 3 and 6. The model assumes a net oceanic methanol sink
15 Tg yr
1
.
Figure 6. Comparison of the measured (solid line) and GEOS-CHEM modeled (dashed line)
distribution of selected OVOC. (top) All data in the troposphere. (bottom) Data filtered to minimize
pollution influences as in Figure 2. Symbols are as in Figure 3. The model assumes a net oceanic acetone
source of 14 Tg yr
1
.
D15S07 SINGH ET AL.: OXYGENATED ORGANICS IN THE ATMOSPHERE
8of20
D15S07
surements. Tabazadeh et al. [2004] point out that insuffi-
cient residence time within clouds may have been an
important factor. Other potential heterogeneous loss involv-
ing reaction with acidic aerosol can also be discounted
[Iraci et al., 2002]. The potential role of CH
3
OH in
heterogeneous chemistry is presently poorly understood
and needs further investigation.
[
13] Figure 9 shows a comparison of observed and
GEOS-CHEM model simulated mixing ratio of several
aldehydes measured during TRACE-P. As has been noted
before [Singh et al., 2001], the simulated concentrations
of CH
3
CHO and C
2
H
5
CHO are much smaller than
observed. At the same time, the model provides a
reasonable description of HCHO which is principally a
Figure 9. Comparison of the measured (solid line) and modeled (dashed line) distribution of aldehydes.
Shaded area in the bottom left shows range of other measurements.
Figure 8. Methanol and methanol/CO in cloudy and clear air during TRACE-P. Clear air data are
shifted by 0.25 km for clarity. Symbols are as in Figures 3 and 6.
D15S07 SINGH ET AL.: OXYGENATED ORGANICS IN THE ATMOSPHERE
9of20
D15S07
product of methane oxidation. Although comparably high
CH
3
CHO mixing ratios have also been reported from the
Atlantic and the Indian Ocean regions using completely
independent measurement techniques [Arlander et al.,
1995; Wi sthaler et al., 2002], we are unable to fully
reconcile these obse rvations w ith current knowledge of
atmospheric chemistry. Model simulations show that the
observed CH
3
CHO and PAN concentrations are mutually
incompatible [Staudt et al., 2003]. Observed C
2
H
5
CHO/
CH
3
CHO ratios would suggest PPN/PAN ratios that are
larger than actually measured. In section 3.2 we speculate
on the magnitude and nature of the source(s) required to
maintain the observed aldehyde levels.
3.1.2. Acetaldehyde and Its Potential Role in HO
x
Formation
[
14] Acetaldehyde is mainly oxidized by reaction with
OH radicals and to a lesser degree decomposed by photol-
ysis. These reaction rates and absorption cross sections
have been extensively measured [Martinez et al., 1992;
Finlayson-Pitts and Pitts, 1999; R. Atkinson et al., IUPAC
evaluated kinetic data, 2002, available at http://www.
iupac-kinetic.ch.cam.ac.uk/; S. P. Sander et al., Chemical
kinetics and photochemical data for use in stratospheric
modeling, Evaluation 14, JPL 02-25, available at http://
jpldataeval.jpl.nasa.gov/, 2002]. Under relatively high NO
mixing ratios, above 50 ppt, the reaction of acetaldehyde leads
rapidly to HCHO and HO
x
formation. Mu¨ller and Brasseur
[1999] estimate that the net HO
x
yield from CH
3
CHO in the
UT is 0.3– 0.5. Rapid injection of CH
3
CHO from the lower
troposphere to the UT via deep convection will further
influence UT HO
x
chemistry. Under very low NO concen-
trations, competing reactions become important and other
products such as hydroperoxides, alcohols, acids, and hy-
droxyl acids are favored:
CH
3
CHO þ OH þ O
2
ðÞ!CH
3
COðÞO
2
þ H
2
O 85%ðÞ;
CH
3
CHO þ hn þ 2O
2
ðÞ!CH
3
O
2
þ HO
2
þ CO 8%ðÞ;
CH
3
COðÞO
2
þ NO
2
$ CH
3
COðÞOONO
2
PANðÞ;
CH
3
CO
ðÞ
O
2
þ NO þ O
2
ðÞ
! CH
3
O
2
þ CO
2
þ NO
2
;
CH
3
O
2
þ NO þ O
2
ðÞ!HCHO þ HO
2
þ NO
2
;
HCHO þ hv þ 2O
2
ðÞ!2HO
2
þ CO 30%ðÞ;
HCHO þ OH þ O
2
ðÞ!HO
2
þ CO þ H
2
O 20%ðÞ:
We investigated the role of CH
3
CHO on HCHO (and HO
x
)
formation in the troposphere using the present observations
and a 1-D model with updated chemistry [Chatfield et al.,
1996]. Results from a number of simulations are summar-
ized in Figure 10. The solid red line shows the steady state
concentration of HCHO consistent with a simulation that
maintains the CH
3
CHO and CH
3
COCH
3
at observed levels.
The dashed red line shows HCHO calculated for a situation
in which only acetone is maintained at observed values, but
acetaldehyde is produced only from secondary hydrocarbon
reactions. In both cases, the hydroperoxides are calculated
to be in a self-consistent steady state. As is evident from the
difference between solid and dashed red lines in Figure 10,
observed CH
3
CHO can contribute an extra 25 ppt or more
of HCHO throughout most of the troposphere. This HCHO
is a direct source of additional HO
x
in the troposphere.
Consistent with the results of Staudt et al. [2003], the
observed CH
3
CHO mixing ratios produced far greater PAN
than was measured (Figure 10). Propionaldehyde is
expected to behave in a similar manner, producing a small
amount CH
3
CHO, HCHO, HO
x
, and PPN. These large
mixing ratios of CH
3
CHO, if proven correct, provide a
major perturbation to our present understanding of tropo-
spheric chemistry.
3.1.3. Comparison of TRACE-P and PEM-West
B Observations
[
15] PEM-West B was an exploratory mission performed
over the western Pacific in winter/spring of 1994 (Febru-
ary–March). It used the NASA DC-8 aircraft and measured
many of the same constituents. It is instructive to compare
these two data sets collected 7 years apart. During PEM-
West B oxygenated species could only be measured in the
free troposphere because of difficulties associated with
water interference. Although these difficulties were over-
come in TRACE-P, comparisons here are restricted to
altitudes >3 km. The sampling density in these two experi-
ments was quite different, and certain regions were not
sampled in PEM-West B (e.g., Yellow Sea). Therefore the
purpose of the comparison that follows is primarily to assess
gross differences in composition and emission patterns.
[
16] A comparison of the mean mixing ratios of CO, O
3
,
and NO
x
under ‘‘clean’’ and ‘‘polluted’’ conditions is
presented in Figure 11 for midlatitudes (25–45°N) and
tropical/subtropical latitudes (10–25°N). We note that such
Figure 10. A 1-D model simulation of the potential
contribution of observed acetaldehyde concentrations to
formaldehyde and PAN formation. Solid lines correspond to
model runs that simulate observed acetaldehyde concentra-
tions, and the corresponding dashed lines assume that
hydrocarbon oxidation is the only acetaldehyde source.
D15S07 SINGH ET AL.: OXYGENATED ORGANICS IN THE ATMOSPHERE
10 of 20
D15S07
comparisons may be least meaningful for short-lived species
with inhomogeneous sources such as NO
x
(t = 1–4 days).
It is evident that CO concentrations were essentially un-
changed in the background as well as the polluted tropo-
sphere over this 7-year period at both mid and tropical/
subtropical latitudes. Atmospheric mixing ratios of several
select species measured in TRACE-P and PEM-West B are
also plotted as a function of CO in Figure 12. There are no
obvious large differences in these two data sets. The
similarity was as true of tracers of biomass (CH
3
Cl) and
fossil fuel (C
6
H
6
) combustion, as of complex photochemical
species such as PAN. Although concentrations of
CH
3
COCH
3
and CH
3
OH are slightly higher in TRACE-P,
these differences are small and within the uncertainties of
measurements.
[
17] As can be seen from Figures 11b and 11d, mean O
3
mixing ratios during these two experiments were nearly
equal at subtropical latitudes under all conditions. At
midlatitudes the background atmosphere also showed little
discernable change (Figure 11c). However, in the polluted
air masses, O
3
during TRACE-P was larger than PEM-West
B by about 20 ppb (Figure 11a). This excess is also evident
in the outflow regions in Figure 12. An analysis based on
NMHC ratios, ruled out large differences in air mass ages.
A logical answer could be that NO
x
concentrations in the
outflow regions were higher during TRACE-P compared to
PEM-West B. Economic indicators show that there has been
a greater use of fossil fuels in Asia during this period.
However, such an answer is not conclusive as higher NO
x
levels did not appear to result in high O
3
at subtropical
latitudes. Davis et al. [2003] have investi gated these ozone
changes in detail and concluded that the 14-day time
difference between these two missions altered the ozone
chemistry sufficiently to be an important factor in the net
O
3
formation at midlatitudes. These tendencies were not
affected at subtropical latitudes. On the whole, comparison
of data from TRACE-P and PEM-West B, separated by
7 years, failed to reveal any dramatic changes in the
composition of the Pacific troposphere.
3.2. Tracer Relationships and Source Characteristics
3.2.1. Atmospheric Relationships
[
18] Despite a high degree of variability, mixing ratios
of OVOC were correlated, suggesting a commonality of
sources. Figure 13 shows this linear relationship with CO
and CH
3
Cl in the free troposphere (3–12 km) and the
MBL over the enti re Pacific for a selected aldehyde,
ketone, and alcohol. These relationships were maintained
even in the UT (8 –12 km) region of the atmosphere. We
note that that the slopes of these lines are lower in the
MBL for methanol and acetone and higher for acetalde-
hyde. In part, this may be indicative of the potential role
of oceans as a sink for the former and a source for t he
latter [Singh et al., 2003b]. Figure 14 further shows that
the mixing ratios of OVOC are internally related. Thus
CH
3
COCH
3
behaved in a manner similar to CH
3
OH and
MEK. The strongest association is seen between CH
3
CHO
and C
2
H
5
CHO. For short-lived aldehydes (<1 day), these
correlations can be maintained because of the commonality
of sources and near identical sinks. In their enti rety, these
relationships provide broad support for the view th at
OVOC have common sources, and their atmospheric
burden is strongly influenced by pollution events originat-
ing from fossil fuel and biomass combustion.
3.2.2. Plume Composition and Biomass Burning
Source Estimates
[
19] During TRACE-P several plumes originating from
biomass combustion were sampled in the free troposphere
(3–11 km). Five-day back trajectory analysis [Fuelberg et
al., 2003], indicated that the free t roposp heric plumes
generally originated over regions of southern China, south-
east Asia, and northern Africa. Satellite observations
showed that fires were prevalent in these regions. It is
common knowledge that air masses from biomass burning
(BB) regions are easily advected into the free troposphere.
All of the relevant tracers of biomass combustion (e.g.,
HCN, CH
3
CN, CO, C H
3
Cl, and K) were significantly
elevated in these plumes. On the basis of these consider-
ations, 12 plumes were studied whose origin was indicated
to be from biomass combustion. Various NMHC ratios and
trajectory analysis suggested that these plumes were mod-
erately aged with an estimated residence time of 2– 5 days
from source. As a first step, we looked at the molar
enhancement ratios (ERs) of selected chemicals relative to
CH
3
Cl and CO in these 12 plumes. These data are summa-
rized in Table 2. Because of its BB source specificity and
lack of fossil fuel source, we first use ERs with respect to
CH
3
Cl to assess BB sources of selected OVOC. While
somewhat less robust, because of the possibility of fossil
sources, we also investigate these with respect to CO. As we
shall see, there is evidence that the contribution of non-BB
CO in these free tropospheric (FT) plumes was quite small.
We also note that most of the ERs reported in the literature
from previous studies are given with respect to CO. For
purposes of scaling, we adopt a global BB CH
3
Cl source of
0.9 Tg yr
1
and a corresponding CO source of 600 Tg yr
1
based on recent evaluations [Lobert et al., 1999; Andreae
and Merlet, 2001; Duncan et al., 2003; Yevich and Logan,
2003].
[
20] For extremely short-lived species (e.g., aldehydes),
ERs may have no unique value and cannot be interpreted
without a detailed chemical model. Acetone and CH
3
OH,
however, are sufficiently long-lived in the FT (t 15 days)
and the sampled plumes are sufficiently fresh that the
changes in ERs due to chemical losses during transport
should be small (<25%). The corresponding loss for MEK
and C
2
H
5
OH is nearly twi ce as large. Photochemical
synthesis however, can provide a secondary source during
transport and is thought to be a main reason for the large
spread in acetone-ERs summarized by Reiner et al. [2001]
and Jost et al. [2003]. Secondary formation in BB plumes is
probably far less important for alcohols.
[
21] In Table 2 we determine mean ER
CO
(ppt/ppb) of
7.5 ± 1.1 and 16.3 ± 2.0 for CH
3
COCH
3
and CH
3
OH,
respectively. These are two chemicals for which previous
data, largely based on controlled fires, are available. This
acetone-ER
CO
is in good agreement with our previous mea-
surement of 8 ± 2 from African fires for moderately aged
plumes [Mauzerall et al., 1998] but somewhat higher than the
5.4 ± 2.7 value reported by Holzinger et al. [1999] from
simulated laboratory fires. Similarly, mean methanol-ER
CO
is in good agreement with values of 17.1 ± 7.6 [Yokelson et
al., 1999], 13.6 ± 3.9 [Yokelson et al., 2003], and 12 ± 1
[Wisthaler et al., 2002] reported in several independent
D15S07 SINGH ET AL.: OXYGENATED ORGANICS IN THE ATMOSPHERE
11 of 20
D15S07
Figure 11. Comparison of mean TRACE-P (black) and PEM-West B (white) mixing ratios of CO, O
3
and NO
x
at mid and subtropical latitudes under pristine and polluted conditions.
Figure 12. Comparison of data collected in the free troposphere (3–12 km) during PEM-West B (red)
and TRACE-P (black) normalized against CO.
D15S07 SINGH ET AL.: OXYGENATED ORGANICS IN THE ATMOSPHERE
12 of 20
D15S07
campaigns from widely separated regions. No published
data for MEK or ethanol ERs could be uncovered. Although
we believe that short-lived species such as CH
3
CHO have no
unique ER, the CH
3
CHO ER
CO
(ppt/ppb) of 1.4 ± 0.8 can be
compared with 3.5 ± 1.9 measured by Hurst et al. [1994] in
Australian fires. ERs with respect to CH
3
Cl have not been
previously reported.
[
22] Rough BB source es timates can be obtained by
scaling Table 2 ERs to the BB sources of CO (600 Tg yr
1
)
and CH
3
Cl (0.9 Tg yr
1
). This assumes that the 12 plumes
sampled during TRACE-P provide a representative
sample. Given the great paucity of available data, this
assumption is at least a good first starting point. Table 2
summarizes these source estimates calculated for selected
oxygenated species. We note that values derived from ER
CO
and ER
CH3Cl
are very nearly the same. This supports the
assumption that CO contamination from fossil sources was
minimal in these plumes. A global BB source of 9 Tg yr
1
Figure 13. Relationships between selected OVOC and tracers in (top) the free troposphere and (bottom)
the boundary layer. S and R are slopes and correlation coefficients for the linear fit. Slopes are in units of
ppt/ppb for CO and ppt/ppt for CH
3
Cl.
Figure 14. Relationships among carbonyls and alcohols in the Pacific troposphere.
D15S07 SINGH ET AL.: OXYGENATED ORGANICS IN THE ATMOSPHERE
13 of 20
D15S07
for CH
3
COCH
3
and 11 Tg yr
1
for CH
3
OH is calculated.
The CH
3
OH estimate of 11 Tg yr
1
is in good agreement
with many of the recent estimates summarized in Table 3.
The estimated source of CH
3
COCH
3
is substantially larger
than the Andreae and Merlet [2001] recommendation of
3.3Tgyr
1
. As stated above, some synthesis of
CH
3
COCH
3
can occur from BB precursors during transport.
In a recent study, Jost et al. [2003] use a detailed model to
conclude that they are unable to simulate the enhancement
of CH
3
COCH
3
within a BB plume possibly because of the
presence of unknown precursors or reaction mechanisms.
Therefore we recommend that for global model simulations
the use of the larger source term (9 Tg yr
1
), which includes
primary and a significant fraction of the secondary source, is
more appropriate. After correcting ERs for the 50%
reduction during transit, a smaller BB source of about
2Tgyr
1
each for MEK and C
2
H
5
OH can be estimated
(Tables 2 and 3). There are no published values available for
comparison.
[
23] The mean ozone-ER
CO
of 0.3(±0.2) ppb/ppb
measured during TRACE-P (Table 2) is similar to that
obtained for ‘‘recent plumes’’ originating from African fires
[Mauzerall et al., 1998]. We note that in some of the aged
plumes there was no measurable ozone enhancement. This
somewhat low ozone ER
CO
can be attributed to the fact that
much of the reactive nitrogen appears to shift into the PAN
reservoir and is not readily available for further O
3
synthe-
sis. On average, some 65% of the reactive nitrogen was in
the form of PAN, 22% as HNO
3
and 13% as NO
x
(Table 2).
When aged plumes were selected, some 85% of reactive
nitrogen was found to be in the PAN reservoir (HNO
3
8%;
NO
x
6%). As has been suggested previously [Jacob et al.,
1996; Mauzerall et al., 1998], O
3
production in fire plumes
is controlled by the availability of NO
x
from the PAN
reservoir and is thus considerably impeded.
[
24] Several episodes of pollution outflow from eastern
Asia were also sampled in the marine boundary layer
(MBL). These ERs are also summarized in Table 2 based
on the sampling of nine such episodes (0 –1 km). The
quantitative interpretation of these ERs is difficult because
of the extreme complexity of urban sources in Asia.
However, since CH
3
Cl is no t a product of fossil fuel
combustion, one can make some qualitative observations.
It appears that biofuels and coal, common fuels in eastern
Asia, yield somewhat less CH
3
COCH
3
and CH
3
OH com-
pared to active fires. In the case of CH
3
COCH
3
, a shorter
residence time providing insufficient time for synthesis is a
factor. I t can also be inferred that substantial additional
urban sources of MEK are present. This is not a surprise as
significant quantities of MEK are commercially used in
solvent applications, and it can also be relatively rapidly
(hours) synthesized from the oxidation of fossil fuel gener-
ated hydrocarbons such as n-butane.
3.2.3. Global Sources
[
25] Because of the complexity of sources and lack of
observational data, our quantitative knowledge of OVOC
Table 2. Mean Enhancement Ratios and Total Biomass Burning Source Estimates of Selected Oxidized Species
Chemicals (X) ER/FT Plumes
a
ER/MBL Episodes
a
Total BB Source,
b
Tg yr
1
DX/DCO,
ppt/ppb
DX/DCH
3
Cl,
ppt/ppt
DX/DCO,
ppt/ppb
DX/DCH
3
Cl,
ppt/ppt From FT DX/DCO From FT DX/DCH
3
Cl
CH
3
COCH
3
7.5 ± 1.1 9.0 ± 2.5 4.7 ± 1.9 6.4 ± 2.9 9.3 ± 1.4 9.3 ± 2.6
CH
3
COC
2
H
5
0.7 ± 0.4 0.9 ± 0.7 1.3 ± 0.5 1.6 ± 0.6 2.2 ± 1.2 2.4 ± 1.8
CH
3
OH 16.3 ± 2.0 19.8 ± 6.5 10.6 ± 5.3 16.6 ± 7.5 11.2 ± 1.4 11.3 ± 3.7
C
2
H
5
OH 0.9 ± 0.6 1.2 ± 1.1 2.2 ± 1.4 3.7 ± 3.2 1.8 ± 1.2 2.0 ± 1.8
CH
3
CHO 1.4 ± 0.8 1.8 ± 1.3 2.7 ± 2.0 3.9 ± 2.6 – –
C
2
H
5
CHO 0.4 ± 0.3 0.5 ± 0.5 1.4 ± 0.7 1.8 ± 0.8 – –
PAN 3.8 ± 2.1 4.8 ± 3.4 4.1 ± 1.7 6.6 ± 4.9 – –
NO
x
0.8 ± 0.7 1.0 ± 0.9 2.1 ± 1.2 3.5 ± 2.8 – –
HNO
3
1.3 ± 1.7 1.9 ± 3.2 5.3 ± 1.9 8.5 ± 4.3 – –
O
3
260 ± 170 280 ± 170 80 ± 60 130 ± 80 – –
a
Mean enhancement ratios (ERs) with respect to CO and CH
3
Cl are based on the sampling of 12 plumes in the free troposphere (FT; 3 –10 km) and
9 episodes of marine boundary layer (MBL; 0 –1 km) pollution.
b
The estimated biomass burning (BB) source is derived by scaling the FT ERs to a global BB source of 600 Tg yr
1
/CO and 0.9 Tg yr
1
/CH
3
Cl and is
inclusive of primary as well as secondary photochemical sources. MEK and ethanol source estimates are corrected for loss in transit (see text).
Table 3. Global Biomass Burning Source Estimates for Selected Oxygenated Chemicals
a
CH
3
COCH
3
,
Tg yr
1
CH
3
OH,
Tg yr
1
MEK,
Tg yr
1
C
2
H
5
OH,
Tg yr
1
Type of Data Reference
10 (8 –12)
b
– – – BB plume at high latitudes Singh et al. [1994]
7 ± 3 4 ± 2 – – laboratory fires Holzinger et al. [1999]
– 10 ± 6 – – controlled fires Yokelson et al. [1999]
5 (3 –10) 6 (3 –10) – – assessment Singh et al. [2000]
3 13 – – assessment Andreae and Merlet [2001]
5 ± 2 – – – inverse modeling Jacob et al. [2002]
21 ± 1
b
8±1
b
BB plumes over Indian Ocean Wisthaler et al. [2002]
9±1
b
11 ± 1
b
2±1
b
2±1
b
BB plumes over Pacific this study (scaled to CO)
9±3
b
11 ± 4
b
2±2
b
2±2
b
BB plumes over Pacific this study (scaled to CH3Cl)
a
Most estimates are obtained by scaling measured enhancement ratios (ERs) in plumes from biomass combustion to the global CO source.
b
These are inclusive of primary as well as secondary sources attributable to BB emission.
D15S07 SINGH ET AL.: OXYGENATED ORGANICS IN THE ATMOSPHERE
14 of 20
D15S07
emissions is quite incomplete. Emissions have been esti-
mated by extrapolating limited laboratory and field studies
or derived from atmospheric measurements using a variety
of inversion methods. In most cases a combination of these
approaches has been used. Biogenic emissions are signifi-
cant in nearly all cases but remain poorly quantified.
Biological pathways involved in the formation of OVOC
in plant matter have been recently reviewed by R. Fall
(manuscript in preparation, 2003). Here we assess the
current state of knowledge of select OVOC emissions and
further interpret these in light of present measurements.
Given the great paucity of available data, many assumptions
and extrapolations are necessary and are noted. Estimates of
the global sources of OVOC are presented in Table 4. These
are intended to show uncertainties in our present knowledge
in some cases and provide an initial estimate in others.
While uncertainties abound, a large global OVOC source of
some 300 (150–500) Tg C yr
1
appears to be present.
3.2.3.1. Acetone
[
26] Of the many OVOC present in the atmosphere,
CH
3
COCH
3
is one of the most abundant and has been
studied most extensively. Its first global inventory was
presented in the early 90s and subsequently revised [Singh
et al., 1994, 2000]. More recently, Jacob et al. [2002] have
further investigated the budget of CH
3
COCH
3
by reviewing
existing information and by using inverse modeling tech-
niques from which additional source information is inferred.
In Table 4 we provide global so urce estimates of
CH
3
COCH
3
obtained in these two studies. The Jacob
et al. [2002] study finds that a global CH
3
COCH
3
source
of 95 Tg yr
1
fits the observational data better than the
56 Tg yr
1
estimated by Singh et al. [2000] using inventory
approaches (see note added in proof).
[
27] Jacob et al. [2002] recommend a primary biogenic
source of 33 Tg yr
1
, nearly twice as large as that of
Singh et al. [2000]. Recent plant emission and flux data
suggest even larger primary biogenic emissions [Schade
and Goldstein, 2001; Karl et al., 2002; Villanueva-Fierro
et al., 2004]. Potter et al. [2003] use foliar emission and
satellite derived leaf area index data to obtain a global
acetone biogenic source of 50–170 Tg yr
1
. A biogenic
source of 50 (25–50) Tg yr
1
is consistent with these
data and is recommended (Table 4). On the basis of this
study, we also find that a BB source that is nearly twice
as large (9 Tg yr
1
) is more appropriate (Table 3). This
larger source includes both primary and secondary sour-
ces from BB emissions whose mechanisms are not well
known [Jost et al., 2003]. Both the magnitude and the
sign of the oceanic flux of CH
3
COCH
3
are uncertain.
Using a variety of inverse modeling methods, a net
oceanic source of 10– 15 Tg yr
1
has been suggested
[de Laat et al., 2001; Jacob et al., 2002]. On the other
hand, Singh et al. [2003b] use the gradient at the top of
the MBL (Table 1) and an air-sea exchange models to
conclude that TRACE-P observations are more compati-
ble with a net oceanic sink of 14 Tg yr
1
. No seawater
measurements are presently available to directly support
the role of oceans as a source or a sink of acetone. We
use these data to provide a revised source inventory of
CH
3
COCH
3
in Table 4 while retaining the 95 Tg yr
1
global source recommended by Jacob et al. [2002] (see
note added in proof).
Table 4. Global Source Estimates for Selected Oxygenated Chemicals
a
Source Category
CH
3
COCH
3
,Tg yr
1
CH
3
OH,Tg yr
1
MEK C
2
H
5
OH,Tg yr
1
CH
3
CHO,Tg yr
1
C
2
H
5
CHO,Tg yr
1
Ref 1 Ref 2 This Study Ref 1 Ref 3 Ref 4 Ref 5 (This Study) This Study This Study This Study This Study
Primary
anthropogenic
2
(1 –3)
1
(1 –2)
2
(1 – 3)
3
(2 –4)
4
(3 –5)
8
(5 –11)
9<12 <1
(0 –1)
<1
(0 –1)
Primary
biogenic
15
(10 –20)
33
(24 –42)
50
(25 –75)
75
(50 –125)
100
(37 –212)
280
(50 –280)
128 7
b
(5 –9)
6
b
(4 –8)
35
(20 –50)
?
Hydrocarbon
oxidation
c
28
(19 –39)
28
(20 –36)
28
(20 –36)
18
(12 –24)
19
(14 –24)
30
(18 –30)
37 1
(1 –3)
2
(1 –3)
30
(15 –45)
3
(1 –5)
Dead/decaying
plant matter
6
(4 –8)
2
(0 –7)
6
(4 – 8)
20
(10 –40)
13
(5 –31)
20
(10 –40)
23 small small small ?
Biomass
burning
5
(3 –10)
4
(3 –6)
9
(7 –11)
6
(3 –17)
13
(6 –19)
12
(2 –32)
12 2
(1 –3)
2
(1 –3)
10
(5 –15)
?
Oceanic ? 27
(21 –33)
0
d
(0 –15)
? small ?
(0 –80)
0
d
( –15)
0
(0 –1)
0
(0 –1)
125
(75 –175)
45
(25 –65)
Total source 56
(37 –80)
95
(69 –126)
95
(57 –148)
122
(75 –210)
149
(83 –260)
345
(90 –490)
209 11
(7 –16)
12
(8 –17)
200
(115– 286)
?
Estimated mean source
e
(this study)
95
(t = 15 days)
f
110(t = 9 days) 11
(t = 7 days)
12
(t = 3.5 days)
220
(t = 1 day)
105
(t = 1 day)
a
References are as follows: 1, Singh et al. [2000]; 2, Jacob et al. [2002]; 3, Galbally and Kirstine [2002]; 4, Heikes et al. [2002]; 5, B. D. Field et al. (manuscript in preparation, 2003).
b
These are estimated by difference.
c
Main hydrocarbons involved are CH
4
for methanol; C
3
H
8
, i_alkanes, and terpenes for acetone; n-C
4
H
10
for MEK, alkanes/alkenes for aldehydes.
d
It is possible that oceans provide a small net sink for acetone and methanol. In this model a methanol sink of 15 Tg yr
1
is employed.
e
These are estimated by normalizing to a 95 Tg yr
1
source for acetone (see text).
f
The t represents global mean residence time in days.
D15S07 SINGH ET AL.: OXYGENATED ORGANICS IN THE ATMOSPHERE
15 of 20
D15S07
[28] In subsequent sections we will estimate the global
source of OVOC by normalizing to this CH
3
COCH
3
source:
S½
OVOC
Tg yr
1
ÀÁ
¼ 95ðÞC
OVOC
M
OVOC
t
acetone
ðÞ=
C
acetone
M
acetone
t
OVOC
ðÞ; ð1Þ
where S, C, M, and t represent emissions, mixing ratios,
molecular weights, and mean lifetimes, respectively. A
mean CH
3
COCH
3
lifetime of 15 days and median mixing
ratios for the filtered data set (Table 1) have been used in
subsequent calculations. Equation (1) is approximate, and
its use is warranted only when no previous information is
available or to assess large-scale inconsistencies in source
estimates from different studies.
3.2.3.2. Methanol
[
29] A first global budget of the CH
3
OH was presented
by Singh et al. [2000]. More recently, methanol budget has
been reviewed and further investigated by Galbally and
Kirstine [2002] and Heikes et al. [2002]. It is evident from
Table 4 that large uncertainties in its sources (and implied
sinks) are currently present and the estimated source can
range from 75 to 490 Tg yr
1
. The largest disagreement is
due to the widely differing estimates of its biogenic emis-
sions (35 –280 Tg yr
1
). The Galbally and Kirstine [2002]
global source estimate of 149 Tg yr
1
is based on a
mechanistic model of pl ant emissions. This estimate is
comparable to the 122 Tg yr
1
deduced by Singh et al.
[2000] using inventory methods. Using a mean atmospheric
lifetime of 9 days [Heikes et al., 2002] and present measure-
ments (Table 1), we calculate a global CH
3
OH source of
110 Tg yr
1
from equation (1). Table 4 also shows the
inventory used in the current version of the GEOS-CHEM
model (B. D. Field et al., manuscript in preparation, 2003).
It is noted that the present model calculated CH
3
OH source
from hydrocarbon (mostly methane) oxidation, via dispro-
portionation of methyl peroxy radicals, of 37 Tg yr
1
is
nearly twice as large as previously suggested. The reasons
for these model uncertainties are not clear but are most
likely due to differences associated with the parameteriza-
tion of methanol yields. We note that the 11 Tg yr
1
BB
source determined in this study (Table 3) is in good
agreement with previous estimates (Tables 3 and 4). As is
evident from Table 1, the observed median mixing ratios of
CH
3
OH in the MBL (0–2 km) are lower than in the free
troposphere (2– 4 km) by 200 ppt (Table 1). Singh et al.
[2003b] use this fact and an air-sea exchange model to
conclude that oceans are near equilibrium and provide a
small net sink of CH
3
OH. Emissions of CH
3
OH are both
large and uncertain and much further work is needed to
accurately quantify these.
3.2.3.3. Methylethyl Ketone (MEK)
[
30] Little is known about its sources and no quantitative
emissions inventory has been previously presented. Using
its measured OH rate constants (1.3 10
12
e
25/T
mole-
cules
1
cm
3
s
1
) and its photolysis rates [Martinez et
al., 1992; R. Atkinson et al., IUPAC evaluated kinetic data,
2002, available at />we determine a mean atmospheric lifetime of 7 days. As a
first estimate, a global source of 11 Tg yr
1
can be
calculated from equation 1. MEK is a commonly used
industrial solvent and its emissions are well documented
in the Toxics Release Inventory compiled by U.S. Environ-
mental Protection Agency On
the basis of these data, we conclude that the direct anthropo-
genic emissions are insignificant as a global source
(<0.1 Tg yr
1
). MEK was also observed as an emission
from decaying plant matter [Warneke et al., 1999] and has
been identified as a significant biogenic emission from a
variety of plants and grasses [Isidorov et al., 1985; Kirstine
et al., 1998; de Gouw et al., 1999]. Kirstine et al. [1998]
report that MEK formed nearly 50% of the organic emissions
from clover. The available data presently do not allow a
quantitative estimation of MEK biogenic sources. In Table 4
we arbitrarily assign (by difference) a source of 6 Tg yr
1
to
this category. On the basis of presently available informa-
tion, an MEK source of this magnitude is feasible.
[
31] MEK is a principal product of the oxidation of
n-butane whose global emissions are 1– 2 Tg yr
1
[Singh
and Zimmerman, 1992]. Nearly 80% of n-butane is oxidized
in a manner that can produce MEK:
n C
2
H
5
C
2
H
5
þ OH þ O
2
ðÞ!CH
3
CH OOðÞC
2
H
5
þ H
2
O;
CH
3
CH OOðÞC
2
H
5
þ NO ! CH
3
CH OðÞC
2
H
5
þ NO
2
;
CH
3
CH OðÞC
2
H
5
þ O
2
! HO
2
þ CH
3
COðÞC
2
H
5
MEKðÞ:
In addition, alkenes containing a methyl and an ethyl group
on the same side of the olefin bond (cis-2-butene/pentene,
2-methyl-1-butene, etc.) will degrade to produce MEK upon
reaction with O
3
and OH. Unlike the case of CH
3
COCH
3
,
no mechanistic pathways presently appear feasible for MEK
formation from the oxidation of known biogenic hydro-
carbons such as isoprene, a/ b pinene, and methyl butenol.
We calculate that an MEK source of 2–3 Tg yr
1
could
result from C
4
-C
6
hydrocarbon oxidation with n-butane as
the dominant contributor. A first estimate of the BB source
of MEK (2 Tg yr
1
) is calculated in Table 3. We expect
MEK to behave like acetone with insignificant oceanic
sources. These estimates are summarized in Table 4 to
provide a first estimate of the global inventory of MEK.
3.2.3.4. Ethanol
[
32] Ethanol finds many applications in the commercial/
industrial world. It is a commonly used solvent and is an
intermediate in the manufacture of many chemicals. It is
also an increasingly popular fuel and fuel additi ve [Nguyen
et al., 2001]. E thanol has an atmospheric lifetime of
3.5 days, and its global mixing ratios are quite small
(Table 1) [Singh et al., 1995]. We use equation (1) to
calculate a global source of about 12 Tg yr
1
. Its commer-
cial/industrial/social/fuel releases and as a by-product in
wood product and organic chemical industry are estimated
to be 1–2 Tg yr
1
. Ethanol can also be generated as a
secondary product from the oxidation of any hydrocarbon
that can generate a C
2
H
5
O
2
radical [2C
2
H
5
O
2
! C
2
H
5
OH +
CH
3
CHO + O
2
] with ethane as the leading candidate. We
use a simple photochemical model to estimate an 1Tgyr
1
source from ethane oxidation. Ethanol has been observed
as a direct emission from many plant species, and high
concentrations and large emission rates have been mea-
sured in many forested ecosystems and grass land areas
[Kimmerer and MacDonald, 1987; Kelsey, 1996; Lamanna
and Goldstein, 1999; Schade and Goldstein, 2001, 2002;
Kirstine et al., 1998; Fukui and Doskey, 1998; Karl et al.,
D15S07 SINGH ET AL.: OXYGENATED ORGANICS IN THE ATMOSPHERE
16 of 20
D15S07
2003]. An emission rate of some 2.9 mgg
1
dry weight (dw)
h
1
(30°C) was measured by Schade and Goldstein [2001]
from a Ponderosa pine canopy in Blodgett Forest in
California. Ethanol can also be produced in plant roots by
anaerobic fermentation and may metabolize t o CH
3
CHO
and acetic acid in plant leaves prior to emission [Kreuzwieser
et al., 2001]. Its metabolic pathways are well understood,
and in aerobic environments it can also be formed by
the decomposition of CH
3
CHO in plant tissues (R. Fall,
manuscript in preparation, 2003). Its BB source is estimated
to be about 2 Tg yr
1
(Table 3). In Table 4 we provide a
rough first analysis of its sources with the largest fraction
(6 Tg yr
1
) attributed to biogenic emissions.
3.2.3.5. Acetaldehyde
[
33] On a global scale, very little is known about the
sources of CH
3
CHO, and no global inventory is presently
available. In Table 4 we provide a f irst, a lbeit highly
uncertain, source inventory of CH
3
CHO. From available
measurements around the globe in the MBL and limited free
tropospheric measurements from the Pacific, it is reasonabl e
to assume that CH
3
CHO is globally ubiquitous and its
mixing ratios are substantial [Zhou and Mopper, 1993; Singh
et al., 1995, 2001; Arlander et al., 1995; Tanner et al., 1996;
Wisthaler et al., 2002]. As a starting point we use equation (1)
to estimate its global sources. Given its very short lifetime
of 1 day and its measured atmospheric abundance
(Table 1), we deduce that a total source of 220 Tg yr
1
is
required and some of this must be in the free troposphere.
[
34] In a number of tail pipe emission tests [e.g., Sigsby et
al., 1987], 0.5% of the carbon is found to be emitted as
CH
3
CHO. The use of oxygena ted fuels, particularly
C
2
H
5
OH, results in increased tail pipe emissions of
CH
3
CHO. Direct emissions of CH
3
CHO by industry are
negligible small (<0.1 Tg yr
1
). We estimate that in total
these anthr opogenic emissions are <1 Tg yr
1
.Large
biogenic emissions are known to occur, and indeed high
concentrations of CH
3
CHO have been measured in many
rural/forested environments [Isidorov et al., 1985; Shepson
et al., 1991; Fehsenfeld et al., 1992; Goldan et al., 1995;
Solberg et al., 1996; Riemer et al., 1998; Kirstine et al.,
1998; Schade and Goldstein, 2001]. Direct measurements
from pine and oak species show that some 0.027–0.049%
of net carbon assimilated is released in the form of
CH
3
CHO [Kesselmeier et al. , 1997]. Scaling it by the global
net primary productivity of 5 10
4
Tg C yr
1
a biogenic
source of 25–45 Tg yr
1
is feasible. These investigators
also measure a direct daytime average CH
3
CHO release rate
of 0.83 mgg
1
dw h
1
at 30°C. Schade and Goldstein
[2001] determine mean CH
3
CHO fluxes in a Ponderosa
pine forest in California of 0.20 mgCm
2
dw h
1
or
0.86 mgg
1
dw h
1
at 30°C. Since fluxes are often reported
in area units, a constant foliar density of 425 g dw m
2
,a
typical value for Blodgett Forest, has been used to obtain
the corresponding mass units. They also find that that
nighttime emissions are extremely small (10% of day-
time). Other studies summarized by Villanueva-Fierro et al.
[2004] report mean rates of 0.3 –1.2 mgg
1
dw h
1
from a
variety of plant species. The major exception is the study of
Karl et al. [2002], who use a new technique to measure
unusually high emission rates of 0.94 mgg
1
dw h
1
at only
15°C from a site (Niwot Ridge) in Colorado. Assuming a
median value of 0.7 (0.2 –1.2) mgg
1
dw h
1
at 30°C only
during daylight hours, and a recent version of the Guenther
et al. [1995] model, a CH
3
CHO source estimate of 45 (13–
77) Tg yr
1
can be estimated. While highly uncertain, we
use a reasonable central value of 35 (20–50) Tg yr
1
.
[
35] Nearly all >C
1
alkanes (ethane, propane, n-butane)
and >C
2
alkenes (propene, 2-butene) form CH
3
CHO as an
intermediate oxidation product [Finlayson-Pitts and Pitts,
1999; Warneck, 1999]. In many cases (e.g., ethane, propene)
the yield of CH
3
CHO is >50%. In the global atmosphere the
largest source must come from ethane {C
2
H
6
+OH!
C
2
H
5
O
2
(+NO) ! C
2
H
5
O ! CH
3
CHO} and p ropene
oxidation which are emitted at a rate of 15– 20 Tg yr
1
and 7–12 Tg yr
1
, respectively [Singh and Zimmerman,
1992]. Using a simple chemical scheme of alkane/alkene
chemistry, we estim ate C H
3
CHO source from NMHC
oxidation to be 35 (20–50) Tg yr
1
. BB emissions of
CH
3
CHO have been measured with Holzinger et al. [1999]
reporting a source of 11 Tg yr
1
and Andreae and Merlet
[2001] recommending only 4 Tg yr
1
. On the basis of a
number of assumptions, Singh et al. [2003b] estimate a
global CH
3
CHO oceanic source of 125 Tg yr
1
.Wenote
that the source inventory prescribed in Table 4, in and
of itself, may not be enough to explain its atmospheric
budget and distribution of CH
3
CHO. These estimates are
also strongly dependent on the reliability of atmospheric
measurements.
3.2.3.6. Propionaldehyde
[
36] Mixing ratios of C
2
H
5
CHO are about one third of
CH
3
CHO, and the two are highly correlated (Figure 14).
There are no independent atmospheric measurement s avail-
able to confirm that C
2
H
5
CHO is indeed ubiquitous in the
global troposphere. However, we use its tight correlation
with CH
3
CHO to suggest that it is distributed much like
CH
3
CHO. The lifetime of C
2
H
5
CHO, based on reaction with
OH (R. Atkinson et al., IUPAC evaluated kinetic data, 2002,
available at and
photolysis [Martinez et al., 1992], is also comparable to that
of CH
3
CHO (1 day). From these one could infer a global
C
2
H
5
CHO source of 105 Tg yr
1
. Propionaldehyde is
formed via photochemical oxidation of many >C
3
NMHCs
and has been observed as a significant emission from plant
matter [Villanueva-Fierro et al., 2004]. It has also be en
detected in seawater with substantial concentrations in the
surface microlayers [Zhou and Mopper, 1997]. Singh et al.
[2003b] assume that the differential in the MBL between the
measured and modeled mixing ratios in Figure 9 is due to the
oceanic source. On the basis of this assumption, they infer an
oceanic source of some 45 Tg yr
1
. Much more comprehen-
sive atmospheric, oceanic, and emission data are required
prior to any reliable source inferences.
4. Conclusions
[37] In recent years it has become clear that large con-
centrations of OVOC are present in the global troposphere
and they play an important role in atmospheric chemistry.
Their oxidation rate is comparable to that of methane and
much larger than nonmethane hydrocarbons. A large (150–
500 Tg C yr
1
) carbon flux moves through the atmosphere
in the form of oxygenated species. Their sources and sinks
are presently highly uncertain. Biogenic emissions are
nearly always significant but remain poorly quantified.
D15S07 SINGH ET AL.: OXYGENATED ORGANICS IN THE ATMOSPHERE
17 of 20
D15S07
The role of oceans as sources and sinks for these chemicals
is largely unexplored. In many cases, measured concentra-
tions are incompatible w ith our present knowledge of
atmospheric chemistry. There is preliminary suggestion for
OVOC involvement in heterogeneous processes. Better
understanding of chemical degradation pathways of many
OVOC is necessary. The possibility that atmospheric mea-
surement may suffer from unknown difficulties can also not
be ruled out. Much future work is necessary before the
budgets and chemistry of this group of chemicals can be
placed on a reliable quantitative footing.
[
38] Note added in proof. After this paper was accepted, we
learned about the new temperature dependent acetone quantum
yield measurements by researchers from the University of Leeds,
UK (D. Heard, private communication, 2003). According to these
results, globally averaged atmospheric lifetime of acetone may be
somewhat longer (18 days) than previously believed (15 days).
This would imply that a global acetone source of 80 Tg yr
1
would
be more in line with observations than the presently estimated 95
Tg yr
1
used in this study.
[39] Acknowledgments. This research was funded by the NASA
Global Tropospheric Experiment and Interdisciplinary Science Program.
Harvard investigators acknowledge support from the NSF Atmospheric
Chemistry Program. We thank all TRACE-P participants for their support.
Discussions with C. Potter of NASA Ames, R. Atkinson of UC Riverside,
and P. Harley and A. Guenther of NCAR are much appreciated.
References
Andreae, M. O., and P. Merlet (2001), Emissions of trace gases and aerosols
from biomass burning, Global Biogeochem. Cycles, 15(4), 955 –966.
Arlander, D. W., D. Brunking, U. Schmidt, and D. H. Ehhalt (1995), The
distribution of acetaldehyde in the lower troposphere during TROPOZ II,
J. Atmos. Chem., 22, 243 –249.
Arnold, F., et al. (1997), Acetone in the upper troposphere and lower strato-
sphere:Impactontracegasesandaerosols,Geophys. Res. Let t., 24,
3017 –3020.
Bey, I., et al. (2001), Global modeling of tropospheric chemistry with
assimilated meteorology: Model description and evaluation, J. Geophys.
Res., 106, 23,073 –23,095.
Blake, N. J., et al. (1999), Influence of southern hemispheric biomass
burning on mid-tropospheric distributions of nonmethane hydrocarbons
and selected halocarbons over the remote South Pacific, J. Geophys. Res.,
104, 16,213–16,232.
Butler, J. H. (2000), Better budgets for methyl halides?, Nature, 403, 260 –
261.
Chatfield, R. B., J. A. Vastano, H. B. Singh, and G. A. Sachse (1996),
General model of how fire emissions and chemistry produce African/
oceanic plumes (O
3
, CO, PAN, smoke) in TRACE A [O
3
], J. Geophys.
Res., 101, 24,279 –24,306.
Crawford, J., et al. (2003), Clouds and trace gas distributions during
TRACE-P, J. Geophys. Res., 108(D21), 8818, doi:10.1029/
2002JD003177.
Davis, D. D., et al. (2003), An assessment of western North Pacific ozone
photochemistry based on springtime observations from NASA’s PEM-
West B (1994) and TRACE-P (2001) field studie s, J. Geophys. Res.,
108(D21), 8829, doi:10.1029/2002JD003232.
de Gouw, J. A., C. J. Howard, T. G. Custer, and R. Fall (1999), Emissions
of volatile organic compounds from cut grass and clover are enhanced
during the drying process, Geophys. Res. Lett., 26, 811– 814.
de Laat, A. T. J., J. A. de Gouw, J. Lelieveld, and A. Hansel (2001), Model
analysis of trace gas m easurements and pollution impact during
INDOEX, J. Geophys. Res., 106, 28,469 –28,480.
Duncan, B. N., R. V. Martin, A. C. Staudt, R. Yevich, and J. A. Logan
(2003), Interannual and seasonal variability of biomass burning emissions
constrained by satellite observations, J. Geophys. Res., 108(D2), 4100,
doi:10.1029/2002JD002378.
Eisele, F. L., et al. (2003), Summary of measurement intercomparisons
during TRACE-P, J. Geophys. Res., 108(D20), 8791, doi:10.1029/
2002JD003167.
Fall, R. (1999), Biogenic emissions of VOCs from higher plants, in Reac-
tive Hydrocarbons in the Atmosphere, edited by C. N. Hewitt, pp. 43 –96,
Academic, San Diego, Calif.
Fehsenfeld, F., et al. (1992), Emissions of volatile organic compounds from
vegetation and the implications for atmospheric chemistry, Global Bio-
geochem. Cycles, 6(4), 389 –430.
Finlayson-Pitts, B. J., and J. N. Pitts Jr. (1999), Chemistry of the Upper and
Lower Atmosphere, Academic, San Diego, Calif.
Fried, A., et al. (2003), Airborne tunable diode laser measurements of
formaldehyde during TRACE-P: Distributions and box model compar-
isons, J. Geophys. Res., 108(D20), 8798, doi:10.1029/2003JD003451.
Fuelberg, H. E., C. M. Kiley, J. R. Hannan, D. J. Westberg, M. A. Avery,
and R. E. Newell (2003), Meteorological conditions and transport path-
ways during the Transport and Che mical Evolution over the Pacific
(TRACE-P) experiment, J. Geophys. Res., 108(D20), 8782,
doi:10.1029/2002JD003092.
Fukui, Y., and P. V. Doskey (1998), Air-surface exchange of nonmethane
organic compounds at a grass land site: Seasonal variations and stressed
emissions, J. Geophys. Res., 103, 13,153 –13,168.
Galbally, I. E., and W. Kirstine (2002), The production of methanol by
flowering plants and the global cycle of methanol, J. Atmos. Chem.,
43(3), 195 –229.
Goldan, P. D., W. C. Kuster, F. C. Fehsenfeld, and S. A. Montzka (1995),
Hydrocarbon measurements in the southeastern United States: The Rural
Oxidants in the Southern Environment (ROSE) program 1990, J. Geo-
phys. Res., 100, 25,945 –25,963.
Grosjean, D. (1982), Formaldehyde and other carbonyls in Los Angeles
ambient air, Environ. Sci. Technol., 16, 254– 262.
Guenther, A., et al. (1995), A global model of volatile organic compound
emissions, J. Geophys. Res., 100, 8873 –8892.
Guenther, A. B., et al. (2000), Natural emissions of non-methane volatile
organic compounds, carbon monoxide and oxides of nitrogen from North
America, Atmos. Environ., 34, 2205– 2230.
Heald, C. L., et al. (2003), Asian outflow and trans-Pacific transport of
carbon monoxide and ozone pollution: An integrated satellite, aircraft,
and model perspective, J. Geophys. Res., 108(D24), 4804, doi:10.1029/
2003JD003507.
Heikes, B. G., et al. (2002), Atmospheric methanol budget and ocean im-
plication, Global Biogeochem. Cycles, 16(4), 1133, doi :10.1029 /
2002GB001895.
Holzinger, R., C. Warneke, A. Hansel, A. Jordan, W. Lindinger, D. H.
Scharffe, G. Schade, and P. J. Crutzen (1999), Biomass burning as a
source of formaldehyde, acetaldehyde, methanol, acetone, acetonitrile,
and hydrogen cyanide, Geophys. Res. Lett., 26, 1161– 1164.
Hurst, D. F., D. W. T. Griffith, and G. D. Cook (1994), Trace gas emissions
from biomass burning in tropical Australian savannas, J. Geophys. Res.,
99, 16,441 –16,456.
Iraci, L. T., A. M. Essin, and D. M. Golden (2002), Solubility of
methanol in low temperature aqueous sulfuric acid and implications
for atmospheric particle composition, J. Phys. Chem. A, 106(16),
4054 –4060.
Isidorov, V. A., I. G. Zenkench, and B. V. Iofe (1985), Volatile organic
compounds in the atmosphere of forests, Atmos. Environ., 19,1–8.
Jacob,D.J.,B.Heikes,B.S M.Fan,J.Logan,D.Mauzerall,J.D.
Bradshaw, H. B. Singh, G. L. Gregory, and G. Sachse (1996), Origin
of ozone and NO
x
in the tropical troposphere: A photochemical analysis
of aircraft observations over the South Atlantic basin, J. Geophys. Res.,
101, 24,235–24,250.
Jacob, D. J., B. D. Field, E. M. Jin, I. Bey, Q. Li, J. A. Logan, R. M.
Yantosca , and H. B. Singh (2002), Atmospheric budget of acetone ,
J. Geophys. Res., 107(D10), 4100, doi:10.1029/2001JD000694.
Jacob, D. J., J. H. Crawford, M. M. Kleb, V. S. Connors, R. J. Bendura,
J. L. Raper, G. W. Sachse, J. C. Gille, L. Emmons, and C. L. Heald
(2003), Transport and Chemical Evolution over the Pacific (TRACE-P)
aircraft mission: Design, execution, and first results, J. Geophys. Res.,
108(D20), 9000, doi:10.1029/2002JD003276.
Jaegle´, L., D. J. Jacob, W. H. Brune, and P. O. Wennberg (2001), Chem-
istry of HO
x
radicals in the upper troposphere, Atmos. Environ., 35,
469 –489.
Jang, M., N. M. Czoschke, S. Lee, and R. M. Kamens (2002), Heteroge-
neous atmospheric aerosol production by acid-catalyzed particle phase
reactions, Science, 298, 814 –817.
Jost, C., J. Trentmann, D. Sprung, M. O. Andreae, J. B. McQuaid, and
H. Barjat (2003), Trace gas chemistry in a young biomass burning plume
over Namibia: Observations and model simulations, J. Geophys. Res.,
108(D13), 8482, doi:10.1029/2002JD002431.
Karl, T., C. Sprig, J. Rinne, C. Stroud, P. Prevost, J. Greenberg, R. Fall, and
A. Guenther (2002), Virtual adjunct eddy covariance measurements of
organic com pound fluxes from subalpine forest using proton transfer
reaction mass spectrometry, Atmos. Chem. Phys., 2, 279 –291.
D15S07 SINGH ET AL.: OXYGENATED ORGANICS IN THE ATMOSPHERE
18 of 20
D15S07
Karl, T., A. J. Curtis, T. N. Rosensteil, R. K. Monson, and R. Fall (2003),
Transient releases of acetaldehyde from tree leaves- products of a pyr-
uvate overflow mechanism, Plant Cell Environ., 25, 1–11.
Kelsey, R. G. (1996), Anaerobic induced ethanol synthesis in the stems of
greenhouse-grown conifer seedlings, Trees, 10(3), 183 –188.
Kesselmeier, J., et al. (1997), Emission of short chained organic acids,
aldehydes, and monoterpenes from Quercus ilex L. and Pinus pinea L.
in relation to physiological activities, carbon budget, and emission algo-
rithms, Atmos. Environ., 31(SI), 119 –133.
Kimmerer, T. W., and R. C. MacDonald (1987), Acetaldehyde and ethanol
biosynthesis in plants, Plant Physiol., 84, 1204 –1209.
Kirstine, W., I. Galbally, Y. Ye, and M. Hooper (1998), Emissions of
volatile organic compounds (primarily oxygenated species) from pasture,
J. Geophys. Res., 103, 10,605 –10,619.
Kreuzwieser, J., F. Harren, L. Laarhoven, I. Boamfa, S. Lintel-Hekkert,
U. Scheerer, C. Huglin, and H. Rennenberg (2001), Acetaldehyde
emissions by the leaves of trees-correlation with physiological
and environmental parameters, Physiol. Plantarum, 113(1), 41 –
49.
Lamanna, M. S., and A. H. Goldstein (1999), In situ measurements of
C
2
-C
10
VOCs above a Sierra-Nevada pine plantation (including oxygen-
ated species) from pasture, J. Geophys. Res., 104, 21,247 –21,262.
Lee, M., B. C. Noone, D. O’Sullivan, and B. G. Heikes (1995), Method for
the collection and HPLC analysis of hydrogen peroxide and C
1
and C
2
hydroperoxides in the atmosphere, J. Atmos. Oceanic Technol., 12,
1060 –1070.
Lee, M., B. G. Heikes, and D. W. O’Sullivan (2000), Hydrogen peroxide
and organic hydroperoxide in the troposphere: A review, Atmos. Environ.,
34, 3475 –3494.
Li, P., K. A. Perreau, E. Covington, C. H. Song, G. R. Carmichael, and
V. H. Grassian (2001), Heterog eneous reactions of VOCs on oxide
particles of the most abunda nt crustal elements: Surface reactions of
acetaldehyde, acetone and propionaldehyde on SiO
2
,Fe
2
O
3
,TiO
2
and
CaO, J. Geophys. Res., 106, 5517 –5529.
Lobert, J. M., W. C. Keene, J. A. Logan, and R. Yevich (1999), Global
chlorine emissions from biomass burning: Reactive chlorine emissions
inventory, J. Geophys. Res., 104, 8373 –8389.
Martinez, R. D., A. A. Buitrago, N. W. Howell, C. H. Hearn, and J. A.
Joens (1992), The near UV absorption spectra of several aldehydes and
ketones at 300 K, Atmos. Environ., Part A, 26, 785– 792.
Mauzerall, D. L., J. A. Logan, D. J. Jacob, B. E. Anderson, D. R. Blake,
J. D. Bradshaw, B. Heikes, G. W. Sachse, H. B. Singh, and R. Talbot
(1998), Photochemistry in biomass burning plumes and implications for
tropospheric ozone over the tropical South Atlantic, J. Geophys. Res.,
103, 8401 –8423.
McKeen, S. A., T. Gierczak, J. B. Burkholder, P. O. Wennberg, T. F.
Hanisco, E. R. Keim, R S. Gao, S. C. Liu, A. R. Ravishankara, and
D. W. Fahey (1997), The photochemistry of acetone in the upper tropo-
sphere: A source of odd -hydrogen radicals, Geophys.Res.Lett., 24,
3177 –3180.
Mu¨ller, J F., and G. Brasseur (1999), Sources of upper tropospheric HO
x
:
A three-dimensional study, J. Geophys. Res., 104, 1705 –1715.
Nguyen, H. T., N. Takenaka, H. Bandow, Y. Maeda, S. T. de Oliva, M. M. F.
Botelho, and T. M. Tavares (2001), Atmospheric alcohols and aldehydes
concentrations measured in Osaka, Japan and in Sao Paulo, Brazil,
Atmos. Environ., 35, 3075– 3083.
O’Sullivan, D. W., B. G. Heikes, J. Snow, P. Burrow, M. Avery, D. R.
Blake, G. W. Sachse, R. W. Talbot, D. C. Thornton, and A. R. Bandy
(2004), Long-term and seasonal variations in the levels of hydrogen
peroxide, methylhydroperoxide, and selected compounds over the
Pacific Ocean, J. Geophys. Res., 109, doi:10.1029/2003JD003689, in
press.
Potter, C., S. Klooster, D. Bubenheim, H. B. Singh, and R. Myneni (2003),
Modeling terrestrial biogenic sources of oxygenated organic emissions,
Earth Interactions, 7, paper 7.
Reiner, T., D. Sprung, C. Jost, R. Gabriel, O. L. Mayol-Bracero, M. O.
Andreae, T. L. Campos, and R. E. Shetter (2001), Chemical characteriza-
tion of pollution layers over the tropical Indian Ocean: Signatures of
emissions from biomass and fossil fuel burning, J. Geophys. Res., 106,
28,497 –28,510.
Riemer, D., et al. (1998), Observations of nonmethane hydrocarbons and
oxygenated volatile organic compounds at a rural site in the southeastern
United States, J. Geophys. Res., 103, 28,111 –28,128.
Schade, G. W., and A. H. Goldstein (2001), Fluxes of oxygenated volatile
organic compounds from a ponderosa pine plantation, J. Geophys. Res.,
106, 3111 – 3123.
Schade, G. W., and A. H. Goldstein (2002), Plant physiological influences
on the fluxes of oxygenated volatile organic compounds from a ponder-
osapinetrees,J. Geophys. Res., 107(D10), 4082, doi:10.1029/
2001JD000532.
Shepson, P. B., D. Hastie, H. Schiff, M. Polizzi, J. W. Bottenheim,
K. Anlauf, G. I. Mackay, and D. R. Karecki (1991), Atmospheric
concentrations and temporal variations of C
1
-C
3
carbonyl compounds
at two rural sites in central Ontario, Atmos. Environ., Part A, 25,
2001 –2015.
Sigsby, J. E., S. Tejada, W. Ray, J. M. Lang, and J. W. Duncan (1987),
Volatile organic com pound emissions from 46 in-use p assenger cars,
Environ. Sci. Technol., 21, 466 –475.
Singh, H. B., and P. B. Zimmerman (1992), Atmospheric distributions and
sources of nonmethane hydrocarbons, Adv. Environ. Sci. Technol., 24,
177 –235.
Singh, H. B., et al. (1994), Acetone in the atmosphere: Distribution, sources
and sinks, J. Geophys. Res., 99, 1805 –1819.
Singh, H. B., M. Kanakidou, P. J. Crutzen, and D. J. Jacob (1995), High
concentrations and photochemical fate of oxygenated hydrocarbons in the
global troposphere, Nature, 378, 50– 54.
Singh, H., et al. (2000), Distribution and fate of selected oxygenated or-
ganic species in the troposphere and lower stratosphere over the Atlantic,
J. Geophys. Res., 105, 3795 –3806.
Singh, H. B., Y. Chen, A. Staudt, D. Jacob, D. Blake, B. Heikes,
and J. Snow (2001), Evidence from the Pacific troposphere for large
global sources of oxygenated organic compounds, Nature, 410, 1078–
1081.
Singh, H. B., et al. (2003a), In situ measurements of HCN and CH3CN in
the Pacific troposphere: Sources, sinks, and budgets, J. Geophys. Res.,
108(D20), 8795, doi:10.1029/2002JD003006.
Singh, H. B., A. Tabazadeh, M. J. Evans, B. D. Field, D. J. Jacob,
G.Sachse,J.H.Crawford,R.Shetter,andW.H.Brune(2003b),
Oxygenated volatile organic chemicals in the oceans: Inferences and
implications based on atmospheric observations and air-sea exchange
models, Geophys. Res. Lett., 30(16), 1862, doi:10.1029/2003GL017933.
Snider, J. R., and G. A. Dawson (1985), Tropospheric light
alcohols, carbonyls, and acetonitrile: Concentrations in the southwestern
United States and Henry’s law data, J. Geophys. Res., 90, 3797– 3805.
Solberg, S., C. Dye, N. Schmindbauer, A. Herzog, and R. Gehrig (1996),
Carbonyls and nonmethane hydrocarbons at rural European sites from the
Mediterranean to the arctic, J. Atmos. Chem., 25, 33 –66.
Staudt, A. C., D. J. Jacob, F. Ravetta, J. A. Logan, D. Bachiochi, T. N.
Krishnamurti, S. Sandholm, B. Ridley, H. B. Singh, and B. Talbot
(2003), Sources and chemistry of nitrogen oxides over the
tropical Pacific, J. Geophys. Res., 108(D2), 8239, doi:10.1029/
2002JD002139.
Tabazadeh, A., R. J. Yokelson, H. B. Singh, P. V. Hobbs, J. H. Crawford,
and L. T. Iraci (2004), Heterogeneous chemistry involving methanol in
tropospheric clouds, Geophys. Res. Lett., 31(1), L06114, doi:10.1029/
2003GL018775.
Tanner, R. L., B. Zielinska, E. Uverna, G. Harshfield, and A. P. McNichol
(1996), Concentrations of carbonyl compounds and the carbon isotopy of
formaldehyde at a coatal site in Nova Scotia during the NARE summer
intensive, J. Geophys. Res., 101, 28,967 –28,970.
Villanueva-Fierro, I., C. J. Popp, and R. S. Martin (2004), Biogenic
emissions and ambient concentratiosn of hydrocarbons, carbonyl com-
pounds and organic acids from Pondorosa pine and Cottonwood trees
of rural and forested sites in central New Mexico, Atmos. Environ.,in
press.
Warneck, P. (1999), Chemistry of the Natural Atmosphere, 2nd ed., Aca-
demic, San Diego, Calif.
Warneke, C., T. Karl, H. Judmaier, A. Hansel, A. Jordan, W. Lindinger, and
P. J. Crutzen (1999), Acetone, methanol, and other partially oxidized
volatile organic emissions from dead plant matter by a biological pro-
cesses: Significance for atmospheric HO
x
chemistry, Global Biogeochem.
Cycles, 13, 9 –17.
Wennberg, P. O., et al. (1998), Hydrogen radicals, nitrogen radicals, and
the production of ozone in the upper troposphere, Science, 279,49–
53.
Wisthaler, A., A. Hansel, R. R. Dickerson, and P. J. Crutzen (2002), Or-
ganic trace gas measurements by PTR-MS during INDOEX 1999,
J. Geophys. Res., 107(D19), 8024, doi:10.1029/2001JD000576.
Yevich, R., and J. A. Logan (2003), An assessment of biofuel use and
burning of agricultural waste in the developing world, Global Biogeo-
chem. Cycles, 17(4), 1095, doi:10.1029/2002GB001952.
Yokelson, R. J., et al. (1999), Emissions of formaldehyde, acetic acid,
methanol, and other trace gases from biomass fires in North Carolina
measured by measured by airborne Fourier transform infrared spectros-
copy, J. Geophys. Res., 104, 30,109 –30,125.
Yokelson, R. J., I. T. Bertschi, T. J. Christian, P. V. Hobbs, D. E. Ward, and
W. M. Hao (2003), Trace gas measurements in nascent, aged, and cloud-
processed smoke from African savanna fires by airborne Fourier trans-
form infrared spectroscopy (AFTIR), J. Geophys. Res., 108(D13), 8485,
doi:10.1029/2002JD002352.
D15S07 SINGH ET AL.: OXYGENATED ORGANICS IN THE ATMOSPHERE
19 of 20
D15S07
Zhou, X., and K. Mopper (1993), Carbonyl compounds in the lower marine
troposphere over the Caribbean Sea and Bahamas, J. Geophys. Res., 98,
2385 –2392.
Zhou, X., and K. Mopper (1997), Photochemical production of low-mole-
cular-weight carbonyl compounds in seawater and surface microlayer and
their air-sea exchange, Mar. Chem., 56, 201–213.
M. A. Avery, J. H. Crawford, and G. Sachse, NASA Langley Research
Center, Atmospheric Sciences Division, Mail Stop 483, Hampton, VA
23681-2199, USA. (; james.h.crawford@nasa.
gov; )
D. Blake, Department of Chemistry, University of California, 516
Rowland Hall, Irvine, CA 92697-2025, USA. ()
R. B. Chatfield, E. Czech, L. J. Salas, and H. B. Singh, NASA Ames
Research Center, Mail Stop 245-5, Moffett Field, CA 94035, USA.
(; ;
nasa.gov; )
M. J. Evans, B. D. Field, and D. J. Jacob, Division of Applied
Sciences, Pierce Hall, 29 Oxford Street, Harvard University, Cambridge,
MA 02138, USA. (; ; djj@io.
harvard.edu)
A. Fried and J. Walega, Atmospheric Chemistry Division, National
Center for Atmospheric Research, P.O. Box 3000, Boulder, CO 80307,
USA. (; )
H. F uelberg, Meteorology Department, Florida State University,
404 Love Building, Tallahassee, FL 32306, USA. (
edu)
B. Heikes, GSO/CACS, University of Rhode Island, South Ferry Road,
Narragansett, RI 02882-1197, USA. ()
S. Sandholm, School of Earth and Atmospheric Sciences, Georgia
Institute of Technology, Baker Bldg., Room 107, Atlanta, GA 30332, USA.
()
R. Talbot, Institute for the Study of Earth, Oceans, and Space,
University of New Hampshire, Morse Hall, 39 College Road, Durham,
NH 03824, USA. ()
D15S07 SINGH ET AL.: OXYGENATED ORGANICS IN THE ATMOSPHERE
20 of 20
D15S07