APPENDIX A TO PART 136 METHODS FOR ORGANIC CHEMICAL ANALYSIS OF MUNICIPAL AND INDUSTRIAL WASTEWATER: METHOD 605—BENZIDINES pdf
Bạn đang xem bản rút gọn của tài liệu. Xem và tải ngay bản đầy đủ của tài liệu tại đây (98.15 KB, 17 trang )
APPENDIX A TO PART 136
METHODS FOR ORGANIC CHEMICAL ANALYSIS OF MUNICIPAL AND
INDUSTRIAL WASTEWATER
METHOD 605—BENZIDINES
1. Scope and Application
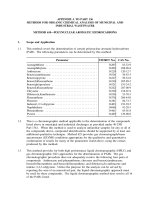
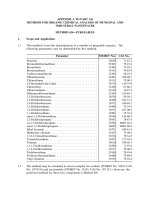
1.1 This method covers the determination of certain benzidines. The following parameters
can be determined by this method:
Parameter Storet No. CAS No.
Benzidine 39120 92-87-5
3,3'-Dichlorobenzidine 34631 91-94-1
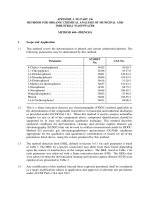
1.2 This is a high performance liquid chromatography (HPLC) method applicable to the
determination of the compounds listed above in municipal and industrial discharges as
provided under 40 CFR Part 136.1. When this method is used to analyze unfamiliar
samples for the compounds above, identifications should be supported by at least one
additional qualitative technique. This method describes electrochemical conditions at a
second potential which can be used to confirm measurements made with this method.
Method 625 provides gas chromatograph/mass spectrometer (GC/MS) conditions
appropriate for the qualitative and quantitative confirmation of results for the parameters
listed above, using the extract produced by this method.
1.3 The method detection limit (MDL, defined in Section 14.1) for each parameter is listed
1
in Table 1. The MDL for a specific wastewater may differ from those listed, depending
upon the nature of the interferences in the sample matrix.
1.4 Any modification of this method, beyond those expressly permitted, shall be considered
as a major modification subject to application and approval of alternate test procedures
under 40 CFR Parts 136.4 and 136.5.
1.5 This method is restricted to use by or under the supervision of analysts experienced in
the use of HPLC instrumentation and in the interpretation of liquid chromatograms.
Each analyst must demonstrate the ability to generate acceptable results with this method
using the procedure described in Section 8.2.
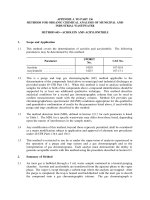
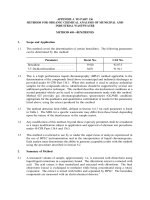
2. Summary of Method
2.1 A measured volume of sample, approximately 1-L, is extracted with chloroform using
liquid-liquid extractions in a separatory funnel. The chloroform extract is extracted with
acid. The acid extract is then neutralized and extracted with chloroform. The final
chloroform extract is exchanged to methanol while being concentrated using a rotary
evaporator. The extract is mixed with buffer and separated by HPLC. The benzidine
compounds are measured with an electrochemical detector.
2
2.2 The acid back-extraction acts as a general purpose cleanup to aid in the elimination of
interferences.
3. Interferences
3.1 Method interferences may be caused by contaminants in solvents, reagents, glassware,
and other sample processing hardware that lead to discrete artifacts and/or elevated
baselines in chromatograms. All of these materials must be routinely demonstrated to
be free from interferences under the conditions of the analysis by running laboratory
reagent blanks as described in Section 8.1.3.
3.1.1 Glassware must be scrupulously cleaned. Clean all glassware as soon as possible
3
after use by rinsing with the last solvent used in it. Solvent rinsing should be
followed by detergent washing with hot water, and rinses with tap water and
distilled water. The glassware should then be drained dry, and heated in a
muffle furnace at 400°C for 15-30 minutes. Some thermally stable materials may
not be eliminated by this treatment. Solvent rinses with acetone and pesticide
quality hexane may be substituted for the muffle furnace heating. Volumetric
ware should not be heated in a muffle furnace. After drying and cooling,
glassware should be sealed and stored in a clean environment to prevent any
accumulation of dust or other contaminants. Store inverted or capped with
aluminum foil.
3.1.2 The use of high purity reagents and solvents helps to minimize interference
problems. Purification of solvents by distillation in all-glass systems may be
required.
3.2 Matrix interferences may be caused by contaminants that are co-extracted from the
sample. The extent of matrix interferences will vary considerably from source to source,
depending upon the nature and diversity of the industrial complex or municipality being
sampled. The cleanup procedures that are inherent in the extraction step are used to
overcome many of these interferences, but unique samples may require additional
cleanup approaches to achieve the MDL listed in Table 1.
3.3 Some dye plant effluents contain large amounts of components with retention times
closed to benzidine. In these cases, it has been found useful to reduce the electrode
potential in order to eliminate interferences and still detect benzidine. (See Section 12.7.)
4. Safety
4.1 The toxicity or carcinogenicity of each reagent used in this method has not been precisely
defined; however, each chemical compound should be treated as a potential health
hazard. From this viewpoint, exposure to these chemicals must be reduced to the lowest
possible level by whatever means available. The laboratory is responsible for maintaining
a current awareness file of OSHA regulations regarding the safe handling of the
chemicals specified in this method. A reference file of material data handling sheets
should also be made available to all personnel involved in the chemical analysis.
Additional references to laboratory safety are available and have been identified for
4-6
the information of the analyst.
4.2 The following parameters covered by this method have been tentatively classified as
known or suspected, human or mammalian carcinogens: benzidine and
3,3′-dichlorobenzidine. Primary standards of these toxic compounds should be prepared
in a hood. A NIOSH/MESA approved toxic gas respirator should be worn when the
analyst handles high concentrations of these toxic compounds.
4.3 Exposure to chloroform should be minimized by performing all extractions and extract
concentrations in a hood or other well-ventilated area.
5. Apparatus and Materials
5.1 Sampling equipment, for discrete or composite sampling.
5.1.1 Grab sample bottle—1 L or 1 qt, amber glass, fitted with a screw cap lined with
Teflon. Foil may be substituted for Teflon if the sample is not corrosive. If amber
bottles are not available, protect samples from light. The bottle and cap liner
must be washed, rinsed with acetone or methylene chloride, and dried before use
to minimize contamination.
5.1.2 Automatic sampler (optional)—The sampler must incorporate glass sample
containers for the collection of a minimum of 250 mL of sample. Sample
containers must be kept refrigerated at 4°C and protected from light during
compositing. If the sampler uses a peristaltic pump, a minimum length of
compressible silicone rubber tubing may be used. Before use, however, the
compressible tubing should be thoroughly rinsed with methanol, followed by
repeated rinsings with distilled water to minimize the potential for contamination
of the sample. An integrating flow meter is required to collect flow proportional
composites.
5.2 Glassware (All specifications are suggested)
5.2.1 Separatory funnels—2000, 1000, and 250 mL, with Teflon stopcock.
5.2.2 Vials—10-15 mL, amber glass, with Teflon-lined screw cap.
5.2.3 Rotary evaporator.
5.2.4 Flasks—Round bottom, 100 mL, with 24/40 joints.
5.2.5 Centrifuge tubes—Conical, graduated, with Teflon-lined screw caps.
5.2.6 Pipettes—Pasteur, with bulbs.
5.3 Balance—Analytical, capable of accurately weighing 0.0001 g.
5.4 High performance liquid chromatograph (HPLC)—An analytical system complete with
column supplies, high pressure syringes, detector, and compatible recorder. A data
system is recommended for measuring peak areas and retention times.
5.4.1 Solvent delivery system—With pulse damper, Altex 110A or equivalent.
5.4.2 Injection valve (optional)—Waters U6K or equivalent.
5.4.3 Electrochemical detector—Bioanalytical Systems LC-2A with glassy carbon
electrode, or equivalent. This detector has proven effective in the analysis of
wastewaters for the parameters listed in the scope (Section 1.1), and was used to
develop the method performance statements in Section 14. Guidelines for the use
of alternate detectors are provided in Section 12.1.
5.4.4 Electrode polishing kit—Princeton Applied Research Model 9320 or equivalent.
5.4.5 Column—Lichrosorb RP-2, 5 micron particle diameter, in a 25 cm x 4.6 mm ID
stainless steel column. This column was used to develop the method performance
statements in Section 14. Guidelines for the use of alternate column packings are
provided in Section 12.1.
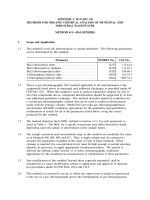
6. Reagents
6.1 Reagent water—Reagent water is defined as a water in which an interferent is not
observed at the MDL of the parameters of interest.
6.2 Sodium hydroxide solution (5 N)—Dissolve 20 g of NaOH (ACS) in reagent water and
dilute to 100 mL.
6.3 Sodium hydroxide solution (1 M)—Dissolve 40 g of NaOH (ACS) in reagent water and
dilute to 1 L.
6.4 Sodium thiosulfate—(ACS) Granular.
6.5 Sodium tribasic phosphate (0.4 M)—Dissolve 160 g of trisodium phosphate decahydrate
(ACS) in reagent water and dilute to 1 L.
6.6 Sulfuric acid (1+1)—Slowly, add 50 mL of H SO (ACS, sp. gr. 1.84) to 50 mL of reagent
24
water.
6.7 Sulfuric acid (1 M)—Slowly, add 58 mL of H SO (ACS, sp. gr. 1.84) to reagent water and
24
dilute to 1 L.
6.8 Acetate buffer (0.1 M, pH 4.7)—Dissolve 5.8 mL of glacial acetic acid (ACS) and 13.6 g
of sodium acetate trihydrate (ACS) in reagent water which has been purified by filtration
through a RO–4 Millipore System or equivalent and dilute to 1 L.
6.9 Acetonitrile, chloroform (preserved with 1% ethanol), methanol—Pesticide quality or
equivalent.
6.10 Mobile phase—Place equal volumes of filtered acetonitrile (Millipore type FH filter or
equivalent) and filtered acetate buffer (Millipore type GS filter or equivalent) in a
narrow-mouth, glass container and mix thoroughly. Prepare fresh weekly. Degas daily
by sonicating under vacuum, by heating an stirring, or by purging with helium.
6.11 Stock standard solutions (1.00 µg/µL)—Stock standard solutions may be prepared from
pure standard materials or purchased as certified solutions.
6.11.1 Prepare stock standard solutions by accurately weighing about 0.0100 g of pure
material. Dissolve the material in methanol and dilute to volume in a 10 mL
volumetric flask. Larger volumes can be used at the convenience of the analyst.
When compound purity is assayed to be 96% or greater, the weight can be used
without correction to calculate the concentration of the stock standard.
Commercially prepared stock standards can be used at any concentration if they
are certified by the manufacturer or by an independent source.
6.11.2 Transfer the stock standard solutions into Teflon-sealed screw-cap bottles. Store
at 4°C and protect from light. Stock standard solutions should be checked
frequently for signs of degradation or evaporation, especially just prior to
preparing calibration standards from them.
6.11.3 Stock standard solutions must be replaced after six months, or sooner if
comparison with check standards indicates a problem.
6.12 Quality control check sample concentrate—See Section 8.2.1.
7. Calibration
7.1 Establish chromatographic operating conditions equivalent to those given in Table 1. The
HPLC system can be calibrated using the external standard technique (Section 7.2) or the
internal standard technique (Section 7.3).
7.2 External standard calibration procedure
7.2.1 Prepare calibration standards at a minimum of three concentration levels for each
parameter of interest by adding volumes of one or more stock standards to a
volumetric flask and diluting to volume with mobile phase. One of the external
standards should be at a concentration near, but above, the MDL (Table 1) and
the other concentrations should correspond to the expected range of
concentrations found in real samples or should define the working range of the
detector.
7.2.2 Using syringe injections of 5-25 µL or a constant volume injection loop, analyze
each calibration standard according to Section 12 and tabulate peak height or area
responses against the mass injected. The results can be used to prepare a
calibration curve for each compound. Alternatively, if the ratio of response to
amount injected (calibration factor) is a constant over the working range (<10%
relative standard deviation, RSD), linearity through the origin can be assumed
and the average ratio or calibration factor can be used in place of a calibration
curve.
7.3 Internal standard calibration procedure—To use this approach, the analyst must select
one or more internal standards that are similar in analytical behavior to the compounds
of interest. The analyst must further demonstrate that the measurement of the internal
This equation corrects an error made in the original method publication (49 FR 43234,
October 26, 1984). This correction will be formalized through a rulemaking in FY97.
standard is not affected by method or matrix interferences. Because of these limitations,
no internal standard can be suggested that is applicable to all samples.
7.3.1 Prepare calibration standards at a minimum of three concentration levels for each
parameter of interest by adding volumes of one or more stock standards to a
volumetric flask. To each calibration standard, add a known constant amount of
one or more internal standards, and dilute to volume with mobile phase. One of
the standards should be at a concentration near, but above, the MDL and the
other concentrations should correspond to the expected range of concentrations
found in real samples or should define the working range of the detector.
7.3.2 Using syringe injections of 5-25 µL or a constant volume injection loop, analyze
each calibration standard according to Section 12 and tabulate peak height or area
responses against concentration for each compound and internal standard.
Calculate response factors (RF) for each compound using Equation 1.
Equation 1
where:
A = Response for the parameter to be measured.
s
A = Response for the internal standard.
is
C = Concentration of the internal standard (µg/L).
is
C = Concentration of the parameter to be measured (µg/L).
s
If the RF value over the working range is a constant (<10% RSD), the RF can be
assumed to be invariant and the average RF can be used for calculations.
Alternatively, the results can be used to plot a calibration curve of response ratios,
A /A , vs. concentration ratios C /C .
sis sis
*
7.4 The working calibration curve, calibration factor, or RF must be verified on each working
day by the measurement of one or more calibration standards. If the response for any
parameter varies from the predicted response by more than ±15%, a new calibration
curve must be prepared for that compound. If serious loss of response occurs, polish the
electrode and recalibrate.
7.5 Before using any cleanup procedure, the analyst must process a series of calibration
standards through the procedure to validate elution patterns and the absence of
interferences from the reagents.
8. Quality Control
8.1 Each laboratory that uses this method is required to operate a formal quality control
program. The minimum requirements of this program consist of an initial demonstration
of laboratory capability and an ongoing analysis of spiked samples to evaluate and
document data quality. The laboratory must maintain records to document the quality
of data that is generated. Ongoing data quality checks are compared with established
performance criteria to determine if the results of analyses meet the performance
characteristics of the method. When results of sample spikes indicate atypical method
performance, a quality control check standard must be analyzed to confirm that the
measurements were performed in an in-control mode of operation.
8.1.1 The analyst must make an initial, one-time, demonstration of the ability to
generate acceptable accuracy and precision with this method. This ability is
established as described in Section 8.2.
8.1.2 In recognition of advances that are occurring in chromatography, the analyst is
permitted certain options (detailed in Sections 10.9, 11.1, and 12.1) to improve the
separations or lower the cost of measurements. Each time such a modification is
made to the method, the analyst is required to repeat the procedure in Section 8.2.
8.1.3 Before processing any samples, the analyst must analyze a reagent water blank
to demonstrate that interferences from the analytical system and glassware are
under control. Each time a set of samples is extracted or reagents are changed,
a reagent water blank must be processed as a safeguard against laboratory
contamination.
8.1.4 The laboratory must, on an ongoing basis, spike and analyze a minimum of 10%
of all samples to monitor and evaluate laboratory data quality. This procedure
is described in Section 8.3.
8.1.5 The laboratory must, on an ongoing basis, demonstrate through the analyses of
quality control check standards that the operation of the measurement system is
in control. This procedure is described in Section 8.4. The frequency of the check
standard analyses is equivalent to 10% of all samples analyzed but may be
reduced if spike recoveries from samples (Section 8.3) meet all specified quality
control criteria.
8.1.6 The laboratory must maintain performance records to document the quality of
data that is generated. This procedure is described in Section 8.5.
8.2 To establish the ability to generate acceptable accuracy and precision, the analyst must
perform the following operations.
8.2.1 A quality control (QC) check sample concentrate is required containing benzidine
and/or 3,3'-dichlorobenzidine at a concentration of 50 µg/mL each in methanol.
The QC check sample concentrate must be obtained from the U.S. Environmental
Protection Agency, Environmental Monitoring and Support Laboratory in
Cincinnati, Ohio, if available. If not available from that source, the QC check
sample concentrate must be obtained from another external source. If not
available from either source above, the QC check sample concentrate must be
prepared by the laboratory using stock standards prepared independently from
those used for calibration.
8.2.2 Using a pipet, prepare QC check samples at a concentration of 50 µg/L by adding
1.00 mL of QC check sample concentrate to each of four 1 L aliquots of reagent
water.
8.2.3 Analyze the well-mixed QC check samples according to the method beginning in
Section 10.
8.2.4 Calculate the average recovery ( ) in µg/L, and the standard deviation of the
recovery (s) in µg/L, for each parameter using the four results.
8.2.5 For each parameter compare s and with the corresponding acceptance criteria
for precision and accuracy, respectively, found in Table 2. If s and for all
parameters of interest meet the acceptance criteria, the system performance is
acceptable and analysis of actual samples can begin. If any individual s exceeds
the precision limit or any individual falls outside the range for accuracy, the
system performance is unacceptable for that parameter. Locate and correct the
source of the problem and repeat the test for all parameters of interest beginning
with Section 8.2.2.
8.3 The laboratory must, on an ongoing basis, spike at least 10% of the samples from each
sample site being monitored to assess accuracy. For laboratories analyzing one to ten
samples per month, at least one spiked sample per month is required.
8.3.1 The concentration of the spike in the sample should be determined as follows:
8.3.1.1 If, as in compliance monitoring, the concentration of a specific parameter
in the sample is being checked against a regulatory concentration limit, the
spike should be at that limit or one to five times higher than the
background concentration determined in Section 8.3.2, whichever
concentration would be larger.
8.3.1.2 If the concentration of a specific parameter in the sample is not being
checked against a limit specific to that parameter, the spike should be at
50 µg/L or one to five times higher than the background concentration
determined in Section 8.3.2, whichever concentration would be larger.
8.3.1.3 If it is impractical to determine background levels before spiking
(e.g., maximum holding times will be exceeded), the spike concentration
should be (1) the regulatory concentration limit, if any; or, if none (2) the
larger of either five times higher than the expected background
concentration or 50 µg/L.
8.3.2 Analyze one sample aliquot to determine the background concentration (B) of
each parameter. If necessary, prepare a new QC check sample concentrate
(Section 8.2.1) appropriate for the background concentrations in the sample. Spike
a second sample aliquot with 1.0 mL of the QC check sample concentrate and
analyze it to determine the concentration after spiking (A) of each parameter.
Calculate each percent recovery (P) as 100(A-B)%/T, where T is the known true
value of the spike.
8.3.3 Compare the percent recovery (P) for each parameter with the corresponding QC
acceptance criteria found in Table 2. These acceptance criteria were calculated to
include an allowance for error in measurement of both the background and spike
concentrations, assuming a spike to background ratio of 5:1. This error will be
accounted for to the extent that the analyst's spike to background ratio
approaches 5:1. If spiking was performed at a concentration lower than 50 µg/L,
7
the analyst must use either the QC acceptance criteria in Table 2, or optional QC
acceptance criteria calculated for the specific spike concentration. To calculate
optional acceptance criteria for the recovery of a parameter: (1) Calculate
accuracy (X') using the equation in Table 3, substituting the spike concentration
(T) for C; (2) calculate overall precision (S') using the equation in Table 3,
substituting X' for ; (3) calculate the range for recovery at the spike
concentration as (100 X'/T) ±2.44 (100 S'/T)%.
7
8.3.4 If any individual P falls outside the designated range for recovery, that parameter
has failed the acceptance criteria. A check standard containing each parameter
that failed the criteria must be analyzed as described in Section 8.4.
8.4 If any parameter fails the acceptance criteria for recovery in Section 8.3, a QC check
standard containing each parameter that failed must be prepared and analyzed.
NOTE: The frequency for the required analysis of a QC check standard will depend
upon the number of parameters being simultaneously tested, the complexity
of the sample matrix, and the performance of the laboratory.
8.4.1 Prepare the QC check standard by adding 1.0 mL of QC check sample concentrate
(Section 8.2.1 or 8.3.2) to 1 L of reagent water. The QC check standard needs only
to contain the parameters that failed criteria in the test in Section 8.3.
8.4.2 Analyze the QC check standard to determine the concentration measured (A) of
each parameter. Calculate each percent recovery (P ) as 100 (A/T)%, where T is
s
the true value of the standard concentration.
8.4.3 Compare the percent recovery (P ) for each parameter with the corresponding QC
s
acceptance criteria found in Table 2. Only parameters that failed the test in
Section 8.3 need to be compared with these criteria. If the recovery of any such
parameter falls outside the designated range, the laboratory performance for that
parameter is judged to be out of control, and the problem must be immediately
identified and corrected. The analytical result for that parameter in the unspiked
sample is suspect and may not be reported for regulatory compliance purposes.
8.5 As part of the QC program for the laboratory, method accuracy for wastewater samples
must be assessed and records must be maintained. After the analysis of five spiked
wastewater samples as in Section 8.3, calculate the average percent recovery ( ) and the
standard deviation of the percent recovery (s ). Express the accuracy assessment as a
p
percent recovery interval from -2s to +2s . If =90% and s =10%, for example, the
pp p
accuracy interval is expressed as 70-110%. Update the accuracy assessment for each
parameter on a regular basis (e.g., after each 5-10 new accuracy measurements).
8.6 It is recommended that the laboratory adopt additional quality assurance practices for
use with this method. The specific practices that are most productive depend upon the
needs of the laboratory and the nature of the samples. Field duplicates may be analyzed
to assess the precision of the environmental measurements. When doubt exists over the
identification of a peak on the chromatogram, confirmatory techniques such as HPLC
with a dissimilar column, gas chromatography, or mass spectrometer must be used.
Whenever possible, the laboratory should analyze standard reference materials and
participate in relevant performance evaluation studies.
9. Sample Collection, Preservation, and Handling
9.1 Grab samples must be collected in glass containers. Conventional sampling practices
8
should be followed, except that the bottle must not be prerinsed with sample before
collection. Composite samples should be collected in refrigerated glass containers in
accordance with the requirements of the program. Automatic sampling equipment must
be as free as possible of Tygon tubing and other potential sources of contamination.
9.2 All samples must be iced or refrigerated at 4°C and stored in the dark from the time of
collection until extraction. Both benzidine and 3,3′-dichlorobenzidine are easily oxidized.
Fill the sample bottles and, if residual chlorine is present, add 80 mg of sodium
thiosulfate per liter of sample and mix well. EPA Methods 330.4 and 330.5 may be used
for measurement of residual chlorine. Field test kits are available for this purpose. After
9
mixing, adjust the pH of the sample to a range of 2-7 with sulfuric acid.
9.3 If 1,2-diphenylhydrazine is likely to be present, adjust the pH of the sample to 4.0 ±0.2
to prevent rearrangement to benzidine.
9.4 All samples must be extracted within seven days of collection. Extracts may be held up
to seven days before analysis, if stored under an inert (oxidant free) atmosphere. The
2
extract should be protected from light.
10. Sample Extraction
10.1 Mark the water meniscus on the side of the sample bottle for later determination of
sample volume. Pour the entire sample into a 2-L separatory funnel. Check the pH of
the sample with wide-range pH paper and adjust to within the range of 6.5 - 7.5 with
sodium hydroxide solution or sulfuric acid.
10.2 Add 100 mL of chloroform to the sample bottle, seal, and shake 30 seconds to rinse the
inner surface. (Caution: Handle chloroform in a well ventilated area.) Transfer the
solvent to the separatory funnel and extract the sample by shaking the funnel for two
minutes with periodic venting to release excess pressure. Allow the organic layer to
separate from the water phase for a minimum of 10 minutes. If the emulsion interface
between layers is more than one-third the volume of the solvent layer, the analyst must
employ mechanical techniques to complete the phase separation. The optimum technique
depends upon the sample, but may include stirring, filtration of the emulsion through
glass wool, centrifugation, or other physical methods. Collect the chloroform extract in
a 250 mL separatory funnel.
10.3 Add a-50 mL volume of chloroform to the sample bottle and repeat the extraction
procedure a second time, combining the extracts in the separatory funnel. Perform a
third extraction in the same manner.
10.4 Separate and discard any aqueous layer remaining in the 250 mL separatory funnel after
combining the organic extracts. Add 25 mL of 1 M sulfuric acid and extract the sample
by shaking the funnel for two minutes. Transfer the aqueous layer to a 250-mL beaker.
Extract with two additional 25 mL portions of 1 M sulfuric acid and combine the acid
extracts in the beaker.
10.5 Place a stirbar in the 250 mL beaker and stir the acid extract while carefully adding 5 mL
of 0.4 M sodium tribasic phosphate. While monitoring with a pH meter, neutralize the
extract to a pH between 6 and 7 by dropwise addition of 5 N sodium hydroxide solution
while stirring the solution vigorously. Approximately 25-30 mL of 5 N sodium
hydroxide solution will be required and it should be added over at least a two-minute
period. Do not allow the sample pH to exceed 8.
10.6 Transfer the neutralized extract into a 250-mL separatory funnel. Add 30 mL of
chloroform and shake the funnel for two minutes. Allow the phases to separate, and
transfer the organic layer to a second 250-mL separatory funnel.
10.7 Extract the aqueous layer with two additional 20 mL aliquots of chloroform as before.
Combine the extracts in the 250-mL separatory funnel.
10.8 Add 20 mL of reagent water to the combined organic layers and shake for 30 seconds.
10.9 Transfer the organic extract into a 100-mL round bottom flask. Add 20 mL of methanol
and concentrate to 5 mL with a rotary evaporator at reduced pressure and 35°C. An
aspirator is recommended for use as the source of vacuum. Chill the receiver with ice.
This operation requires approximately 10 minutes. Other concentration techniques may
be used if the requirements of Section 8.2 are met.
10.10 Using a 9 in. pasteur pipette, transfer the extract to a 15-mL, conical, screw-cap centrifuge
tube. Rinse the flask, including the entire side wall, with 2 mL portions of methanol and
combine with the original extract.
10.11 Carefully concentrate the extract to 0.5 mL using a gentle stream of nitrogen while
heating in a 30°C water bath. Dilute to 2 mL with methanol, reconcentrate to 1 mL, and
dilute to 5 mL with acetate buffer. Mix the extract thoroughly. Cap the centrifuge tube
and store refrigerated and protected from light if further processing will not be
performed immediately. If the extract will be stored longer than two days, it should be
transferred to a Teflon-sealed screw-cap vial. If the sample extract requires no further
cleanup, proceed with HPLC analysis (Section 12). If the sample requires further
cleanup, proceed to Section 11.
10.12 Determine the original sample volume by refilling the sample bottle to the mark and
transferring the liquid to a 1000-mL graduated cylinder. Record the sample volume to
the nearest 5 mL.
11. Cleanup and Separation
11.1 Cleanup procedures may not be necessary for a relatively clean sample matrix. If
particular circumstances demand the use of a cleanup procedure, the analyst first must
demonstrate that the requirements of Section 8.2 can be met using the method as revised
to incorporate the cleanup procedure.
12. High Performance Liquid Chromatography
12.1 Table 1 summarizes the recommended operating conditions for the HPLC. Included in
this table are retention times, capacity factors, and MDL that can be achieved under these
conditions. An example of the separations achieved by this HPLC column is shown in
Figure 1. Other HPLC columns, chromatographic conditions, or detectors may be used
if the requirements of Section 8.2 are met. When the HPLC is idle, it is advisable to
maintain a 0.1 mL/min flow through the column to prolong column life.
12.2 Calibrate the system daily as described in Section 7.
12.3 If the internal standard calibration procedure is being used, the internal standard must
be added to the sample extract and mixed thoroughly immediately before injection into
the instrument.
12.4 Inject 5-25 µL of the sample extract or standard into the HPLC. If constant volume
injection loops are not used, record the volume injected to the nearest 0.05 µL, and the
resulting peak size in area or peak height units.
12.5 Identify the parameters in the sample by comparing the retention times of the peaks in
the sample chromatogram with those of the peaks in standard chromatograms. The
width of the retention time window used to make identifications should be based upon
measurements of actual retention time variations of standards over the course of a day.
Three times the standard deviation of a retention time for a compound can be used to
calculate a suggested window size; however, the experience of the analyst should weigh
heavily in the interpretation of chromatograms.
12.6 If the response for a peak exceeds the working range of the system, dilute the extract
with mobile phase and reanalyze.
12.7 If the measurement of the peak response for benzidine is prevented by the presence of
interferences, reduce the electrode potential to +0.6 V and reanalyze. If the benzidine
peak is still obscured by interferences, further cleanup is required.
13. Calculations
13.1 Determine the concentration of individual compounds in the sample.
13.1.1 If the external standard calibration procedure is used, calculate the amount of
material injected from the peak response using the calibration curve or calibration
factor determined in Section 7.2.2. The concentration in the sample can be
calculated from Equation 2.
Equation 2
where:
A = Amount of material injected (ng).
V = Volume of extract injected (µL).
i
V = Volume of total extract (µL).
t
V = Volume of water extracted (mL).
s
13.1.2 If the internal standard calibration procedure is used, calculate the concentration
in the sample using the response factor (RF) determined in Section 7.3.2 and
Equation 3.
Equation 3
where:
A = Response for the parameter to be measured.
s
A = Response for the internal standard.
is
I = Amount of internal standard added to each extract (µg).
s
V = Volume of water extracted (L).
o
13.2 Report results in µg/L without correction for recovery data. All QC data obtained
should be reported with the sample results.
14. Method Performance
14.1 The method detection limit (MDL) is defined as the minimum concentration of a
substance that can be measured and reported with 99% confidence that the value is above
zero. The MDL concentrations listed in Table 1 were obtained using reagent water.
1 10
Similar results were achieved using representative wastewaters. The MDL actually
achieved in a given analysis will vary depending on instrument sensitivity and matrix
effects.
14.2 This method has been tested for linearity of spike recovery from reagent water and has
been demonstrated to be applicable over the concentration range from 7 x MDL to 3000
x MDL.
10
14.3 This method was tested by 17 laboratories using reagent water, drinking water, surface
water, and three industrial wastewaters spiked at six concentrations over the range 1.0-70
µg/L. Single operator precision, overall precision, and method accuracy were found to
11
be directly related to the concentration of the parameter and essentially independent of
the sample matrix. Linear equations to describe these relationships are presented in
Table 3.
References
1. 40 CFR Part 136, Appendix B.
2. “Determination of Benzidines in Industrial and Municipal Wastewaters,” EPA
600/4-82-022, National Technical Information Service, PB82-196320, Springfield, Virginia
22161, April 1982.
3. ASTM Annual Book of Standards, Part 31, D3694-78. “Standard Practices for Preparation
of Sample Containers and for Preservation of Organic Constituents,” American Society
for Testing and Materials, Philadelphia.
4. “Carcinogens-Working With Carcinogens,” Department of Health, Education, and
Welfare, Public Health Service, Center for Disease Control, National Institute for
Occupational Safety and Health, Publication No. 77-206, August 1977.
5. “OSHA Safety and Health Standards, General Industry,” (29 CFR part 1910),
Occupational Safety and Health Administration, OSHA 2206 (Revised, January 1976).
6. “Safety in Academic Chemistry Laboratories,” American Chemical Society Publication,
Committee on Chemical Safety, 3rd Edition, 1979.
7. Provost, L.P. and Elder, R.S. “Interpretation of Percent Recovery Data,” American
Laboratory, 15, 58-63 (1983). (The value 2.44 used in the equation in Section 8.3.3 is two
times the value 1.22 derived in this report.)
8. ASTM Annual Book of Standards, Part 31, D3370-76. “Standard Practices for Sampling
Water,” American Society for Testing and Materials, Philadelphia.
9. “Methods 330.4 (Titrimetric, DPD-FAS) and 330.5 (Spectrophotometric, DPD) for Chlorine
Total Residual,” Methods for Chemical Analysis of Water and Wastes, EPA-600/4-79-020,
U.S. Environmental Protection Agency, Environmental Monitoring and Support
Laboratory, Cincinnati, Ohio 45268, March 1979.
10. “EPA Method Study 15, Method 605 (Benzidines),” EPA 600/4-84-062, National Technical
Information Service, PB84-211176, Springfield, Virginia 22161, June 1984.
11. “EPA Method Validation Study 15, Method 605 (Benzidines),” Report for EPA Contract
68-03-2624 (In preparation).
Table 1—Chromatographic Conditions and Method Detection Limits
Parameter capacity detection
Retention
time (min)
Column Method
factor (k') limit (µg/L)
Benzidine 6.1 1.44 0.08
3,3'-Dichlorobenzidine 12.1 3.84 0.13
HPLC Column conditions: Lichrosorb RP - 2, 5 micron particle size, in a 25 cm x 4.6 mm ID
stainless steel column. Mobile Phase: 0.8 mL/min of 50% acetonitrile/50% 0.1M pH 4.7
acetate buffer. The MDL were determined using an electrochemical detector operated at
+0.8 V.
Table 2—QC Acceptance Criteria—Method 605
Parameter Limit for s Range for
Test Range for
conc. P, P
(µg/L) (%)
(µg/L) (µg/L)
s
Benzidine 50 18.7 9.1 - 61.0 D - 140
3.3'-Dichlorobenzidine 50 23.6 18.7 - 50.0 5 - 128
s = Standard deviation of four recovery measurements, in µg/L (Section 8.2.4).
= Average recovery for four recovery measurements, in µg/L (Section 8.2.4).
P, P = Percent recovery measured (Section 8.3.2, Section 8.4.2).
s
D = Detected; result must be greater than zero.
NOTE: These criteria are based directly upon the method performance data in Table
3. Where necessary, the limits for recovery have been broadened to assure
applicability of the limits to concentrations below those used to develop Table
3.
Table 3—Method Accuracy and Precision as Functions of Concentration—Method 605
Parameter recovery, precision, precision,
Accuracy, as Single analyst Overall
X'(µg/L) s ' (µg/L) S' (µg/L)
r
Benzidine 0.70C + 0.06 0.28 + 0.19 0.40 + 0.18
3,3'-Dichlorobenzidine 0.66C + 0.23 0.39 - 0.05 0.38 + 0.02
X' = Expected recovery for one or more measurements of a sample containing a
concentration of C, in µg/L.
s '= Expected single analyst standard deviation of measurements at an average
r
concentration found of , in µg/L.
S'= Expected interlaboratory standard deviation of measurements at an average
concentration found of , in µg/L.
C = True value for the concentration, in µg/L.
= Average recovery found for measurements of samples containing a concentration of
C, in µg/L.