12.01 Data Collection - Design of Data Collection part 1 v3.0
Bạn đang xem bản rút gọn của tài liệu. Xem và tải ngay bản đầy đủ của tài liệu tại đây (140.79 KB, 15 trang )
Theme: Design of data collection
0
General information
0.1
Module code
Theme – Design of data collection
0.2
Version history
Version
1.0
2.0
Date
25.01.2012
24.04.2012
3.0
19.05.2012
0.3
Description of changes
First version
Second version –
changes, added text and
additional references
according to review
Third version – with some
minor changes
Template version and print date
Template version used
1.0 p 3 d.d. 28-6-2011
Print date
22-10-2022 H:10
1
Author
Tora Löfgren
Tora Löfgren
Institute
Statistics Norway
Statistics Norway
Tora Löfgren
Statistics Norway
Contents
General section – Theme: Choosing the appropriate data collection method..................................3
1. Summary............................................................................................................................................3
2. Factors to consider when choosing data collection method.............................................................3
3. Different modes.................................................................................................................................4
4. How to mix modes...........................................................................................................................11
5. Glossary...........................................................................................................................................12
6. Literature..........................................................................................................................................13
Specific section – Theme: Choosing appropriate data collection method......................................15
A.1 Interconnections with other modules...........................................................................................15
2
General section – Theme: Choosing the appropriate data
collection method
1.
Summary
The chapter gives an overview of factors to consider when choosing data collection method. It also
gives a short presentation of different modes available, modes suitable for business surveys,
advantages and disadvantages with each mode and a brief description about how to mix modes.
Mixed-mode surveys are described more detailed in section X <link>.
2.
Factors to consider when choosing data collection method
There are several factors to consider when choosing data collection method and each method has its
pros and cons. A general idea is to choose the method that minimizes the total survey error (TSE)
given the budget constraints. Some factors affecting the choice of mode and data collection instrument
are response burden, desired data quality (e.g. in terms of nonresponse and measurement error),
available resources (budget and staff, but also IT-resources and technical conditions), topic of the
survey and the questionnaire content, sampling frame, properties of the target population (e.g. type of
industry) and timetable for the survey (e.g. Biemer et al., 1991; Groves et al., 2004).
For instance, response burden can be reduced by good questionnaire design, extracting files
automatically or by pre-printing information from previous reporting periods in the questionnaire.
Lower response burden may also be achieved by sample coordination and sample rotation. For long
surveys with complex calculations, an electronic self-administered questionnaire that guides the
respondent through the form with built-in helps and logic checks might be an appropriate alternative.
Some electronic questionnaires might also allow the reporting person to save data temporarily and
continue later on if figures have to be looked up in other systems or files. Regardless what method is
chosen, a contact strategy must also be defined when planning the data collection; how and when the
respondents will be contacted.
One major difference between household surveys and business surveys is that in business surveys
(most often) many employees cooperate in the reporting task, something that makes the response
situation more complex. We do not know much about how the tasks are divided or communicated
internally within the businesses, we can only suppose this complexity makes questionnaire design
even more important. Some employees might forward the whole questionnaire including instructions
to a colleague; while others might interpret the question themselves and just ask the colleague for a
figure (i.e. the colleague will never see or read neither the question nor the instructions). In some
businesses only a few persons are authorized to report, but this does not necessarily mean that the
authorized person has the knowledge to report. The questionnaire might be sent around to different
employees within the business who partially fill out and report the figures they have knowledge on. In
some businesses paper questionnaires are preferred, because “paper walks”. Other businesses find
electronic self-completion questionnaires easier to handle in the reporting situation. The differences in
3
preferences are often related to factors like for instance business size, organisation levels (hierarchy)
and type of industry.
Business surveys are also a bit special in the sense that business populations have distinct frame
problems. Often they vary quite much in size and they are highly dynamic. Small businesses are born
and die rapidly. Medium-sized or large businesses merge with others or split up into several units. The
business population also demonstrates a distinction between a legally defined entity and physical
location (Groves et al., 2004). These are also factors to consider when designing data collection and
choosing mode.
Another important step in planning the data collection is to consider how the final result, the statistics
should be presented. Which variables should be reported and how detailed should they be? How shall
we get hold of this information; shall the variables be collected from a register, shall they be collected
directly through a questionnaire or are the variables so complex that they have to be created by
compound calculations? These kinds of choices will not only affect the level of response burden in the
survey, but also the level of accuracy during the data collection which is also an important design
feature which should be reflected in the choice of mode. When designing the data collection
instrument, research problems have to be translated into questions in the questionnaire without
creating a mismatch opening up for specification- and measurement errors. One also has to ensure that
all topics are covered in the questionnaire, i.e. no variables are missing. The planning and design
process is a continuous process where improvements are made by iterations. Instrument design and
pre-testing questionnaires are dealt with more in detail in section X <link>.
Each survey has its own conditions, specific errors and how to treat them. In general, little is known
about the relationship between quality, time, costs and response burden and it is hard to implement
measures to reduce the burden without the expense of quality. Too few quantitative before-after studies
are at present documented and actions intended to reduce response burden should be monitored,
reviewed, documented and published better in order to gain more insight (Giesen, 2011).
3.
Different modes
The mode of data collection refers to what medium is used for contacting the sample members to get
their responses to the survey questions. There are three principal modes for data collection: face-toface surveys, telephone surveys and mail surveys. Face-to-face surveys and telephone surveys are
often referred to as interviewer-administered modes, whereas mail questionnaires are referred to selfadministered. The data collection can also be divided into direct and indirect data collection, referring
to the level of contact with the respondent. For instance, administrative records are an indirect form for
data collection with no contact with the respondent and a low data collector involvement; this in
contrast to many of the other modes which are methods for direct data collection. The table below
gives an overview over different modes, the level of data collection involvement from the data
collector and level of contact with the respondent.
4
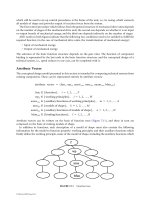
Table 3.1 Modes to choose from when planning the data collection.
High Data Collector Involvement
Low Data Collector Involvement
Paper
Computer
Paper
Computer
CAPI
Diary
CASI, ACASI
Indirect
contact with
Respondent Telephone (PAPI)
CATI
Mail,
No Contact
with
Respondent Direct observation
CADE
Administrative
records
Direct
Contact with Face-to-face
Respondent (PAPI)
fax,
e- TDE, e-mail, Web,
DBM, EMS, VRE
EDI
ACASI, audio CASI; CADE, computer-assisted data entry; CAPI, computer-assisted data interviewing; CASI,
computer-assisted self-interviewing, CATI, computer-assisted telephone interviewing; DBM, disc by mail; EDI,
electronic data interchange; EMS, electronic mail survey; PAPI, paper-and-pencil interviewing; T-ACASI,
telephone ACASI; TDE, touch-tone data entry; VRE, voice recognition entry. Source: Biemer & Lyberg (2003).
The modes have different advantages and disadvantages when it comes to costs, measurement errors,
nonresponse and coverage, flexibility and timeliness. Questionnaire complexity and the respondents’
possible reporting preferences are also important factors to consider, but it might be wise not to offer
too many modes at the same time, since too many systems to look after for the national statistical
institute (hereafter called NSI) will be costly in the long run and mixing modes might open up for
different error sources to combine and handle later on in the statistical process. Below follows a short
review of some of the modes presented in table 3.1. The review primarily focuses on the modes
relevant for business surveys, but as always there are exceptions and differences between countries
depending on domestic conditions.
3.1 Mail surveys
The mail survey is carried out by a paper questionnaire sent to the sample respondents by mail. The
data collector has no control over the response process or who is actually responding to the survey
(e.g. Biemer et al., 1991). The response process is as previously mentioned even more complex in
business surveys and sometimes it is a challenge just to find the right person within the business to
mail the questionnaire to.
Mail surveys are quite inexpensive to implement, which make them the preferred mode for low-budget
surveys. At the same time, mail surveys often require a long field period with at least one reminder to
achieve acceptable response rates (Biemer and Lyberg, 2003). The respondent deals with the survey on
its own and there is no interviewer present who can provide support or explain difficult questions.
Some NSIs have chosen to have a support centre or help desk for business surveys, which the business
representatives can call and ask for help when reporting. It is also common to include a telephone
number to the person who is responsible for the publication or statistical analysis in the questionnaire
or in the advance letter.
5
The potential problem with complicated questions can be eased by a well designed questionnaire that
motivates and guides the respondent through the questionnaire by good navigation, help texts and
visual support (e.g. Groves et al., 2004). Visual support and technical facilities can be made extra
efficient in electronic self-completion questionnaires (see next section 3.2).
The quality of the answers in a mail questionnaire is to a greater extent depending on the design than
in interviews. However, it has been shown that response order and question order is less important in a
mail survey, as the respondent can easily navigate back and forth in the questionnaire (Biemer et al.,
1991). There is also less risk of social desirable responses for sensitive issues in mail surveys than in
the interviewer-respondent situation (Biemer et al., 1991). For mail questionnaires there is a greater
risk of primacy effects, i.e. the respondent choose one of the first response categories when answering
the question (e.g. de Leeuw, Hox and Dillman, 2008). Open-ended questions, where the respondent
has to formulate the response on his/her own are less suitable for mail questionnaires. The respondents
have proven to give less and less thoughtful answers to such questions in mail surveys than in an
interview situation where the interviewer can help the respondent in formulating the answer by
probing. In business surveys open-ended questions might lead to a situation where the data collector
does not know what is included in the figures reported. Without the interviewer directly motivating the
respondent to participate, mail surveys typically have lower response rates than interviews and the risk
of item nonresponse is also bigger in mail surveys (Biemer and Lyberg, 2003). However, he
nonresponse rate is in general not the biggest problem in business surveys, since reporting most often
is mandatory and failure to report will lead to mulcts or fines.
3.2 Self-administered electronic questionnaires (Web)
The self-administered electronic questionnaire is often viewed upon as a more technical version of the
mail questionnaire. Logic checks and visual guidelines can be built in but advanced solutions cost
hours of programming and the potential risk of higher response burden.
Electronic questionnaires are perhaps the most common mode for business surveys today. Many NSIs
introduce electronic versions due to aims in cutting the costs for data collection and/or
data editing, with the intention to improve data quality, in order to offer safe
communication with businesses or in order to make it easier to respond and
thereby lower the response burden (Giesen, 2011 Chapter 5). Electronic
questionnaires might also be offered for specific surveys or specific groups of
surveys where reporting on the web has been found to suit the survey topic well,
or where different versions of the questionnaire are sent to different subgroups in
the population (e.g. small businesses).
Computerization allows lots of built-in features like customized wording, mouse-over-help, skips and
jumps, edit checks and randomized question order. These features or refinements can be said to replace
the role of an interviewer that helps the respondent through the survey. Visual elements like brightness,
color, shape and position can be used in order to guide the respondent through the questionnaire
(Groves et al, 2004). These features have shown to lead to less measurement error and less item nonresponse (ibid). The visual potential might also lower the response burden.
6
Some examples of electronic reporting in Europe: Statistics Norway introduced electronic
reporting for all business surveys due to an overnight decision as well as a part of
a new data collection strategy; the primary data collection mode is nowadays the
web (e.g. Haraldsen et al., 2011). Statistics Lithuania introduced electronic
questionnaires to create a favourable environment for the businesses in order to
prepare statistical data at lower costs (e.g. Lapeniene, 2008). At Statistics
Netherlands, more than half of the business surveys are available in electronic
forms (e.g. Beukenhorst and Giesen, 2010) and in the latest years, work has been
targeted on an electronic version the annual Structural Business Survey (e.g.
Snijkers et al., 2007). Further examples can be found in Raymond-Blaess (2011).
No matter the reason behind an electronic version of a self-completion
questionnaire, there is no clear evidence that electronic reporting does imply higher data
quality and decreased response burden, even if some measurements suggests something in that
direction (Snijkers et al., 2007: Giesen et al., 2009). Electronic data collection adds complexity to the
response process which is already complicated within a business, and the respondent has to interact
not only with the questions, but also with their internal records and the electronic instrument itself.
Initially, switching from paper to electronic questionnaire might actually increase the (perceived)
response burden and how well an electronic instrument will work in a business survey depends on
several factors, such as the organizational structure, the size of the business, what industry the business
operates in and the kind of products or services it sells (e.g. Goddeeris and Bruynooghe, 2011;
Gravem, Haraldsen and Löfgren, 2011). Not all survey topics are suitable for electronic reporting.
Sometimes a paper questionnaire is more convenient for the respondent because it is easier to handle
in the reporting situation. On the other hand, electronic questionnaires can be designed to offer the
same flexibility the respondent perceives it has with a paper questionnaire. An example of this are the
questionnaires in the AltInn-portal in Norway, where different informants can log-on and report on the
parts the can contribute with and subjects they have knowledge on. This kind of web-portal solution is
getting more and more common in Europe. The portal is not only a place to gather the surveys; it is
also a system for survey administration - both for the respondents and the NSI.
In the literature online surveys are often discussed as a completely different method from postal
surveys. In these cases one imagines the pure online survey with a sample drawn from e-mail
addresses and an invitation via e-mail or so-called self-selection surveys where the respondent answers
questions on a website. Such surveys are not very common at NSIs since it is difficult to keep an
updated register for all email addresses belonging to the population which might open up for frame
problems when sampling for the survey. NSIs most often send out information about the survey
accomplished with log-on information by mail.
3.3 Administrative records
If existing administrative records can be used, there is not only money to save but also response
burden since the respondents will not have to cope with another survey request. The error structure for
administrative data are similar to those of other modes, this because the administrative records are
produced on data collected somehow originally (Biemer and Lyberg, 2003). Administrative records
might consist of data collected by some other institution than the NSI, but might also be data already
7
collected by the NSI in a different survey. A good property with administrative records is that they
most often cover the whole population. On the other hand, the drawbacks with administrative records
is mainly that they may relate to a somewhat different population than the target population of the
survey, leading to calls for further measures to achieve coverage. The content of the records is not
always adapted to the wishes of statistics users and statisticians sometimes have no control over the
record or how the record is updated (Biemer and Lyberg, 2003). Definitions, boundaries and variable
content may differ from those desired, so the parameters cannot be estimated easily and the NSI
sometimes has to rely on model-based estimates. It is not unusual that the statistical purpose of a
record comes in second hand, after the administrative ones which often are of primary interest.
Different records have different data quality and this goes back to the main data collection or how the
record is updated. Conceptual problems are common, especially when it comes to business surveys
where there often is a mismatch between what data the businesses have and what data the NSIs ask for
(Giesen, 2011).
3.4 Electronic Data Interchange (EDI)
Electronic exchange of information is nowadays standard in the business world and many businesses
are moving towards a paperless environment. EDI offers businesses an electronic way to exchange
common standard information like order forms, shipping notes and other documents (Cox et al., 1995).
The possibility to submit data by removing a file from the system and send it to the NSI has many
advantages. The respondents extract the needed data in a pre-specified format from their computer
systems and transfer them to the NSI. Sophisticated EDI systems also offer direct on-line editing by
the respondent (Cox et al, 1995). There is a minimal effort for the respondent, except for the first time
when the base file has to be created, and response burden is therefore low. The quality of the data is
dependent on the file but if it is created and updated correctly the quality might be good. The EDI
technique may be used to collect large volumes of data and information from businesses.
3.5 Touch-tone Data Entry (TDE)
TDE is an alternative to mail collection and is a method where the respondent calls a computer linked
to an automatic answering machine and reports by pressing the touchtone phone buttons. Usually, the
answers are also read back for the respondent for verification (Biemer and Lyberg, 2003). TDE is only
a good option in very short surveys with few questions where the answers are related to numerical
information. There is, unfortunately, not many surveys that meet these requirements and there are also
some up-front costs associated with using TDE in a survey e.g. to program the hardware. The
possibilities for editing during the process are also limited under this mode (Cox et al., 1995).
3.6 Data provided by automatically extracted files (e.g. XBRL)
eXtensible Business Reporting Language (XBRL) is a technical standard for electronic
communication of business and financial data and is based on the XML and Link technical standards.
The idea of the XBRL language is to identify each concept (e.g. turnover) and add it into a
“taxonomy”, which works like a dictionary. Once defined, they can be re-used by other users. The
technique has potentials in reducing response burden (Allen and Junker, 2008) and offers flexibility to
the businesses. XBRL might be a good solution for businesses of large size and/or businesses that do
8
not report themselves, but use an external accountant that have to report on the same survey on a
regular basis (Goddeeris and Bruynooghe, 2011).
The relationship between computerization and quality is not straight forward. The main strength of
computers is not that they do things right, but that they do things consistently. This means that in
case of incorrect programming or linkage between the statistical need and the
source of information, the computer program will consistently produce errors as
a result.
The XBRL-technology also struggles with two kinds of updating problems. The
first is linked to when questions in the survey are changed and the second is
more related to changes in staff. When questions are changed, the software
company has to develop a new version and implement it at the customers,
which might be a diminishing problem as more and more software updates are
available on Internet. Still, this fact implies that automatic data capture will work
best in stable environments with fixed survey contents. The second problem is the
transfer of competence when people leave a workplace; ensuring the knowledge and experience to
link the administrative systems with the statistical ones will be transferred to someone else within the
company (e.g. Haraldsen et al., 2011).
Many NSIs are active in this field with different development projects; for instance Statistics
Finland developed an automated data capture procedure for hotel
accommodations in 2005 (Savolainen and Vertanen, 2007; Orjala 2010). Destatis in Germany
developed the eSTATISTIK.core in (2008) which uses the XML file format, and the statistical bureau
in Spain – Instituto Nacional de Estadistica – developed a XML based system for the hotel occupancy
survey 2008 (INE 2008). Another successful project that shows the potentials within this area is the
Simplified Business Information system (Portuguese acronym IES) developed in partnership with
different public entities, including Statistics Portugal. The system makes it possible to acquire
administrative and statistical information in a coordinated manner, conducted electronically on one
single occasion for the whole population of enterprises and at the same time this comply with legal
obligations and statistical as well. The IES system also represents an improvement on the quality
dimensions; coverage, coherence, punctuality, timeliness, comparability and reliability for business
statistics (Pereira, 2011).
3.7 Face-to-face Interviewing (PAPI) and CAPI
Face-to-face (PAPI) interview is the oldest mode of interview since it does not rely on modern
technology. The mode involves direct contact with the respondent and the data collector is highly
involved. When a computer is used instead of pen and pencil in the interview situation, the mode is
often referred to as CAPI.
PAPI and CAPI are not very common modes in business surveys; however they are used in some
countries that for instance lack a business register and/or have problems in locating or contacting the
businesses. There might also be some survey specific circumstances when the modes might be a good
9
choice; e.g. when the respondent clearly would benefit the support from an interviewer (e.g. help in
recalling events, amounts or frequencies of some phenomenon) or has no access to Internet.
PAPI and CAPI are by far the most expensive data collection methods especially when the respondents
are spread over large geographic areas; mainly because of travel and lodging expenses for interviewers
as well as interviewer training. In the case of CAPI the interviewer also has to be equipped with a
computer. The mode has traditionally been associated with high quality, mainly due to the
interviewer's presence and the positive effects from that.
This view has changed in recent decades due to the discovery of measurement error and the problems
face-to face interviewing potentially brings, especially for questions on sensitive topics (Biemer et al.,
1991). Personal contact is efficient when persuading respondents to participate, something often
mirrored in the high response rates for face-to-face interviewing compared to other modes. A face-toface interview may be longer and cove more complex issues than a telephone interview or a
questionnaire sent by mail. At the interview the interviewer can control the response situation; that the
respondent has understood the question and ensure that the response is not influenced by other
persons, or that it is the intended respondent who responds to the survey and not someone else. The
latter is for instance something out of the NSIs control when sending out a questionnaire by mail.
Another advantage with the face-to-face interview is that the interviewer can use visual aids in the
field work e.g. cards with response categories; something that would not be possible in a telephone
interview situation (Biemer et al., 1991). The presence of an interviewer can also have a negative
effect on the responses and the quality of the data collected; something which is also relevant in
business surveys. Interviewers affect respondents’ answers in a way similar to the clustering effect in
cluster sampling. The responses are affected through the individual interviewers’ behavior and
performance pattern during the interview. Different interviewers have different behavior patterns and
they ask the questions in their own style and pace and the question wording might not always be
exactly as in the questionnaire. The interviewer effect is strongest particularly in face-to-face
interviews and especially on sensitive issues where the interviewer's influence can lead to so called
social desirability bias (e.g. Biemer and Lyberg, 2003). Social desirability bias is probably more
common in household surveys, but can occur in business surveys too depending on industry covered
and topic of the survey. For instance, businesses within an industry known for air pollution might
report strategic or “brushed up” figures when it comes to environmental investments in cleaning
technology or environmental protection with the intention to make them look better in public.
3.8 Telephone interviewing (CATI)
Telephone interviewing is the fastest data collection mode to implement from start to completion of
data collection and is often used in combination with other modes in mixed-mode surveys (Biemer and
Lyberg, 2003). The mode is not so common in business surveys in the data collection phase, but rather
when it comes to call-backs, the editing phase when trying to fill out missing values or to reduce
nonresponse. However, the mode is still used in business surveys in some countries, e.g. in agricultural
surveys, and therefore it is included in this review.
10
By building common survey procedures directly into CATI systems, or into pre-packed setup modules,
surveys with similar designs can be conducted more efficiently, even by staff with limited survey
experience (Groves et al., 1988). The telephone interview shares some of the advantages and
disadvantages with the face-to-face mode concerning the interviewer presence. The interviewer effects
and risks of social desirability bias are however lower than in face-to-face interviews. A disadvantage
with telephone interviews is that it is less flexible. Visual aids can not be used, and neither the survey
topic nor the survey questions (or the response categories) can be too many or too complicated in a
telephone interview situation (e.g. Biemer et al., 1991). With too many response categories the
respondent might forget and systematically pick the last response category read; something called
recency effect (e.g. Biemer et al, 1991). The respondent might also interrupt the interviewer after the
first response category has been read and say “yes” to that one, not letting the interviewer finish the
job with reading the other response alternatives. This phenomenon is often referred to as top-of-thehead-responses. Top-of-the-head responses occur in all modes, but are perhaps more frequent in
telephone interviews (see Biemer and Lyberg, 2003). The influence on data caused by recency effects
and top-of-the-head-responses can be diminished by some programming if questions and response
categories are allowed to be randomized within the questionnaire. If the survey questions require some
extra effort from the respondent like a check-up in computer systems or calculations, both face-to-face
interviews and telephone interviews are less suitable modes. A growing problem in general with
telephone interviews is that parts of the population may be difficult to reach because they are not listed
in the telephone book (e.g. Biemer and Lyberg, 2003). This phenomenon is increasing as more and
more people use only their mobile telephones and do not have fixed land line (e.g. Lepkowski et al.,
2008). Naturally, finding the telephone number is not a huge problem in business surveys; the issue
lies more within finding the right person within the business.
3.9 Direct observation
Direct observation in the field means that data are collected without direct involvement of a particular
respondent; the observer assumes the role of the respondent (Biemer and Lyberg, 2003). The mode is
often used in biology and qualitative research (de Leeuw, Hox and Dillman, 2008) but can also be used
in data collections in business surveys for official statistics. An example of direct observation is when
the goal is to estimate the proportion of trucks in traffic on a ring-road around a city, where observers
register the number of trucks travelling at a random place during a randomly selected time period.
Measurement errors for this mode may be introduced by the recording of observations by the
observers in ways similar to the errors introduced by interviewers. The measurement errors may also
relate to the instrument or device used to gather information. Large scale data collections using direct
observation as mode are found in most agricultural surveys (Biemer et al., 1991).
4.
How to mix modes
With all these mode possibilities there is a good opportunity to combine the strong points of each
mode offering the respondent several modes for reporting. Such mode decision has to be planned
carefully because it implies a more complicated, more expensive, longer and probably more
challenging survey implementation. The usual goal is to find an optimal mix for data collection given
11
the research question and the population under study given the restrictions (Biemer and Lyberg, 2003).
The reason for mixing modes might be to collect follow-up panel data from the same respondent at a
later time, but also to collect data from same respondents during a single data collection period. Mixed
mode can be carried out to meet the respondents’ preferences, but usually the main reason for mixed
mode surveys is to battle the nonresponse. The general idea of mixed mode is to start with one main
mode and when all possibilities are emptied for that mode a switch to another often more expensive
mode is made, and so on. Allowing mixed modes or letting for instance businesses completely choose
and define the agenda how they want to report might not be the best approach in the long run.
Different modes have different ways of contacting the respondent which affects the answers,
something that might cause problems in comparative surveys if the instruments are not well designed.
It might also be costly to develop and maintain the data collection systems for each mode (e.g. de
Leeuw, Hox and Dillman, 2008). More about mixed modes and mode effects can be found in section
X <link>.
5.
Glossary
Term
Definition
Source of definition
(link)
Intervieweradministered
mode
An interviewer administers and guides the
respondent when answering the survey questions.
Mode effect
A pure mode effect is essentially a measurement
bias that is specifically attributable to the mode. In
some surveys the mode effects are small because
the same questionnaire can be used across all
modes. Most problems occur when mail is
combined with an interviewer-administered mode.
Mode of data
collection
Mode refers to what medium is used when
contacting the sample members to get their
responses.
Open-ended
questions
A question that let the respondents answer in their
own words.
Primacy effect
A given response alternative is more likely to be
chosen when presented at the beginning rather
than at the end of a list of response alternatives.
Probing
Asking additional questions with the purpose of
getting more and adequate information.
Recency effect
A given response alternative is more likely to be
chosen when presented at the end rather than at
the beginning of a list of response alternatives.
Selfadministered
mode
The questions in the survey are administered and
answered by the respondent without any
assistance or help from an interviewer.
Social
desirability
bias
Systematic underreporting of something to “fit in” in
what the respondent thinks is “normal” or accepted
in society. For instance, alcohol consumption is
often underreported to avoid embarrassment.
Top-of-thehead
responses
The respondent is feeling stressed and pressured
to give an quick answer and therefore picks the first
response category presented to them.
12
Synonyms
(optional)
primacy
recency
social
desirable
answers
6.
Literature
Allen, J. & Junker, C. (2008). How far can IT standards and tools help to reduce response burden?
Paper presented at the 94th DGINS conference, Vilnius, 25th-26th of September 2008.
Beukenhorst, D. & Giesen, D. (2010). Internet Use for Data Collection at Statistics Netherlands.
Paper presented at the 2nd International Workshop on Internet Survey Methods, Statistics
Korea, Daejeon, South Korea, September 8 & 9, 2010.
Biemer, P.P. et al. (1991): Measurement Error in Surveys, Wiley Series in Probability and
Mathematical Statistics, New York.
Biemer, P.P. and Lyberg, L.E. (2003): Introduction to Survey Quality, Wiley Series in Survey
Methodology, New Jersey.
Cox, B.G. et al. (1995): Business Survey Methods, Wiley Series in Probability and Mathematical
Statistics, New York.
e.Statistik.core (2008). Neue Wege zur Entlastung der Unternehmen, www.statistik-portal.de
Statistische Bundesamt, Wiesbaden 2008.
de Leeuw, E.D., Hox, J.J. and Dillman, D.A. (2008): International Handbook of Survey
Methodology., European Association of Methodology, Lawrence Erlbaum Associates, New
York.
Giesen, D., Editor (2011): Response Burden in Official Business Surveys: Measurement and
Reduction Practices of National Statistical Institutes. BLUE-Enterprise and Trade Statistics,
Small or medium-scale focused research project. />Giesen, D., Morren, M.& Snijkers, G. (2009). The effect of survey redesign on response burden:
and evaluation of the redesign of the SBS questionnaires. Draft paper presented at the 3rd
European Survey Research Association Conference 2009, Warsaw, June 29-July 3 2009.
Goddeeris, O.& Bruynooghe, K. (2011). Administrative Simplification of the Structural Business
Statistics. In D. Giesen& M. Bavdaž (Eds.), Proceedings of the BLUE-ETS Conference on
Burden and Motivation in Official Business Surveys (pp. 167-176). Heerlen: Statistics
Netherlands.
Gravem, D., Haraldsen, G. & Löfgren, T. (2011). Response Burden Trends and Consequences. In
D. Giesen& M. Bavdaž (Eds.), Proceedings of the BLUE-ETS Conference on Burden and
Motivation in Official Business Surveys (pp. 167-176). Heerlen: Statistics Netherlands.
Groves, R.M. et al. (2004): Survey Methodology, Wiley Series in Survey Methodology, New
Jersey.
13
Groves, R.M. et al. (1988): Telephone Survey Methodology. Wiley Series in Probability and
Mathematical Statistics, New York.
Haraldsen, G. et al. (2011). Utilizing Web Technology in Business Data Collection: Some
Norwegian, Dutch and Danish Experiences. Paper presented at the New Techniques and
Technologies for Statistics (NTTS) Conference, 22-24 February, Brussels, Belgium.
INE (2008). The response burden in business statistics - The Spanish experience. Paper presented
at the 94th DGINS conference, Vilnius, 25th-26th September 2008.
Lapeniene, V. (2008). Reduction of Data Collection Burden. Paper presented at the 17th Statistical
Days, Radenci (Slovenia), 5-7 November 2007.
Lepkowski, J.M. et al. (2008): Advances in Telephone Survey Methodology. Wiley Series in
Survey Methodology. New Jersey.
Orjala, H. (2010). Reducing the administrative burden in official statistics – Enterprise
respondents in focus. Paper presented at the SIMPLY 2010 conference, Ghent 2nd-3rd,
December 2010.
Pereira, H. J. (2011). Simplified Business Information (IES) – Is coordination between public
entities really possible? In D. Giesen & M. Bavdaž (Eds.), Proceedings of the BLUE-ETS
Conference on Burden and Motivation in Official Business Surveys (pp. 167-176). Heerlen:
Statistics Netherlands.
Raymond-Blaess, V. (2011). Overview of measures used by NSIs to reduce response burden as
reported in the literature between 2005 and 2010. In D. Giesen & V. Raymond-Blaess
(Eds.), Response burden measurement and reduction in official business statistics. A
literature review of national statistical insitutes’ practices and experiences (pp. 27-42).
Deliverable 2.1, BLUE-ETS project.
Savolainen, A.& Vertanen, V. (2007). Statistics Finland’s measures to reduce enterprises’ response
burden. Paper Presented at the Seminar, NordStat 2007, Reykjavik, June 2007.
Snijkers, G., Onat, E.& Vis-Visschers, R. (2007). The Annual Structural Business Survey:
Developing and Testing an Electronic Form. Proceedings of the Third International
Conference on Establishment Surveys (pp.456-463). Alexandria, VA: American Statistical
Association.
14
Specific section – Theme: Choosing appropriate data collection
method
A.1
•
Interconnections with other modules
Related themes described in other modules
1. Mixed-mode surveys and mode effects
2. Instrument design and pre-testing questionnaires.
•
Methods explicitly referred to in this module
•
Process steps explicitly referred to in this module
15