Game strategies in network security potx
Bạn đang xem bản rút gọn của tài liệu. Xem và tải ngay bản đầy đủ của tài liệu tại đây (727.23 KB, 16 trang )
Int J Inf Secur (2005) / Digital Object Identifier (DOI) 10.1007/s10207-004-0060-x
Game strategies in network security
Kong-wei Lye
1
, Jeannette M. Wing
2
1
Department of Electrical and Computer Engineering
e-mail:
2
Computer Science Department, Carnegie Mellon Universit y, 5000 Forbes Avenue, Pittsburgh, PA 15213-3890, USA
e-mail:
Published online: 3 February 2005 – Springer-Ve rlag 2005
Abstract. This paper presents a game-theoretic method
for analyzing the security of computer networks. We view
the interactions between an attacker and the administra-
tor as a two-player stochastic game and construct a model
for the game. Using a nonlinear program, we compute
Nash equilibria or best-response strategies for the play-
ers (attacker and administrator). We then explain why
the strategies are realistic and how administrators can use
these results to enhance the security of their network.
Keywords: Stochastic games – Nonlinear programming
– Network security
1 Introduction
Government agencies, banks, retailers, schools, and
a growing number of goods and service providers today
all use the Internet as an integral way of conducting their
daily business. Individuals, good or bad, can also easily
connect to the Internet. Due to the ubiquity of the Inter-
net, computer security has now become more important
than ever to organizations such as governments, banks,
businesses, and universities. Security specialists have long
been interested in knowing what an intruder can do to
a computer network and what can be done to prevent or
counteract attacks. In this paper, we describe how game
theory can be used to find strategies for both an attacker
and the administrator. We consider the interactions be-
tween them as a general-sum stochastic game.
1.1 Example case study
To create an example for our case study, we interviewed
one of our university network managers and put together
the basis for several attack scenarios. We identified the
types of attack actions involved, estimated the likeli-
hood of an attacker taking certain actions, determined
the types of states the network can enter, and estimated
the costs or rewards of attack and defense actions. In all,
we had three interviews with the network manager, with
each interview taking 1 to 2 h.
Based on our discussions with the network manager,
we constructed an example network so as to illustrate our
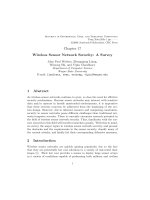
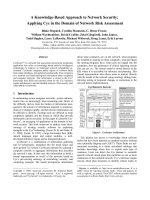
approach. Figure 1 depicts a local network connected to
the Internet.
A router routes Internet traffic to and from the local
network and a firewall prevents unwanted connections.
The network has two zones or subnetworks, one contain-
ing the public Web server and the other containing the
private file server and private workstation. This can be
achieved by using a firewall with two or more interfaces.
Such a configuration allows the firewall to check traffic be-
tween the two zones and providesomeformofprotection
for the file server and workstation against malicious In-
ternet traffic. The Web server runs an HTTP server and
an FTP server for serving Web pages and data. It is acces-
sible by the public through the Internet. The root user in
the Web server can access the file server and workstation
to retrieve updates for Web data. For remote adminis-
tration, the root users on the file server and workstation
can also access the Web server. For our illustration pur-
poses, we assume that the firewall rules are lax and the
operating systems are insufficiently hardened.Itisthus
possible for an attacker to succeed in several different at-
tacks. This setup would be the gameboard for the attacker
and the administrator.
1.2 Roadmap to rest of paper
In Sect. 2, we introduce the formal model for stochas-
tic games and relate the elements of this model to those
Kong-wei Lye, Jeannette M. Wing: Game strategies in network security
Fig. 1. A network example
in our network example. In Sect. 3, we explain the con-
cept of a Nash equilibrium for stochastic games and ex-
plain what it means to the attacker and administrator.
Then, in Sect. 4, we describe three possible attack sce-
narios for our network example. In these scenarios, an
attacker on the Internet attempts to deface the homepage
on the public Web server on the network, launch an in-
ternal denial-of-service (DOS) attack, and capture some
important data from a workstation on the network. We
compute Nash equilibria (best responses) for the attacker
and administrator using a nonlinear program and explain
in detail one of the three solutions found for our example
in Sect. 5. We discuss the strengths and limitations of our
approach in Sect. 6 and compare our work with previous
work in Sect. 7. Finally, we summarize our results and
point to future directions in Sect. 8.
2 Networksasstochasticgames
Game theory has been used in many other problems in-
volving attackers and defenders. The network security
problem is similar because a hacker on the Internet may
wish to attack a network and the administrator of the net-
work has to defend against the attack actions. Attack and
defense actions cause the network to change in state, per-
haps probabilistically. The attacker can gain rewards such
as thrills for self-satisfaction or transfers of large sums
of money into his bank account; meanwhile, the admin-
istrator can suffer damages such as system downtime or
theft of secret data. The attacker’s gains, however, may
not be of the same magnitude as the administrator’s cost.
A general-sum stochastic game model is ideal for captur-
ing the properties of these interactions.
In real life, there can be more than one attacker at-
tacking a network and more than one administrator man-
aging the network at the same time. Thus, it would ap-
pear that a multiplayer game model is more apt than
a two-player game. However, the game makes no distinc-
tion as to which attacker (or administrator) takes which
action. We can model a team of attackers at different
locations as the same as an omnipresent attacker, and
similarly for the defenders. It is thus sufficient to use
a two-player game model for the analysis of this network
security problem.
2.1 Stochastic game model
We first introduce the formal model of a stochastic game.
We then apply this model to our network attack example
and explain how to define or derive the state set, action
sets, transition probabilities, and cost/reward functions.
Formally, a two-player stochastic game is a tuple
(S, A
1
,A
2
,Q,R
1
,R
2
,β)where
– S = { ξ
1
, ···,ξ
N
} is the state set.
– A
k
= {α
k
1
, ···,α
k
M
k
} k =1, 2, M
k
= |A
k
|, is the action
set of player k. The action set for player k at state s is
a subset of A
k
, i.e., A
k
s
⊆ A
k
and
N
i=1
A
k
ξ
i
= A
k
.
– Q : S × A
1
× A
2
× S → [0, 1] is the state transition
function.
– R
k
: S × A
1
× A
2
→ R, k =1, 2 is the reward function
1
of player k.
–0<β≤ 1isadiscount factor for discounting future
rewards, i.e., at the current state, a state transition
has a reward worth its full value, but the reward for
the transition from the next state is worth β times its
value at the current state.
The game is played as follows. At a discrete time in-
stant t, the game is in state s
t
∈ S.Player1choosesan
action a
1
t
from A
1
andplayer2choosesanactiona
2
t
from
A
2
. Player 1 then receives a reward r
1
t
= R
1
(s
t
,a
1
t
,a
2
t
)
and player 2 receives a reward r
2
t
= R
2
(s
t
,a
1
t
,a
2
t
). The
game then moves to a new state s
t+1
with conditional
probability Prob(s
t+1
|s
t
,a
1
t
,a
2
t
)equaltoQ(s
t
,a
1
t
,a
2
t
,
s
t+1
).
The discount factor, β, weighs the importance of fu-
ture rewards to a game player. A high discount factor
means the player is concerned about rewards far into the
future and a low discount factor means he is only con-
cerned about rewards in the immediate future. Looking
from the viewpoint of an attacker, the discount factor
determines how much damage he wants to create in the
future. A high discount factor characterizes an attacker
with a long-term objective who plans well and takes into
consideration what damage he can do not only at present
but far into the future, whereas a low discount factor
means an attacker has a short-term objective and is only
concerned about causing damage at the present time. For
convenience, we use the same discount factor for both
players.
There are finite-horizon and infinite-horizon games.
Finite-horizon games end when a terminal state is reached
whereas infinite-horizon games can continue forever,
transitioning from state to state. A reasonable criterion
for computing a strategy in an infinite-horizon game is to
maximize the long-rundiscountedreturn(β<1), which
is what we use in our example.
In our example, we let the attacker be player 1 and
the administrator be player 2. To aid readability, we sep-
arate the graphical representation of the game into two
1
We use the term “reward” in general here; in later sections,
positive values are rewards and negative values are costs.
Kong-wei Lye, Jeannette M. Wing: Game strategies in network security
views: the attacker’s view (Fig. 3) and the administra-
tor’s view (Fig. 4). We describe these figures in detail later
in Sect. 4.
2.2 Network state
In general, the state of the network contains various kinds
of features such as hardware types, software services,
node connectivity, and user privileges. The more features
of the state we model, the more accurately we represent
the network, but also the more complex and difficult the
analysis becomes.
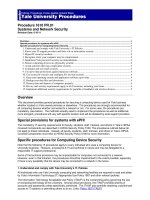
We view the network as a graph (Fig. 2). A node in
the graph is a physical entity such as a workstation or
router. We model the external world as a single com-
puter (node E ) and represent the Web server, file server,
and workstation by nodes W, F ,andN, respectively. An
edge in the graph represents a direct communication path
(physical or virtual). For example, the external computer
(node E) has direct access to only the public Web server
(node W ); this abstraction models the role of the fire-
wall in the real network example. Since the root users in
the Web server, file server, and workstation can access
one another’s machine, we have edges between node W
and node F, between node W and node N , and between
node F and node N .
Instantiating our game model, we let a superstate
<n
W
,n
F
,n
N
,t>∈ S be the state of the network. n
W
,
n
F
,andn
N
are the node states for the Web server, file
server, and workstation, respectively, and t is the traffic
state for the whole network. Each node X (where X ∈
{E,W,F, N}) has a node state n
X
=<P,a,d>to repre-
sent information about hardware and software configura-
tions. P ⊆{f,h,n,p, s, v} is a list of software applications
running on the node and f, h, n,andp denote ftpd, httpd,
nfsd, and some user process, respectively. For malicious
code, s and v represent sniffer programs and viruses, re-
spectively. The variable a ∈{u, c} represents the state
of the user accounts; u means no user account has been
compromised and c means at least one user account has
been compromised. We use the variable d ∈{c, i} to rep-
resent the state of the data on the node; c means the data
have been corrupted or stolen and i means the data are
in good integrity. For example, if n
W
=< (f,h, s),c,i>,
Fig. 2. Network state
then the Web server is running ftpd and httpd,asnif-
fer program has been implanted, and a user account has
been compromised but no data have yet been corrupted
or stolen.
The traffic state t =< {l
XY
} >,whereX, Y ∈
{E,W,F, N}, captures the traffic information for the
whole network. l
XY
∈{0,
1
3
,
2
3
, 1} and indicates the load
carried on the link between nodes X and Y .Avalueof1
indicates maximum capacity. For example, in a 10Base-T
connection, the values 0,
1
3
,
2
3
, and 1 represent 0 Mbps,
3.3 Mbps, 6.7 Mbps, and 10 Mbps, respectively. In our ex-
ample, the traffic state is t = <l
EW
,l
WF
,l
FN
,l
NW
>.
We let t = <
1
3
,
1
3
,
1
3
,
1
3
> for normal traffic conditions.
The potential state space for our network example is
very large, but we shall discuss how to handle this prob-
lem in Sect. 6. The full state space in our example has
asizeof|n
W
|×|n
F
|×|n
N
|×|t| =(63×2 × 2)
3
× 4
4
≈ 4
billion states, but there are only 18 states (15 shown
in Fig. 3 and 3 others in Fig. 4) relevant to our application
here. In these figures, each state is represented using a box
with a symbolic state name and the values of the state
variables. For convenience, we shall mostly refer to the
states using their symbolic state names, as summarized in
the appendix in Table 1.
2.3 Actions
An action pair (one from the attacker and one from the
administrator) causes the system to move from one state
to another in a probabilistic manner. A single action for
the attacker can be any part of his attack strategy, such
as flooding a server with SYN packets or downloading the
password file. When a player does nothing, we denote this
inaction as φ. The action set for the attacker A
Attacker
consists of all the actions he can take in all the states:
A
Attacker
= {Attack_httpd,
Attack_ftpd,
Continue_attacking,
Deface_website_leave,
Install_sniffer,
Run_DOS_virus,
Crack_file_server_root_password,
Crack_workstation_root_password,
Capture_data,
Shutdown_network,
φ},
where again φ denotes inaction. His actions in each state
is a subset of A
Attacker
. For example, in the state Nor-
mal_operation (see Fig. 3, topmost state), the attacker
hasanactionsetA
Attacker
Normal
_operation
= { Attack_httpd,
Attack_ftpd, φ}.
Actions for the administrator are mainly preventive or
restorative measures. In our example, the administrator
Kong-wei Lye, Jeannette M. Wing: Game strategies in network security
Fig. 3. Attacker’s view of the game
has an action set
A
Administrator
= {
Remove_ compromised_ account_restart_httpd,
Restore_website_ remove_ compromised_ account,
Remove_ virus_and_compromised_account,
Install_sniffer_detector,
Remove_ sniffer_detector,
Remove_ compromised_ account_restart_ftpd,
Remove_compromised_account_sniffer,
φ} .
For example, in state Ftpd_attacked (Fig. 4), the ad-
ministrator has an action set A
Adminstrator
Ftpd
_attacked
= {Install_
sniffer_detector, φ, φ}.
A node with a compromised account may or may not
be observable by the administrator. When it is not ob-
servable, we model the situation as the administrator
having an empty action set in the state. We assume that
the administrator does not know whether there is an at-
Kong-wei Lye, Jeannette M. Wing: Game strategies in network security
Fig. 4. Administrator’s view of the game
tacker or not. Also, the attacker may have several objec-
tives and strategies that the administrator does not know.
2.4 State transition probabilities
In our example, we assign state transition probabilities
based on the intuition and experience of our network
manager. In practice, case studies, statistics, simulations,
and knowledge engineering can provide the required
probabilities.
In Figs. 3 and 4, we use arrows to represent state
transitions. Each arrow is labeled with an action, a tran-
sition probability, and a cost/reward. In the formal game
model, a state transition probability is a function of
both players’ actions. Such probabilities are used in the
nonlinear program (Sect. 3) for computing a solution
to the game. However, in order to separate the game
into two views, we show the transitions as simply due
to a single player’s actions (assuming the other player
uses an arbitrary fixed strategy). For example, with the
second dashed arrow from the top in Fig. 3, we show
the probability Prob(Ftpd_hacked | Ftpd_attacked,
Continue_attacking ) = 0.5 as due to only the attacker’s
action Continue_attacking.
When the network is in state Normal_operation
and neither the attacker nor administrator takes any ac-
tion, it will tend to stay in the same state. We model this
situation as having a near-identity stochastic matrix, i.e.,
we let Prob(Normal_operation | Normal_operation,
φ, φ)=1− for some small <0.5. Then Prob(s|
Normal_operation, φ, φ)=
N−1
for all s = Normal_
operation,whereN is the number of states. The remain-
Kong-wei Lye, Jeannette M. Wing: Game strategies in network security
ing probability is assigned to transition to a “catchall”
state. There are also state transitions that are infeasi-
ble. For example, it may not be possible for the network
to move from a normal operation state to a completely
shutdown state without going through some intermediate
states. Infeasible state transitions are assigned transition
probabilities of 0.
2.5 Costs and rewards
There are costs (negative values) and rewards (positive
values) associated with the actions of the administrator
and attacker. The attacker’s actions have mostly rewards
and such rewards are in terms of the amount of damage he
does to the network. Some costs are difficult to quantify.
For example, the loss of marketing strategy information
to a competitor can cause large monetary losses. A de-
faced corporate Web site may cause the company to lose
its reputation and its customers to lose confidence.
In our model, we restrict ourselves to the amount
of recovery effort (time) required by the administrator.
The reward for an attacker’s action is mostly defined
in terms of the amount of effort the administrator has
to make to bring the network from one state to an-
other. For example, when a particular service crashes,
it may take the administrator 10 min or 1 h to deter-
mine the cause and restart the service.
2
In Fig. 4, it
costs the administrator 10 min to remove a compro-
mised user account and to restart httpd (from state
Httpd_hacked to state Normal_operation). For the
attacker, this amount of time would be his reward. To
reflect the severity of the loss of the important finan-
cial data in our network example, we assign a very high
reward for the attacker’s action that leads to the state
where he gains these data. For example, from state
Works tati o n_hacked to state Works tatio n_data_
stolen_1 in Fig. 3, the reward is 999. There are also some
transitions in which the cost to the administrator is not
the same magnitude as the reward to the attacker. It is
such transitions that make the game a general-sum game
instead of a zero-sum game.
3 Nash Equilibrium
We now return to the formal model for stochastic games.
Let Ω
n
= {p ∈ R
n
|
n
i=1
p
i
=1,p
i
≥ 0} be the set of
probability vectors of length n. π
k
: S → Ω
M
k
is a station-
ary strategy for player k. π
k
(s) is the vector [π
k
(s, α
1
)
π
k
(s, α
M
k
)]
T
,whereπ
k
(s, α) is the probability that
player k should use to take action α in state s.Astation-
ary strategy π
k
is a strategy that is independent of time
and history. A mixed or randomized stationary strategy
is one where π
k
(s, α) ≥ 0 ∀s ∈ S and ∀α ∈ A
k
, and a pure
strategy is one where π
k
(s, α
i
)=1forsomeα
i
∈ A
k
.
2
These numbers were given by our network manager.
The objective of each player is to maximize some ex-
pected return. Let s
t
be the state at time t and r
k
t
be
the reward received by player k at time t. We define
an expected return to be the column vector v
k
π
1
,π
2
=
[v
k
π
1
,π
2
(ξ
1
) v
k
π
1
,π
2
(ξ
N
)]
T
,where
v
k
π
1
,π
2
(s)=E
π
1
,π
2
{r
k
t
+ βr
k
t+1
+(β)
2
r
k
t+2
+
+(β)
H
r
k
t+H
| s
t
= s}
= E
π
1
,π
2
{
H
h=0
(β)
h
r
k
t+h
| s
t
= s} .
The expectation operator E
π
1
,π
2
{·} is used to mean
that player k plays π
k
, i.e., player k chooses an action
using the probability distribution π
k
(s
t+h
)ats
t+h
and
receives an immediate reward r
k
t+h
= π
1
(s
t+h
)
T
R
k
(s
t+h
)
π
2
(s
t+h
)forh ≥ 0. R
k
(s)=[R
k
(s, a
1
,a
2
)]
a
1
∈A
1
,a
2
∈A
2
,for
k =1, 2, is player k’s reward matrix in state s.(Weuse
[m(i, j)]
i∈I,j∈J
to refer to an |I|×|J| matrix with elem-
ents m(i, j).)
For an infinite-horizon game, we let H = ∞ and
use a discount factor β<1 to discount future rewards.
v
k
(s) is then the expected total discounted rewards that
player k will receive when starting at state s. For a finite-
horizon game, 0 <H<∞ and β ≤ 1. v
k
is also called the
value vector of player k.
A Nash equilibrium in stationary strategies (π
1
∗
,π
2
∗
)is
one that satisfies (componentwise)
v
1
(π
1
∗
,π
2
∗
) ≥ v
1
(π
1
,π
2
∗
), ∀π
1
∈ Ω
M
1
and
v
2
(π
1
∗
,π
2
∗
) ≥ v
2
(π
1
∗
,π
2
), ∀π
2
∈ Ω
M
2
.
Here, v
k
(π
1
,π
2
) is the value vector of the game for
player k when both players play their stationary strate-
gies π
1
and π
2
, respectively, and ≥ is used to mean the
left-hand-side vector is componentwise greater than or
equal to the right-hand-side vector. At this equilibrium,
there is no mutual incentive for either one of the players
to deviate from their equilibrium strategies π
1
∗
and π
2
∗
.
A deviation will mean that one or both of them will have
lower expected returns, i.e., v
1
(π
1
,π
2
)and/or v
2
(π
1
,π
2
).
A pair of Nash equilibrium strategies is also known as
best responses, i.e., if player 1 plays π
1
∗
, player 2’s best
response is π
2
∗
and vice versa.
For infinite-horizon stochastic games, we use a non-
linear program by Filar and Vrieze [7], which we call
NLP-1, to find the stationary equilibrium strategies for
both players. For finite-horizon games, a dynamic pro-
gramming procedure found in the book by Fudenberg
and Tirole [8] can be used. For a thorough treatment on
stochastic games, the reader is referred to the work by Fi-
lar and Vrieze [7].
The following nonlinear program is used to find a Nash
equilibrium for a general-sum stochastic game:
min
u
1
,u
2
,σ
1
,σ
2
1
T
[u
k
− R
k
(σ
1
,σ
2
) − βP(σ
1
,σ
2
)u
k
] ,
k =1, 2(NLP-1)
Kong-wei Lye, Jeannette M. Wing: Game strategies in network security
subject to:
R
1
(ξ
i
)σ
2
(ξ
i
)+βT(ξ
i
,u
1
)σ
2
(ξ
i
) ≤ u
1
(ξ
i
)1 ,
i =1, ,N
σ
1
(ξ
i
)
T
R
2
(ξ
i
)+βσ
1
(ξ
i
)
T
T (ξ
i
,u
2
) ≤ u
2
(ξ
i
)1
T
,
i =1, ···,N,
where u
k
∈ R
N
are variables for value vectors, σ
k
∈ Ω
M
k
are variables for strategies, and 1 is a unit vector of appro-
priate dimensions.
R
k
(σ
1
,σ
2
) is the vector [σ
1
(ξ
1
)
T
R
k
(ξ
1
)σ
2
(ξ
1
)
σ
1
(ξ
N
)
T
R
k
(ξ
N
)σ
2
(ξ
N
)]
T
. It contains the rewards for each
state when the players play σ
1
and σ
2
.
P (σ
1
,σ
2
) is a state transition probability matrix
[σ
1
(s)
T
[p(s
| s, a
1
,a
2
)]
a
1
∈A
1
,a
2
∈A
2
σ
2
(s)]
s,s
∈S
.Itisthe
stochastic matrix for a Markov chain induced by the
strategy pair (σ
1
,σ
2
). When a player fixes his strategy,
a Markov Decision Problem (MDP) is induced for the
other player.
T (s, u)isthematrix[[p(ξ
1
| s, a
1
,a
2
) p(ξ
N
| s, a
1
,
a
2
)]
T
u
T
]
a
1
∈A
1
,a
2
∈A
2
,whereu is an arbitrary value vec-
tor. T (s, u) represents future rewards from the next state
onwards in a game matrix form.
The two sets of constraints (2 × N inequalities) rep-
resent the optimality conditions required for the players
and the global minimum to this nonlinear program. A so-
lution (u
1
∗
,u
2
∗
,σ
1
∗
,σ
2
∗
) to NLP-1 that minimizes its objec-
tive function to 0 is a Nash solution (v
1
∗
,v
2
∗
,π
1
∗
,π
2
∗
)ofthe
game.
In our network example, π
1
and π
2
corresponds to the
attacker’s and administrator’s strategies, respectively.
v
1
(π
1
,π
2
) corresponds to the expected return for the
attacker, and v
2
(π
1
,π
2
) corresponds to the expected re-
turn for the administrator when they use strategies π
1
and π
2
. In a Nash equilibrium, when the attacker and ad-
ministrator use their best-response strategies, π
1
∗
and π
2
∗
,
respectively, neither will gain a higher expected return if
the other continues using his Nash strategy.
Every general-sum discounted stochastic game has at
least one (not necessarily unique) Nash equilibrium in
stationary strategies (see [7]), and finding these equilib-
ria is nontrivial. In our network example, finding multi-
ple Nash equilibria means finding multiple pairs of Nash
strategies. In each pair, a strategy for one player is a best
response to the strategy for the other player and vice
versa. We shall use NLP-1 to find Nash equilibria for our
network example later in Sect. 5.
4 Attack and response scenarios
In this section, we describe three different attack and re-
sponse scenarios. We show in Fig. 3 how the attacker sees
the state of the network change as a result of his actions.
Figure 4 depicts the administrator’s viewpoint. These fig-
ures represent the MDPs faced by the players, i.e., Fig. 3
assumes the administrator has fixed an arbitrary strat-
egy and Fig. 4 assumes the attacker has fixed an arbitrary
strategy. In both figures, we represent a state as a box
containing the symbolic name and the values of the state
variables for that state. We label each transition with
an action, the probability of the transition, and the gain
or cost in minutes of restorative effort incurred by the
administrator (detailed state transition probabilities and
costs/rewards are in the appendix). In Fig. 3 we use bold,
dotted, and dashed arrows to denote the three different
scenarios. For better readability, we do not draw all state
transitions for every action. From one state to the next,
state variable changes are highlighted using boldface.
4.1 Scenario 1: Deface Web site (bold)
A common target for use as a launching base in an attack
is the public Web server. The Web server typically runs
httpd and ftpd, and a common technique for the attacker
to gain a root shell is buffer overflow. Once the attacker
gets a root shell, he can deface the Web site and leave.
We illustrate this scenario with state transitions drawn as
bold arrows in Fig. 3.
From state Normal_operation, the attacker takes
action Attack_httpd. With a probability of 1.0 and a re-
ward of 10, he moves the system to state Httpd_at-
tacked. This state indicates increased traffic between
the external computer and the Web server as a result
of his attack action. Taking action Continue_attacking,
he has a 0.5 probability of success of gaining a user or
root access through bringing down httpd,andthesys-
tem moves to state Httpd_hacked. Once he has root
access in the Web server, he can deface the Web site,
restart httpd, and leave, moving the network to state
Web sit e_defaced.
4.2 Scenario 2: DOS (dotted)
The other thing that the attacker can do after he has
hacked into the Web server is to launch a denial-of-service
(DOS) attack from inside the network. We illustrate this
scenario with state transitions drawn as dotted arrows
in Fig. 3.
From state We bs erver_sniffer (where the attacker
has planted a sniffer and backdoor program), the at-
tacker may decide to launch a DOS atack and take ac-
tion Run_DOS_virus. With probability 1 and a reward of
30, the network moves into state Webser ver_DOS_1.
In this state, the traffic load on all internal links has
increased from
1
3
to
2
3
. From this state, the network
degrades to state Web server_DOS_2 with probabil-
ity 0.8, even when the attacker does nothing. The traffic
load is now at full capacity of 1 in all the links. We assume
that there is a 0.2 probability that the administrator will
notice this degradation and take action to recover the sys-
tem. In the very last state, the network grinds to a halt
and nothing productive can take place.
Kong-wei Lye, Jeannette M. Wing: Game strategies in network security
4.3 Scenario 3: Stealing confidential data (dashed)
Once the attacker has hacked into the Web server, he
can install a sniffer and a backdoor program. The snif-
fer will sniff out passwords from the users in the work-
station when they access the file server or Web server.
Using the backdoor program, the attacker then comes
back to collect his password list from the sniffer pro-
gram, cracks the root password, logs on to the worksta-
tion, and searches the local hard disk. We illustrate this
scenario with state transitions drawn by dashed arrows
in Fig. 3.
From state Normal_operation, the attacker takes
action Attack_ftpd. With a probability of 1.0 and a re-
ward of 10, he uses the buffer overflow or a similar at-
tack technique and moves the system to state Ftpd_
attacked. There is increased traffic between the exter-
nal computer and the Web server as well as between the
Web server and the file server in this state, both loads
going from
1
3
to
2
3
. If he continues to attack ftpd,hehas
a 0.5 probability of success of gaining a user or root ac-
cess through bringing down ftpd, and the system moves
to state Ftpd_hacked.Fromherehecaninstallasnif-
fer program and, with probability 0.5 and a reward of
10, move the system to state Webse rver_sniffer.Inthis
state, he has also restarted ftpd to avoid causing suspicion
from normal users and the administrator. The attacker
then collects the password listandcrackstherootpass-
word on the workstation. We assume he has a 0.9 chance
of success, and when he succeeds, he gains a reward of 50
and moves the network to state Work stati on_hacked.
To cause more damage to the network, he can even shut it
down using the privileges of root user on this workstation.
4.4 Recovery
We now turn our attention to the administrator’s view
(Fig. 4). The administrator in our example does mainly
restorative work with actions such as restarting ftpd or re-
moving a virus. He also takes preventive measures with
actions such as installing a sniffer detector, reconfiguring
a firewall, or deactivating a user account.
In the first attack scenario in which the attacker de-
faces the Web site, the administrator can only take the
action Restore_website_remove_compromised_ account to
bring the network from state Websi te_defaced to Nor-
mal_operation. In the second attack scenario, the
states We bse rve r_DOS_ 1 and Webs erver_DOS_2
(indicated by double boxes) show the network suffer-
ing from the effects of the internal DOS attack. All
the administrator can do is take the action Remove_
virus_and_compromised_account to bring the network
back to Normal_operation. In the third attack sce-
nario, there is nothing he can do to restore the net-
work back to its original operating state. Important
data have been stolen, and no action allows him to
undo this situation. The attacker has brought the sys-
tem to state Workst at ion _data_stolen_1 (Fig. 3),
and the network can only move from this state to
Works tati o n_data_ stolen_2 (indicated by the dotted
box on the bottom right in Fig. 4).
The state Ftpd_attacked (dashed box) is interesting
because here the attacker and administrator can engage
in real-time game play. In this state, when the administra-
tor notices an unusual increase in traffic between the ex-
ternal network and the Web server and also between the
Web server and the file server, he may suspect an attack
is going on and take action Install_sniffer_detector.Tak-
ing this action, however, incurs a cost of 10. If the attacker
is still attacking, the system moves into state Ftpd_
attacked_ detector. If he has already hacked into the
Web server, then the system moves to state Webs erver_
sniffer_detector. Detecting the sniffer program, the ad-
ministrator can now remove the affected user account and
the sniffer program to prevent the attacker from taking
further damaging actions.
5 Nash equilibria results
We implemented NLP-1 (the nonlinear program men-
tioned in Sect. 3) in MATLAB, a mathematical computa-
tion software package by The MathWorks, Inc. (Natick,
MA, USA). To run NLP-1, we require a complete model
of the game defined in Sect. 2. The appendix contains the
action sets for the attacker (Table 2) and administrator
(Table 3), the state transition probabilities (Table 4), and
the cost/reward function (Table 5). We now explain the
experimental setup for our example.
In the formal game model, the state of the game
evolves only at discrete time instants. In our example,
we imagine that the players take actions only at discrete
time instants. The game model also requires actions to
be taken simultaneously by both players. There are some
states in which a player has only one or two nontrivial ac-
tions, and for consistency and easier computation using
NLP-1, we add the inaction φ to the action set for such
a state so that the action sets are all of the same cardinal-
ity. Overall, our game model has 18 states and 3 actions
per state.
We ran NLP-1 on a computer equipped with
a 600-MHz Pentium III and 128 MB of RAM. The result
of one run of NLP-1 is a Nash equilibrium. It consists
of a pair of strategies (π
Attacker
∗
and π
Administrator
∗
)and
a pair of value vectors (v
Attacker
∗
and v
Administrator
∗
)for
the attacker and administrator. The strategy for a player
consists of a probability distribution over the action set
for each state, and the value vector consists of a state
value for each state.
We ran NLP-1 on 12 different sets of initial condi-
tions, finding three different Nash equilibria shown in
Tables 6–8 (all tables are in the appendix). We cannot
know exactly how many unique equilibria there are in this
example since running NLP-1 with more sets of initial
Kong-wei Lye, Jeannette M. Wing: Game strategies in network security
conditions could possibly find us more. Depending on how
close the initial conditions are to the solution, NLP-1 can
take from 30 to 45 min to find a solution. Of the three
equilibria we found, we shall discuss in detail the first one
(Table 6) and briefly the other two (Tables 7 and 8 in the
appendix).
Table 6 shows the first Nash equilibrium. The first
column lists the row numbers and the second column
gives the names of the states. For example, row 1 cor-
responds to state Normal_operation. The third and
fourth columns contain the Nash strategies π
Attacker
∗
and
π
Administrator
∗
for the attacker and administrator, respec-
tively. A vector in each of these columns is the probability
distribution over the action set for the state in the cor-
responding row. For example, in the first row (state Nor-
mal_operation) and third column (attacker’s strategy),
the vector [1.00 0.00 0.00] says that in the state Nor-
mal_operation, the attacker should take the first action
Attack_httpd with probability 1.00, the second action Att-
ack_ftpd with probability 0.00, and the third action φ
(inactions are always placed last) with probability 0.0.
(Actions are ordered in which they are listed in Tables 2
and 3.) The last two columns contain the value vectors
v
Attacker
∗
and v
Administrator
∗
for the attacker and admin-
istrator, respectively. In the first row and sixth column,
the value −206.8 means that the administrator will in-
cur a cost of 206.8 min of recovery time when starting the
game in the state Normal_operation and when both at-
tacker and administrator play their Nash strategies.
We explain the strategies for some of the more in-
teresting states here. For example, in the state Httpd_
hacked (row 5 in Table 6), the attacker has action set
{ Deface_website_leave, Install_sniffer, φ }.Hisstrategy
for this state says that he should use Deface_ website_-
leave with probability 0.33 and Install_sniffer with prob-
ability 0.10. Ignoring the third action φ, and after normal-
izing, these probabilities become 0.77 and 0.23, respec-
tively, for Deface_ website_leave and Install_sniffer.Even
though installing a sniffer may allow him to crack a root
password and eventually capture the data he wants, there
is also the possibility that the system administrator will
detect his presence and take preventive measures. He is
thus able to do more damage (probabilistically speak-
ing) if he simply defaces the Web site and leaves. In
this same state, the administrator can take either ac-
tion Remove_compromised_account_restart_httpd or ac-
tion Install_sniffer_detector. His strategy says that he
should take the former with probability 0.67 and the lat-
ter with probability 0.19. Ignoring the third action φ and
after normalizing, these probabilities become 0.78 and
0.22, respectively. This tells him that he should immedi-
ately remove the compromised account and restart httpd
rather than continue to “play” with the attacker. It is not
shown here in our model, but installing the sniffer detec-
tor could be a step towards apprehending the attacker,
which means greater reward for the administrator. In the
state Webse rver_sniffer (row 8 in Table 6), the attacker
should take actions Crack_file_server_root_ password and
Crack_workstation_root_password with equal probabil-
ity (0.5) because either action will let him do the same
amount of damage eventually. He should not take action
Run_DOS_virus (probability 0.0) in this state. Finally,
in the state Webs erver_ DOS_1 (row 10 in Table 6), the
system administrator should remove the DOS virus and
compromised account, this being his only action in this
state (the other two being φ).
In Table 6, we note that the value vector for the ad-
ministrator is not exactly the negative of that for the
attacker. That is, in our example, not all state transitions
have costs whose corresponding rewards are of the same
magnitude. In a zero-sum game, the value vector for one
player is the negative of the other’s. In this table, the
negative state values for the administrator correspond to
his expected costs or expected amount of recovery time
(in minutes) required to bring the network back to normal
operation. Positive state values for the attacker corres-
pond to his expected reward or the expected amount of
damage he causes the administrator (again, in minutes
of recovery time). Both the attacker and administrator
would want to maximize the state values for all the states.
In state Fileserver_hacked (row 13 in Table 6), the
attacker has gained access into the file server and has full
control over the data in it. In state Works tati o n_hacked
(row 15 in Table 6), the attacker has gained root access to
the workstation. These two states have the same value of
1065.5, the highest among all states, because these are the
two states that will lead him to the greatest damage to
the network. When at these states, the attacker is just one
state away from capturing the desired data from either
the file server or the workstation. For the administrator,
these two states have the most negative values (−1049.2),
meaning most damage can be done to his network when it
is in either of these states.
In state Webse rver_sniffer (row 8 in Table 6), the
attacker has a state value of 716.3, which is relatively high
compared to those for other states. This is the state in
which he has gained access to the public Web server and
installed a sniffer, i.e., a state that will potentially lead
him to stealing the data that he wants. At this state, the
value is −715.1 for the administrator. This is the second
least desirable state for him.
Table 7 shows the strategies and value vectors for the
second equilibrium we found. In this equilibrium, the at-
tacker should still prefer to attack httpd (probability of
0.13 compared to 0.00) in the state Normal_operation
(row 1). Compared to the first equilibrium, the attacker
places a higher probability on φ (probability 0.87) here.
Once the attacker has hacked into the Web server, (state
Httpd_hacked, row 5), he should just deface the Web
site and leave (probability of 0.91, compared to 0.06 and
0.04 for Install_sniffer and φ, respectively). However, if
for some reason he chooses to plant a sniffer program into
the Web server (state Webser ver_sniffer, row 8) and
manages to collect the passwords to the fileserver and
Kong-wei Lye, Jeannette M. Wing: Game strategies in network security
workstation, he should prefer very slightly (probability of
0.53) to use the password to hack into the fileserver in-
stead of the workstation (probability of 0.47). The rest
of the attack strategy is similar to the one in the first
equilibrium.
The strategy for the administrator is similar to that
in the first equilibrium except that, once he has removed
the DOS virus and compromised account from the Web
server (state Webs erver_ DOS_1, row 10), he does not
need to do anything more in state Web server_DOS_2
(row 11), which, presumably, can be avoided since the sys-
tem will be brought back to the state Normal_operation.
In this equilibrium, the administrator also has lower costs
in most of the states compared to the first equilibrium.
In the first state Normal_operation, the administra-
tor has a cost of only −79.6, compared to −206.8inthe
first equilibrium. We attribute this to the fact that the at-
tacker places only a probability of 0.13 (compared to 1.00
in the first equilibrium) on the attack action Attack_httpd
in this state.
Table 8 shows yet another equilibrium. This equilib-
rium is largely similar to the second except for a slight
twist. In state Http_hacked (row 5), instead of choosing
to remove the compromised user account and restart-
ing httpd (as in the first equilibrium), the adminis-
trator chooses to install a sniffer detector (probabil-
ity of 0.89). This action leads the system to the state
Web server_sniffer_detector (row 9) where the admin-
istrator can further observe what the attacker is going to
do before eventually removing the sniffer program and
compromised account (Fig. 4). In this equilibrium, the
administrator has lower values in his value vector. For ex-
ample, in Normal_operation, the administrator’s state
value is −28.6. This is a much lower value than that
in the first equilibrium (−206.8). Again, this is due to
the attacker placing a smaller probability (0.04, com-
pared to 1.00 in the first equilibrium) on the attack action
Attack_httpd in this state.
6 Discussion
In our game theory model we assume that the attacker
and administrator both know what the other can do. Such
common knowledge affects their decisions on what action
to take in each state and thus justifies a game formulation
of the problem. Any formal modeling technique will have
advantages and disadvantages when applied to a particu-
lar domain. We elaborate on the strengths and limitations
of our approach below.
6.1 Strengths of our approach
We could have modeled the interaction between the at-
tacker and the administrator as a purely competitive
(zero-sum) stochastic game, in which case we would al-
ways find only a single unique Nash equilibrium. Model-
ing it as a general-sum stochastic game, however, allows
us to find, potentially, multiple Nash equilibria. A Nash
equilibrium gives the administrator an idea of the attack-
er’s strategy and a plan for what to do in each state in the
event of an attack. Finding more Nash equilibria thus al-
lows him to know more about the attacker’s best attack
strategies.
By using a stochastic game model, we are able to cap-
ture the probabilistic nature of the state transitions of
a network in real life. Admittedly, solutions for stochastic
models are hard to compute, and assigning probabilities
can be difficult (Sect. 6.2).
In our example, the second and third Nash equilibria
are quite similar to the first. This similarity is due to the
simplicity of the model we constructed, but there is noth-
ing preventing us from constructing a richer, more realistic
model. A model where the administrator has more actions
to take per state would allow us to find more interesting
equilibria. For example, in our model the administrator
only needs to act when he suspects the network is under at-
tack. A more aggressive administrator might have a larger
action set for attack prevention and attack detection; he
might take the action to set up a “honeypot” network to
lure attackers and learn their capabilities.
One might wonder why the administrator would not
put in place all possible security measures. In practice,
tradeoffs have to be made between security and usabil-
ity, between security and performance, and between secu-
rity and cost. Moreover, a network may have to remain
in operation despite known vulnerabilities (e.g., [6]). Be-
cause a network system is not perfectly secure, our game
theoretic formulation of the security problem allows the
administrator to discover the potential attack strategies
of an attacker as well as best defense strategies against
them.
6.2 Limitations to our approach
Though a disadvantage of our model is that the full
state space can be extremely large, we are interested
in only a small subset of states that are in attack
scenarios. One way of generating these states is the
attack-scenario-generation method developed by Sheyner
et al. [13]. This method uses an enhancement to the
standard model-checking algorithm to generate multi-
ple counterexamples; an attack graph is simply a suc-
cinct and complete representation of the set of violations
(counterexamples) of a given desired property (e.g., an
attack can never gain root access to a workstation). To
apply our game-theoretic analysis, we would further aug-
ment the set of scenario states with state transition prob-
abilities and costs/rewards as functions of both players’
actions. We discuss this idea further in Sect. 8.
Another difficulty in our approach is in building the
game model in the first place. There are two challenges:
assigning numbers and modeling the players.
In practice, it may be difficult to assign the costs/re-
wards for the actions and the transition probabilities. We
Kong-wei Lye, Jeannette M. Wing: Game strategies in network security
share this difficulty with other qualitative and quantita-
tive approaches to security where similar estimates are
required. Qualitative approaches avoid the need to give
precise numbers but still require judgment. For example,
in the National Institute of Standards and Technology
risk management guide [14], system administrators are
expected to assign high, medium,andlow values for es-
timating the likelihood of an attack and to assign similar
qualitative assessments for estimating impact of attack,
cost of asset protected, and cost of risk mitigation strat-
egy. In Meadows’s work on cost-based analysis of DOS
attacks, costs are assigned to an attacker’s actions using
categories such as cheap, medium, expensive,andvery ex-
pensive [12]. Such estimates could be adapted for a game-
theoretic model, though the coarseness of the symbolic
measures could lead to an overly conservative model.
The limitation of obtaining good quantitative esti-
mates is discussed thoroughly in Butler’s dissertation on
the Security Attribute and Evaluation Method [4, 5]. But-
ler’s own quantitative cost-benefit method gives network
administrators a practical way of calculating tradeoffs
between security vulnerabilities and security measures.
Instead of requiring absolute estimates on costs and prob-
abilities, she requires only relative estimates, e.g., a rela-
tive ranking of a list of threats with respect to each other,
and similarly for a list of security measures. Her work is
based on the multiattribute analysis technique from deci-
sion sciences. Whereas her estimation technique is formal,
her system model is informal. The combination of her
quantitative cost-benefit method and our game-theoretic
system model would be an interesting research direction
to pursue.
The second difficulty is in modeling the actions of the
players, in particular the attacker. The results of our an-
alysis are only as good as the inputs to our model. If
we omit an attacker action, then we will not be able to
represent any scenario involving that action. In practice,
attackers will devise new actions, new ways in which to
attack a system, and hence they will be missing from our
model. This limitation is shared by other formal model-
ing techniques, which represent a system’s environment
implicitly (e.g., a set of assumptions) or explicitly (e.g.,
a simulator). For security, however, this limitation may
be more pronounced than, say, for fault-tolerance or real-
time control, where environmental actions are also un-
known or unpredictable. Thus, we are limited in our an-
alysis to modeling known attacks, and at best a catchall
“unknown attack” with a guess at its probability and
cost. Our formal framework at least gives system adminis-
trators a formal basis for making decisions relative to the
accuracy of the input model.
7 Related work
The use of game theory in modeling attackers and defend-
ers appears in other areas of research. For example, in
military and information warfare, the enemy is modeled
as an attacker and has actions and strategies to disrupt
the defense networks. Browne describes how to use static
games to analyze attacks involving complicated and het-
erogeneous military networks [2]. In his example, a de-
fense team has to defend a network of three hosts against
an attacking team’s worms. A defending team member
can choose either to run a worm detector or not. De-
pending on the combined attack and defense actions, each
outcome has different costs. This problem is similar to
ours if we view the actions of each team member as sep-
arate actions of a single player. The interactions between
the two teams, however, are dynamic and can be bet-
ter represented using a stochastic model as we did here.
In his master’s thesis, Burke studies the use of repeated
games with incomplete information to model attackers
and defenders in information warfare [3]. As in our work,
the objective is to predict enemy strategies and find de-
fenses against them using a game model. Using static
game models, however, requires the problem to be ab-
stracted to a very high level, and only simple analyses
are possible. Our use of a stochastic model in this paper
allows us to capture the probabilistic nature of state tran-
sitions in real life.
In the study of network reliability, Bell considers
a zero-sum game in which the router has to find a least-
cost path and a network tester seeks to maximize this
cost by failing a link [1]. The problem is similar to ours
in that two players are in some form of control over
the network and they have opposite objectives. Find-
ing the least-cost path in their problem is analogous to
finding a best defense strategy in ours. Hespanha and
Bohacek discuss routing games in which an adversary
tries to intersect data packets in a computer network [9].
The designer of the network has to find routing policies
that avoid links that are under the attacker’s surveil-
lance. Finding their optimal routing policy is similar to
finding the least-cost path in Bell’s work [1] and the
best defense strategy in our problem in that at every
state, each player has to make a decision on what action
to take. Again, their game model is a zero-sum game.
In comparison, our work uses a more general (general-
sum) game model that allows us to find more Nash
equilibria.
McInerney et al. use a simple one-player game in their
FRIARS cyber-defense decision system capable of re-
acting autonomously to automated system attacks [11].
Their problem is similar to ours in having cyberspace at-
tackers and defenders. Instead of finding complete strate-
gies, their single-player game model is used to predict
the opponent’s next move one at a time. Their model is
closer to being just a Markov decision problem because
it is a single-player game. Ours, in contrast, exploits fully
what a (two-player) game model can allow us to find,
namely, equilibrium strategies for both players.
Finally, Syverson mentions the idea of “good” nodes
fighting “evil” nodes in a network and suggests using
Kong-wei Lye, Jeannette M. Wing: Game strategies in network security
stochastic games for reasoning and analysis [15]. In this
paper, we have precisely formalized this idea and given
a concrete example in detail.
Thus, to the best of our knowledge, we are the first to
show a formal application of a game-theoretic model in
the context of network security. Our formulation and ex-
ample are different from previous work in that we employ
a general-sum stochastic game model. This model allows
us to perform a richer analysis for more complicated prob-
lems and also allows us to find multiple Nash equilibria
(sets of best responses) instead of a single equilibrium.
Finally, our illustration of our formal model on a con-
crete example gives rise to realistic attack-and-recover
scenarios.
8 Conclusions and future work
We have shown how the network security problem can
be modeled as a general-sum stochastic game between
the attacker and the administrator. Using the nonlinear
program NLP-1, we computed multiple Nash equilib-
ria, each denoting best strategies (best responses) for
both players. For the first Nash equilibrium, we ex-
plained why these strategies make sense and are useful
for the administrator. We showed in the second and
third equilibria that there are more strategies that the
attacker could use. Discussions with one of our uni-
versity’s network managers revealed that these results
are indeed useful and provided him with additional in-
sight. Our analysis allows him to discover strategies
that an attacker could use and helps him in plan-
ning future software and hardware upgrades that will
strengthen weak points in the network. With proper
modeling, the game-theoretic analysis we presented here
can also be applied to other general heterogeneous
networks.
In the future, we wish to develop a systematic method
for decomposing large models into smaller manageable
components such that strategies can be found individu-
ally for them using conventional Markov Decision Pro-
cess (MDP) and game-theoretic solution methods such as
dynamic programming, policy iteration, and value iter-
ation. For example, we can regard nearly isolated clus-
ters of states as subgames, and we can regard states in
which only one player has meaningful actions as an MDP.
We can then compose the overall best response for each
player from the strategies for the components. We expect
that we can significantly reduce the computation time by
using such a decomposition method.
We have recently used the method by Sheyner et al.
[13] for automatically generating attack graphs to repli-
cate our example, which we generated manually in this
paper. In further work [10], they show how to augment
state transitions with probabilities to represent the like-
lihood of a given atomic action, and they formally draw
a correspondence between probabilistic attack graphs
and MDPs. Thus, by starting with their model-checking-
based algorithm for generating attack graphs, we hope
to experiment with network examples that are larger and
more complicated than the one given here.
We view our work as a first step in the application
of game theory to security. While others have informally
suggested this formalism for modeling security, due to the
adversarial nature of attackers, we worked out how a very
general game-theoretic formalism might actually be ap-
plied in this context. In so doing, we note in Sect. 6.2 the
limitations of our approach; some limitations are common
to other formal modeling techniques, but others suggest
further research work.
Acknowledgements. The first author is supported by the Singa-
pore Institute of Manufacturing Technology (SIMTech) and the
second author in part by the Army Research Office (ARO) under
contract no. DAAD19-01-1-0485 and the National Science Founda-
tion under contract no. CCR-0121547. The views and conclusions
contained herein are those of the authors and should not be inter-
preted as necessarily representing the official policies or endorse-
ments, either expressed or implied, of SIMTech, the DOD, ARO,
NSF, or the US government.
References
1. Bell MGH (2001) The measurement of reliability in stochastic
transport networks. In: Proceedings, IEEE Intelligent Trans-
portation Systems, pp 1183–1188
2. Browne R (2000) C4I defensive infrastructure for survivability
against multi-mode attacks. In: Proceedings of the conference
on 21st century military communications: architectures and
technologies for information superiority, 1:417–424
3. Burke D (1999) Towards a game theory model of information
warfare. Master’s thesis, Graduate School of Engineering and
Management, Airforce Institute of Technology, Air University
4. Butler SA (2002) Security attribute evaluation method: a
cost-benefit approach. In: Proceedings of the international
conference on software engineering, Orlando, FL, May 2002
5. Butler SA (2003) Security attribute evaluation method. PhD
thesis, Carnegie Mellon University, Computer Science Depart-
ment, Pittsburgh
6. Crume J (2000) Inside Internet security. Addison-Wesley,
Reading, MA
7. Filar J, Vrieze K (1996) Competitive Markov decision pro-
cesses. Springer, Berlin Heidelberg New York
8. Fudenberg D, Tirole J (1991) Game Theory. MIT Press, Cam-
bridge, MA
9. Hespanha JP, Bohacek S (2001) Preliminary results in routing
games. In: Proceedings of the 2001 American Control confer-
ence, 3:1904–1909
10. Jha S, Sheyner O, Wing J (2002) Minimization and reliability
analyses of attack graphs. Carnegie Mellon University Techni-
cal Report CS-02-109, February
11. McInerney J, Stubberud S, Anwar S, Hamilton S (2001) Fri-
ars: a feedback control system for information assurance using
a markov decision process. In: Proceedings of the IEEE 35th
annual international Carnahan conference on security technol-
ogy, pp 223–228
12. Meadows C (2001) A cost-based framework for analysis of de-
nial of service in networks. J Comput Secur 9(1–2):143–164
13. Sheyner O, Jha S, Wing J (2002) Automated generation and
analysis of attack graphs. In: Proceedings of the IEEE sympo-
sium on security and privacy, Oakland, CA
14. Stoneburner G, Goguen A, Feringa A (2001) Risk man-
agement guide for information technology systems. National
Institute of Standards and Technology Special Publication,
800(30)
Kong-wei Lye, Jeannette M. Wing: Game strategies in network security
15. Syverson PF (1997) A different look at secure distributed com-
putation. In: Proceedings of the 10th workshop on computer
security foundations, pp 109–115
Appendix: Tables for network example
Tabl e 1. State names and numbers: we provide this and the next
two summary tables for reading the remaining tables in this
appendix
State number State name
1 Normal_operation
2 Httpd_attacked
3 Ftpd_attacked
4 Ftpd_attacked_detector
5 Httpd_hacked
6 Ftpd_hacked
7 Web si te _defaced
8 Web se rver_sniffer
9 Web se rver_sniffer_detector
10 Web se rver_DOS_1
11 Web se rver_DOS_2
12 Network_shutdown
13 Fileserver_hacked
14 Fileserver_data_ stolen_1
15 Work st ati on_ hacked
16 Work st ati on_ data_stolen_1
17 Fileserver_data_ stolen_2
18 Work st ati on_ data_stolen_2
Tabl e 2. Attacker’s action names and numbers
Attacker’s action numbers and names
State no. \ 123
Action no.
1 Attack_httpd Attack_ftpd φ
2 Continue_attacking φφ
3 Continue_attacking φφ
4 Continue_attacking φφ
5 Deface_website Install_sniffer φ
6 Install_sniffer φφ
7 φφφ
8 Run_DOS_virus Crack_file_server_ Crack_workstation_
root_password root_password
9 φφφ
10 φφφ
11 φφφ
12 φφφ
13 Capture_data φφ
14 Shutdown_network φφ
15 Capture_data φφ
16 Shutdown_network φφ
17 φφφ
18 φφφ
Tabl e 3. Administrator’s action names and numbers
Administrator’s action numbers and names
State no. \ 123
Action no.
1 φφφ
2 φφφ
3 Install_sniffer_ φφ
detector
4 Remove_sniffer_detector φφ
5 Remove_compromised_ Install_sniffer_ φ
account_restart_httpd detector
6 Remove_compromised_ Install_sniffer_ φ
account_restart_ftpd detector
7 Restore_ website_remove_ φφ
compromised_account
8 φφφ
9 Remove_sniffer_and_ φφ
compromised_account
10 Remove_ virus_and_ φφ
compromised_account
11 Remove_ virus_and_ φφ
compromised_account
12 Remove_ virus_and_ φφ
compromised_account
13 φφφ
14 Remove_sniffer_and_ φφ
compromised_account
15 φφφ
16 Remove_sniffer_and_ φφ
compromised_account
17 φφφ
18 φφφ
Kong-wei Lye, Jeannette M. Wing: Game strategies in network security
Tabl e 4. State transition probabilities (remaining probabilities
are either set to 0 or assigned to transitions
to a “catchall” state)
State 1
P(2 | 1,1,·) = 1/3
P(3 | 1,2,·) = 1/3
P(1 | 1,3,·)=1
State 2
P(2 | 2,1,·)=0.5/3
P(5 | 2,1,·)=0.5/3
P(1 | 2,2,·)=1
P(1 | 2,3,·)=1
State 3
P(3 | 3,1,2)= 0.5
P(3 | 3,1,3)= 0.5
P(6 | 3,1,2)= 0.5
P(6 | 3,1,3)= 0.5
P(4 | 3,1,1)= 1
State 4
P(1 | 4,2,1)= 1
P(1 | 4,3,1)= 1
P(3 | 4,1,1)= 1
P(4 | 4,1,2)= 1
P(4 | 4,1,3)= 1
State 5
P(7 | 5,1,3)=0.8
P(8 | 5,2,3)=0.8
P(9 | 5,2,2)=0.8
P(1 | 5,3,1)=1
P(1 | 5,3,1)=1
State 6
P(8 | 6,1,3)=0.8
P(9 | 6,1,2)=0.8
P(1 | 6,2,1)=1
P(1 | 6,3,1)=1
P(6 | 6,2,3)=1
P(6 | 6,3,3)=1
State 7
P(1 | 7,·,1)=1
P(7 | 7, ·,2)=0.9
P(7 | 7, ·,3)=0.9
State 8
P(10 | 8,1,·) = 1/3
P(13 | 8,2,·) = 0.9/3
P(15 | 8,3,·) = 0.9/3
State 9
P(1 | 9, ·,1)=1
State 10
P(1 | 10,·,1)= 1
P(11 | 10,·,2)= 0.8
P(11 | 10,·,3)= 0.8
State 11
P(1 | 11,·,1)= 1
P(12 | 11,·,2)= 0.8
P(12 | 11,·,3)= 0.8
State 12
P(1 | 12, ·,1)=1
P(12 | 12, ·,2)=0.9
P(12 | 12, ·,3)=0.9
State 13
P(14 | 13,1,·)=1
State 14
P(12 | 14,1,2)=1
P(12 | 14,1,3)=1
P(17 | 14,2,1)=1
P(17 | 14,3,1)=1
P(12 | 14,1,1)=0.5
P(17 | 14,1,1)=0.5
State 15
P(16 | 15,1, ·)=1
State 16
P(12 | 16,1,2)=1
P(12 | 16,1,3)=1
P(18 | 16,2,1)=1
P(18 | 16,3,1)=1
P(12 | 16,1,1)=0.5
P(18 | 16,1,1)=0.5
State 17
P(17 | 17,·,·)=0.9
State 18
P(18 | 18,·,·)=0.9
Tabl e 5. Reward and cost matrices
R
1
(1) =
10 10 10
10 10 10
000
R
2
(1) = −R
1
(1)
R
1
(2) =
000
000
000
R
2
(2) = R
1
(2)
R
1
(3) =
000
000
000
R
2
(3) =
−10 −10 −20
−10 −10 0
−10 −10 0
R
1
(4) =
20 10 10
000
000
R
2
(4) =
−20 −10 −10
−10 0 0
−10 0 0
R
1
(5) =
99 50 99
10 0 10
0 −10 0
R
2
(5) =
−99 −99 −99
10 10 −10
−10 −10 0
R
1
(6) =
0010
−10 0 0
−10 0 0
R
2
(6) = −R
1
(6)
R
1
(7) =
000
000
000
R
2
(7) =
−9900
−9900
−9900
R
1
(8) =
30 30 30
50 50 50
50 50 50
R
2
(8) = −R
1
(8)
R
1
(9) =
−20 0 0
−20 0 0
−20 0 0
R
2
(9) = R
1
(9)
R
1
(10) =
3000
3000
3000
R
2
(10) =
−3000
−3000
−3000
R
1
(11) =
3000
3000
3000
R
2
(11) =
−6000
−6000
−6000
R
1
(12) =
000
000
000
R
2
(12) =
−9000
−9000
−9000
R
1
(13) =
999 999 999
000
000
R
2
(13) = −R
1
(13)
R
1
(14) =
30 60 60
000
000
R
2
(14) =
−10 −60 −60
−20 0 0
−20 0 0
R
1
(15) =
999 999 999
000
000
R
2
(15) = −R
1
(15)
R
1
(16) =
30 60 60
000
000
R
2
(16) =
−10 −60 −60
−20 0 0
−20 0 0
R
1
(17) =
000
000
000
R
2
(17) = R
1
(17)
R
1
(18) =
000
000
000
R
2
(18) = R
1
(18)
Kong-wei Lye, Jeannette M. Wing: Game strategies in network security
Tabl e 6. Nash equilibrium 1: Strategies and state values for attacker and administrator
Strategies State Values
State Attacker Administrator Attacker Administrator
1 Normal_operation [ 1.00 0.00 0.00 ] [ 0.33 0.33 0.33 ] 210.2 –206.8
2 Httpd_ attacked [ 1.00 0.00 0.00 ] [ 0.33 0.33 0.33 ] 202.2 –191.1
3 Ftpd_attacked [ 0.65 0.00 0.35 ] [ 1.00 0.00 0.00 ] 176.9 –189.3
4 Ftpd_attacked_detector [ 0.40 0.12 0.48 ] [ 0.93 0.07 0.00 ] 165.8 –173.8
5 Httpd_ hacked [ 0.33 0.10 0.57 ] [ 0.67 0.19 0.14 ] 197.4 –206.4
6 Ftpd_hacked [ 0.12 0.00 0.88 ] [ 0.96 0.00 0.04 ] 204.8 –203.5
7 Websi te _defaced [ 0.33 0.33 0.33 ] [ 0.33 0.33 0.33 ] 80.4 –80.0
8 Web se rver_sniffer [ 0.00 0.50 0.50 ] [ 0.33 0.33 0.34 ] 716.3 –715.1
9 We bs erve r_sniffer_detector [ 0.34 0.33 0.33 ] [ 1.00 0.00 0.00 ] 148.2 –185.4
10 Webs er ver_DOS_1 [ 0.33 0.33 0.33 ] [ 1.00 0.00 0.00 ] 106.7 –106.1
11 Webs er ver_DOS_2 [ 0.34 0.33 0.33 ] [ 1.00 0.00 0.00 ] 96.5 –96.0
12 Network_shutdown [ 0.33 0.33 0.33 ] [ 0.33 0.33 0.33 ] 80.4 –80.0
13 Fileserver_hacked [ 1.00 0.00 0.00 ] [ 0.35 0.34 0.31 ] 1065.5 –1049.2
14 Fileserver_data_stolen_1 [ 1.00 0.00 0.00 ] [ 1.00 0.00 0.00 ] 94.4 –74.0
15 Works tat io n_hacked [ 1.00 0.00 0.00 ] [ 0.31 0.32 0.37 ] 1065.5 –1049.2
16 Wo rks ta tio n_data_stolen_1 [ 1.00 0.00 0.00 ] [ 1.00 0.00 0.00 ] 94.4 –74.0
17 Fileserver_data_stolen_2 [ 0.33 0.33 0.33 ] [ 0.33 0.33 0.33 ] 80.4 –80.0
18 Wo rks ta tio n_data_stolen_2 [ 0.33 0.33 0.33 ] [ 0.33 0.33 0.33 ] 80.4 –80.0
Tabl e 7. Nash equilibrium 2: Strategies and state values for attacker and administrator
Strategies State Values
State Attacker Administrator Attacker Administrator
1 Normal_operation [ 0.13 0.00 0.87 ] [ 0.26 0.22 0.52 ] 212.7 –79.6
2 Httpd_ attacked [ 1.00 0.00 0.00 ] [ 0.27 0.30 0.43 ] 204.6 –166.9
3 Ftpd_attacked [ 0.12 0.32 0.56 ] [ 1.00 0.00 0.00 ] 179.1 –141.0
4 Ftpd_attacked_detector [ 0.12 0.00 0.88 ] [ 0.93 0.07 0.00 ] 167.7 –80.8
5 Httpd_ hacked [ 0.91 0.06 0.04 ] [ 0.66 0.20 0.13 ] 199.2 –177.4
6 Ftpd_hacked [ 0.10 0.00 0.90 ] [ 0.70 0.23 0.08 ] 207.9 –175.0
7 Websi te _defaced [ 0.39 0.26 0.34 ] [ 0.23 0.35 0.41 ] 81.4 –70.7
8 Web se rver_sniffer [ 0.00 0.53 0.47 ] [ 0.34 0.42 0.24 ] 719.0 –690.0
9 We bs erve r_sniffer_detector [ 0.34 0.34 0.33 ] [ 1.00 0.00 0.00 ] 150.2 –83.7
10 Webs er ver_DOS_1 [ 0.24 0.40 0.35 ] [ 0.52 0.29 0.19 ] 140.5 –93.7
11 Webs er ver_DOS_2 [ 0.33 0.39 0.28 ] [ 0.00 0.59 0.41 ] 97.7 –84.8
12 Network_shutdown [ 0.34 0.32 0.34 ] [ 0.29 0.26 0.45 ] 81.4 –70.7
13 Fileserver_hacked [ 1.00 0.00 0.00 ] [ 0.11 0.41 0.48 ] 1066.1 –1043.2
14 Fileserver_data_stolen_1 [ 1.00 0.00 0.00 ] [ 1.00 0.00 0.00 ] 95.1 –66.5
15 Works tat io n_hacked [ 1.00 0.00 0.00 ] [ 0.33 0.24 0.43 ] 1066.1 –1043.2
16 Wo rks ta tio n_data_stolen_1 [ 1.00 0.00 0.00 ] [ 1.00 0.00 0.00 ] 95.1 –66.5
17 Fileserver_data_stolen_2 [ 0.39 0.25 0.36 ] [ 0.31 0.42 0.26 ] 81.4 –70.7
18 Wo rks ta tio n_data_stolen_2 [ 0.23 0.50 0.27 ] [ 0.25 0.42 0.33 ] 81.4 –70.7
Kong-wei Lye, Jeannette M. Wing: Game strategies in network security
Tabl e 8. Nash equilibrium 3: Strategies and state values for attacker and administrator
Strategies State Values
State Attacker Administrator Attacker Administrator
1 Normal_operation [ 0.04 0.00 0.96 ] [ 0.33 0.36 0.31 ] 224.2 –28.6
2 Httpd_ attacked [ 1.00 0.00 0.00 ] [ 0.35 0.32 0.34 ] 218.1 –161.0
3 Ftpd_attacked [ 0.20 0.11 0.69 ] [ 0.77 0.23 0.00 ] 199.2 –163.0
4 Ftpd_attacked_detector [ 0.96 0.01 0.04 ] [ 1.00 0.00 0.00 ] 179.3 –145.3
5 Httpd_ hacked [ 1.00 0.00 0.00 ] [ 0.00 0.89 0.11 ] 232.3 –155.8
6 Ftpd_hacked [ 0.10 0.00 0.90 ] [ 0.96 0.00 0.04 ] 218.9 –169.2
7 Websi te _defaced [ 0.42 0.37 0.21 ] [ 0.27 0.30 0.43 ] 85.8 –69.1
8 Webs er ve r_sniffer [ 0.00 0.49 0.51 ] [ 0.33 0.35 0.32 ] 730.7 –685.7
9 We bs erve r_sniffer_detector [ 0.31 0.32 0.38 ] [ 1.00 0.00 0.00 ] 159.3 –42.9
10 Webs er ver_DOS_1 [ 0.27 0.29 0.44 ] [ 1.00 0.00 0.00 ] 179.3 –52.9
11 Webs er ver_DOS_2 [ 0.38 0.29 0.34 ] [ 0.90 0.05 0.06 ] 171.5 –82.9
12 Network_shutdown [ 0.36 0.21 0.43 ] [ 0.18 0.40 0.42 ] 85.8 -69.1
13 Fileserver_hacked [ 1.00 0.00 0.00 ] [ 0.29 0.28 0.43 ] 1068.9 –1042.2
14 Fileserver_data_stolen_1 [ 1.00 0.00 0.00 ] [ 1.00 0.00 0.00 ] 98.6 –65.3
15 Works tat io n_hacked [ 1.00 0.00 0.00 ] [ 0.39 0.24 0.36 ] 1068.9 –1042.2
16 Wor ks tati on _data_stolen_1 [ 1.00 0.00 0.00 ] [ 1.00 0.00 0.00 ] 98.6 –65.3
17 Fileserver_data_stolen_2 [ 0.31 0.48 0.21 ] [ 0.31 0.37 0.32 ] 85.8 –69.1
18 Wor ks tati on _data_stolen_2 [ 0.39 0.36 0.25 ] [ 0.38 0.37 0.25 ] 85.8 –69.1