Economic Costs of Cancer Health Disparities pot
Bạn đang xem bản rút gọn của tài liệu. Xem và tải ngay bản đầy đủ của tài liệu tại đây (754.29 KB, 71 trang )
Center to Reduce Cancer
Health Disparities (CRCHD)
SUMMARY OF MEETING PROCEEDINGS
Economic Costs
of Cancer Health
Disparities
U.S. DEPARTMENT OF HEALTH AND HUMAN SERVICES
National Institutes of Health
Economic Costs of Cancer Health Disparities: Summary of Meeting Proceedings 3
Acknowledgements
The analysis and recommendations presented in this report represent a synthesis
of the fi ndings of a Think Tank meeting convened by the NCI Center to Reduce
Cancer Health Disparities. We wish to acknowledge and thank the following
people for their commitment, hard work, and assistance in the development of
this report.
Editor
Emmanuel A. Taylor, Dr.P.H.
Health Scientist Administrator
Center Staff Involved in Program Development
Nadarajen A. Vydelingum, Ph.D.
Deputy Director
Barbara K. Wingrove, M.P.H.
Chief, Health Policy Branch
Emmanuel A. Taylor, Dr.P.H.
Health Scientist Administrator
Participants
Economic Costs of Cancer Health Disparities Think Tank
December 6-7, 2004, Bethesda, MD: Appendix A
Special Acknowledgements
Martin Brown, Ph.D., Joseph Lipscomb, Ph.D., and Scott Ramsey, M.D., Ph.D.
for their expert consultation on the drafts and suggestions for revision of the
fi nal report, in addition to their participation as members of the December, 2004
Think Tank.
Manuscript Preparation (NCI Contract No. 263-FQ-513547)
Sujha Subramanian, Ph.D.
Shahnaz Khan, M.P.H.
RTI International
Planning and Logistical Support
NOVA Research Company (NCI Contract No. N02-CO-34222)
4 Economic Costs of Cancer Health Disparities: Summary of Meeting Proceedings
FOREWORD . . . . . . . . . . . . . . . . . . . . . . . . . . . . . . . . . . . . . . . . . . . . . . . . . . . . . . . . . . . . 6
EXECUTIVE SUMMARY . . . . . . . . . . . . . . . . . . . . . . . . . . . . . . . . . . . . . . . . . . . . . . . . . . 8
SECTION 1 INTRODUCTION
1.1 Background . . . . . . . . . . . . . . . . . . . . . . . . . . . . . . . . . . . . . . . . . . . . . . . . . . 11
1.2 Objectives . . . . . . . . . . . . . . . . . . . . . . . . . . . . . . . . . . . . . . . . . . . . . . . . . . . 12
1.3 Think Tank Process . . . . . . . . . . . . . . . . . . . . . . . . . . . . . . . . . . . . . . . . . . . . 12
1.4 Organization of Report . . . . . . . . . . . . . . . . . . . . . . . . . . . . . . . . . . . . . . . . . 12
SECTION 2: OVERVIEW
2.1 Defi nition of Disparity . . . . . . . . . . . . . . . . . . . . . . . . . . . . . . . . . . . . . . . . . . 13
2.2 Determinants of Disparities . . . . . . . . . . . . . . . . . . . . . . . . . . . . . . . . . . . . 14
Factors Within the Health Care Delivery System . . . . . . . . . . . . . . . . . . 14
Factors External to the Health Care Delivery System . . . . . . . . . . . . . . . 15
2.3 Screening, Diagnosis, and Treatment Disparities: the
Cancer Care Continuum . . . . . . . . . . . . . . . . . . . . . . . . . . . . . . . . . . . . . . . . 18
SECTION 3: TOTAL COST OF CANCER CARE
3.1 Overview of Cost Domains . . . . . . . . . . . . . . . . . . . . . . . . . . . . . . . . . . . . . 20
3.2 Overall Cost of Cancer Care . . . . . . . . . . . . . . . . . . . . . . . . . . . . . . . . . . . . 21
Direct Health Care Costs . . . . . . . . . . . . . . . . . . . . . . . . . . . . . . . . . . . . . . . 22
Time Costs . . . . . . . . . . . . . . . . . . . . . . . . . . . . . . . . . . . . . . . . . . . . . . . . . . . 23
Employment Costs . . . . . . . . . . . . . . . . . . . . . . . . . . . . . . . . . . . . . . . . . . . . 23
3.3 Data Limitations . . . . . . . . . . . . . . . . . . . . . . . . . . . . . . . . . . . . . . . . . . . . . . 24
SECTION 4: ECONOMIC BENEFITS OF REDUCING CANCER HEALTH DISPARITIES
4.1 Benefi ts of Reducing Cancer Health Disparities . . . . . . . . . . . . . . . . . . . 27
4.2 Measuring the Value of Reducing Disparities . . . . . . . . . . . . . . . . . . . . . 28
Estimating Mortality, Morbidity, and HRQL Impacts . . . . . . . . . . . . . . . . 28
Estimating Economic Impacts . . . . . . . . . . . . . . . . . . . . . . . . . . . . . . . . . . 29
SECTION 5: BENEFITS AND COSTS OF POLICIES TO REDUCE CANCER
HEALTH DISPARITIES
5.1 Why Economics Matter . . . . . . . . . . . . . . . . . . . . . . . . . . . . . . . . . . . . . . . . 33
Comparing Cost and Effectiveness . . . . . . . . . . . . . . . . . . . . . . . . . . . . . . 33
Budget Impact Analysis . . . . . . . . . . . . . . . . . . . . . . . . . . . . . . . . . . . . . . . . 34
5.2 Importance of Perspective in Economic Assessment . . . . . . . . . . . . . . 34
5.3 Calculating Incremental Cost-Effectiveness Ratio . . . . . . . . . . . . . . . . . 35
5.4 Characteristics of Potentially Cost-Effective Interventions . . . . . . . . . 35
5.5 Provider Incentives and Barriers to Change . . . . . . . . . . . . . . . . . . . . . . 35
SECTION 6: RECOMMENDATIONS AND RESEARCH AGENDA
6.1 Research Recommendations . . . . . . . . . . . . . . . . . . . . . . . . . . . . . . . . . . . 37
6.2 Policy Recommendations . . . . . . . . . . . . . . . . . . . . . . . . . . . . . . . . . . . . . . 38
REFERENCES. . . . . . . . . . . . . . . . . . . . . . . . . . . . . . . . . . . . . . . . . . . . . . . . . . . . . . . . . . 41
GLOSSARY . . . . . . . . . . . . . . . . . . . . . . . . . . . . . . . . . . . . . . . . . . . . . . . . . . . . . . . . . .46
APPENDIX A: PARTICIPANT LIST . . . . . . . . . . . . . . . . . . . . . . . . . . . . . . . . . . . . . . . .48
APPENDIX B: ECONOMIC COSTS — DISCUSSION QUESTIONS . . . . . . . . . . . . . 52
APPENDIX C: ECONOMIC COSTS — BACKGROUND PAPER . . . . . . . . . . . . . . . . 54
APPENDIX D: AGENDA AND MEETING PRESENTATIONS . . . . . . . . . . . . . . . . . . . 70
TABLE OF
CONTENTS
Economic Costs of Cancer Health Disparities: Summary of Meeting Proceedings 5
LIST OF FIGURES
Figure 1: Ratio of the Probability of Diagnosis of Cancer at
Late Stage, Uninsured Compared with Insured, 1994 . . . . . . . . . . . 14
Figure 2: Causes of Cancer Health Disparities . . . . . . . . . . . . . . . . . . . . . . . . . 15
Figure 3: U.S. Cervical Cancer Mortality by Race
and Poverty Level, 1996-2000 . . . . . . . . . . . . . . . . . . . . . . . . . . . . . . . 16
Figure 4: Critical Disconnect Between Research/Discovery
and Delivery of Care . . . . . . . . . . . . . . . . . . . . . . . . . . . . . . . . . . . . . . . 17
Figure 5: Cancer Care Continuum . . . . . . . . . . . . . . . . . . . . . . . . . . . . . . . . . . . . 17
Figure 6: Treatment Cost and Survival: Breast Cancer . . . . . . . . . . . . . . . . . . 21
Figure 7: Framework for Assessing Economic Costs of
Cancer Health Disparities . . . . . . . . . . . . . . . . . . . . . . . . . . . . . . . . . . 27
Figure 8: Cost Effectiveness Plane . . . . . . . . . . . . . . . . . . . . . . . . . . . . . . . . . . . 33
Appendix Figure C-1: Causes of Health Disparities . . . . . . . . . . . . . . . . . . . . . 56
Appendix Figure C-2: The Cancer Care Continuum . . . . . . . . . . . . . . . . . . . . . 58
Appendix Figure C-3: Types of Health Care Costs . . . . . . . . . . . . . . . . . . . . . . 62
LIST OF TABLES
Table 1: Specifi c Cost Elements Required for Measuring
Total Cost of Cancer Care . . . . . . . . . . . . . . . . . . . . . . . . . . . . . . . . . . . 20
Table 2: Cancer-Related Treatment Cost of Colorectal Cancer . . . . . . . . . . . 22
Table 3: Estimates of Direct Costs for Cancer
Based on SEER Medicare Data, 1996 . . . . . . . . . . . . . . . . . . . . . . . . . 22
Table 4: Time Costs Related to Colorectal Cancer Treatment:
Difference in Cost for Cases Versus Controls (Net Costs) . . . . . . . . 22
Table 5: Comparison of CEA, CBA and CUA . . . . . . . . . . . . . . . . . . . . . . . . . . . 34
6 Economic Costs of Cancer Health Disparities: Summary of Meeting Proceedings
Foreword
Why examine the cost of cancer health disparities? Disparities in cancer care and outcomes result in both
economic and human costs. Public policy approaches to eliminate cancer-related disparities require an
understanding of these costs to fi nd appropriate balances between the actual dollars spent and the poten-
tial value to American society. For these reasons, understanding the costs associated with these disparities
is vital to the work of the National Cancer Institute (NCI) Center to Reduce Cancer Health Disparities.
This fi rst NCI Think Tank on the economic costs of cancer health disparities was an important step in
exploring these issues.
Considerations of the cost of cancer health disparities often focus principally on the expenditures associ-
ated with eliminating existing disparities. However, current disparities have an ongoing cost that is less
well recognized. Specifi cally, all people with cancer in America eventually receive care, since severely
symptomatic patients seldom are denied hospital care. But if treatment is ineffective because the disease
already is advanced, the associated costs likely will be higher both in dollars and in human suffering.
The Think Tank participants emphasized the distinction that must be made between cost and value.
They further underscored that both cancer disparity costs and the value accruing from reducing these
disparities may be tangible and intangible. For example, tangible costs may include dollars spent on
treatment and lost wages, whereas tangible value may include reduced individual and health system costs,
lives saved, and restored productivity. Intangible costs of cancer may include emotional anguish and
diminished quality of life for patients and their families, whereas intangible value may include reduced
suffering and the opportunity to redirect health care resources to disease prevention.
Disparities specifi c to cancer may be among the more easily measured types of health disparities because
of existing cancer-specifi c data collection infrastructure. Even so, based on the limited studies to date
using these data, we cannot yet quantify the full costs of existing cancer disparities, the cost of eliminat-
ing these disparities, or the real and perceived value of eliminating them. Nor can we assess, except at a
philosophical level, whether the value is worth the cost.
Moreover, perceptions of cost and value may vary according to different cultural and societal norms.
Cancer health disparities differ by disease, by population, by geographic region, by age, by gender, and by
other parameters. Therefore, the economic costs of cancer health disparities must be assessed from many
perspectives, including those of society in general, government, population groups, employers, insurers,
and each affected individual.
The fundamental question centers on the cost-benefi t that could be realized over time compared with
the current economic and human costs of cancer health disparities. Exploring this and other related
crucial questions illuminated the current gaps in knowledge that must be fi lled to appropriately frame and
address the issues. It was clear from the Think Tank deliberations that no consensus currently exists on
how to measure or balance the costs and benefi ts to the nation of eliminating cancer health disparities.
Most Americans would agree that in the aggregate, we have made great advances in this nation with
respect to disease in general, as refl ected by the remarkable increases in average life span and qual-
ity of life since 1900. But some groups of people have not enjoyed these benefi ts as much as others, as
evidenced by their outcomes of cancer and other diseases. Many people, regardless of economic status,
education, and insurance coverage, have great diffi culty negotiating the health care system and getting
from the point of an abnormal fi nding and a cancer diagnosis through the treatment of their disease.
Economic Costs of Cancer Health Disparities: Summary of Meeting Proceedings 7
This problem, often resulting in reduced survival, infl icts the greatest burden on the poor, who typically
lack fi scal, educational, and information resources.
A cascade of problems—such as fi nancial and geographic barriers to treatment; ineffective provider-
patient communication; inadequate screening, and insuffi cient post-treatment and long-term follow-
up—can occur in varying combinations over time, resulting in increased cancer-related costs. We do not
fully understand all of the potential interrelationships of these problems, but our knowledge of them has
improved. One thing has become clear: social injustice leading to unfair inequities is at the core of most
of these problems.
Realistically, we know that disparities will always exist at some level, because our social and health care
systems cannot be corrected such that every person will have equal access to care, comparable living
conditions, and equal amounts of resources. Nonetheless, we suggest that we can dramatically minimize
disparities and their costs by agreeing as a society, and committing to the belief, that it is unacceptable
for any person with cancer to go untreated. Further, we must ensure that any inequities in care are not
caused or exacerbated by biases related to race, ethnicity, culture, or socioeconomic status.
The participants in this Think Tank were drawn from diverse disciplines, including health care delivery,
health economics, health policy, statistics, health services research, public health, and social science
research. They were charged to consider the underpinnings of this complex problem and offer suggestions
for better understanding and addressing these issues. Their deliberations provided the basis of the recom-
mendations in this report.
Cancer health disparities are not only an economic and medical concern but also an extraordinary moral
and ethical dilemma for this nation. We hope that the considerations and recommendations contained in
this report will be a tool to stimulate vigorous discussion and bold action to address these issues.
Harold P. Freeman, M.D.
Senior Advisor to the Director
National Cancer Institute
Rockville, MD
Nadarajen A. Vydelingum, Ph.D.
Deputy Director
Center to Reduce Cancer Health Disparities
National Cancer Institute
Rockville, MD
8 Economic Costs of Cancer Health Disparities: Summary of Meeting Proceedings
here is a signifi cant disconnect between the development
of effi cacious prevention and treatment options estab-
lished through cancer research and the delivery of this
care to all population groups, most notably cancer patients from
certain racial and ethnic minority groups, individuals with low
socioeconomic status, residents in certain geographic locations, and
individuals from other medically underserved groups.
1
Improving
the delivery of cancer care to these population subgroups may help
to reduce cancer health disparities in the United States.
There are several different defi nitions of disparities and the con-
clusions regarding the impact of disparities can differ based on the
defi nition used.
2
The NCI’s defi nition of cancer health disparities is
as follows:
T
Executive Summary
Economic Costs of Cancer Health Disparities: Summary of Meeting Proceedings 9
“Disparities, or inequalities, occur when members of some population groups do not enjoy the same
health status as other groups.
Disparities are determined and measured by three health statistics: incidence (the number of new can-
cers), mortality (the number of cancer deaths), and survival rates (length of survival following diagnosis
of cancer). Health disparities occur when one group of people has a higher incidence or mortality rate
than another, or when survival rates are less for one group than another.
Disparities are most often identifi ed along racial and ethnic lines, i.e., African Americans, Hispan-
ics, Native Americans/Alaska Natives, Asian Americans/Pacifi c Islanders, and whites have different
disease rates and survival rates. However, factors contributing to disparities extend beyond race and
ethnicity. For example, cancer health disparities can also involve biological, environmental, and
behavioral factors, as well as differences on the basis of income and education.”
3
Disparities in care exist along the entire cancer care continuum—from primary prevention, to screen-
ing and diagnosis, to treatment and follow-up services. Examining and understanding the economic and
human costs of cancer health disparities to patients, families, employers, providers, and society as a whole
may be helpful in developing strategies to eliminate or reduce such disparities. There could be signifi cant
benefi ts to eliminating these disparities, including a reduction in mortality, decreases in cancer- and treat-
ment-related morbidity, and improved quality of life. Measurement of these human benefi ts can be cap-
tured in part through estimates of quality-adjusted life years (QALYs), which are composite measures that
include improvements in the length of life and in the quality of life associated with a particular health-
care intervention. The overall economic value to society of reducing disparities can be assessed through
cost-effectiveness analyses and cost-of-illness and/or value-of-health studies. Components of these studies
may include the direct medical and non-medical costs (related to provision of health services), indirect
costs (e.g., time lost from work and other economic activities), and concurrent changes in population
mortality and morbidity.
The costs related to cancer health disparities have not been systematically and comprehensively assessed
to date. To address this critical need, the Center to Reduce Cancer Health Disparities (CRCHD) of the
National Cancer Institute (NCI) convened a Think Tank meeting on December 6–7, 2004. The Think
Tank meeting was convened upon recommendation of an ad-hoc group of experts that met prior to this
meeting. The meeting consisted of individual presentations from an interdisciplinary team of experts,
as well as group discussions and breakout sessions to explore identifi ed issues in greater depth. The key
areas of discussion were the total costs of providing cancer care including a critical assessment of the data
limitations, challenges in measuring the value of reducing cancer health disparities, and the importance
of measuring the cost-effectiveness of interventions to reduce cancer health disparities. At the conclusion
of the two-day meeting the participants provided a list of recommendations and future research activities.
This report synthesizes the presentations and discussions of the Think Tank.
Several key conclusions were reached by the Think Tank participants. First, existing data sources have
not been used adequately to explore issues related to cancer health disparities and there are no popula-
tion-level data sources available currently to systematically estimate patient-level costs of these dispari-
ties. Improvements in the available data sources may allow for the estimation of overall patient-level cost
burdens related to disparities. The data sources can be improved in several ways: by increasing the sample
of minority populations (e.g., African Americans, Native Americans/Alaskan Natives; Asian Americans/
Pacifi c Islanders) available for analysis; by developing a national database on cancer epidemiology, out-
comes and resource use; by performing linkages among currently available databases and by clearly under-
standing and adopting national standards (e.g., Office of Management and Budget [OMB] Directive 15)
4
on race/ethnicity coding. In addition, decision analytic models can be used to combine effectiveness and
cost information from these various data sources to estimate the cost of cancer health disparities. Second,
there are signifi cant overlapping determinants of disparity and therefore there is considerable challenge
in identifying the cost impact of specifi c determinants. As cancer health disparities are not just an issue
10 Economic Costs of Cancer Health Disparities: Summary of Meeting Proceedings
Xxxxxxxxxx
among racial minority groups, the association between factors such as low socioeconomic status (SES)
and cancer health disparities should also be examined (although African Americans have the highest
rate of poverty, about 25%, the majority of Americans below the federal poverty level are white).
5
Third,
since resources available for health care and other services are fi nite, economic evaluations are essential
to identify interventions that are cost effective. Interventions that are likely to be cost effective are those
that address target populations with high degree of disparities, those interventions that are highly effec-
tive, and those that are low cost.
Through breakout group discussions, the participants addressed the economic consequences and costs of
cancer health disparities and made numerous recommendations of cost-effective interventions for eliminat-
ing these disparities. The recommendations are summarized below in two subsections—research and policy.
Research Recommendations
1. Focus on cancers with modifi able attributes and fund prospective clinical trials to evaluate primary
prevention strategies;
2. Study processes to develop improved data sources that will facilitate collection and analysis of cost and
outcomes data;
3. Develop better methods and tools to measure disparities;
4. Assess geographic variation and other factors that result in disparities;
5. Include cost-effectiveness assessments in clinical trials and other intervention studies that address
disparities;
6. Identify changes in the health care delivery system that can reduce the economic burden of cancer
health disparities; and,
7. Initiate studies to quantify uncompensated cancer care.
Policy Recommendations
1. Improve and expand current insurance coverage;
2. Sponsor health policy research to assess impact of cancer payments on quality of care;
3. Reduce geographic differences through community-level interventions;
4. Eliminate health care network disconnects; and
5. Promote primary prevention for cancer sites where evidence supporting primary prevention exists
(e.g., HPV vaccine).
The research topics and recommendations identifi ed by the Think Tank participants will help direct
NCI’s efforts in quantifying the economic burden of cancer health disparities and inform policies to elim-
inate cancer health disparities. A number of specifi c next steps were identifi ed. First, convene a panel of
experts to identify a detailed process for improving both the epidemiological and cost data available to
study and assess measures to reduce cancer health disparities. Second, sponsor studies to develop better
methods to measure cancer health disparities and to evaluate the costs associated with cancer health
disparities. Third, include cost-effectiveness assessments in any clinical trials or interventions sponsored
by NCI to reduce cancer health disparities. Fourth, coordinate activities with other federal agencies,
including Centers for Medicare and Medicaid Services (CMS), to implement initiatives to reduce cancer
health disparities.
Economic Costs of Cancer Health Disparities: Summary of Meeting Proceedings 11
Introduction
SECTION 1
1.1
Background
There is a signifi cant disconnect between cancer research discovery/development
(i.e., what we know) and the delivery of care to cancer patients (i.e., what we
do).
6
This disconnect is an important factor contributing to an imbalanced and
unjust burden of cancer in our society—the burden falling on some racial and
ethnic minority groups, individuals with low socioeconomic status (SES), resi-
dents in certain geographic locations, and other medically underserved groups.
Improving the delivery of cancer care to these population groups would help to
reduce cancer health disparities in the United States.
Examining and understanding the economic and human costs of cancer health
disparities is an important step in eliminating such disparities. Understanding the
economic costs and human costs of cancer health disparities may provide guid-
ance to policy makers with regard to cancer health care. To address this need, the
Center to Reduce Cancer Health Disparities (CRCHD) of the National Cancer
Institute (NCI) convened a Think Tank meeting on December 6–7, 2004. This
meeting brought together health economists, cancer care providers, insurers,
and policy experts to explore the economic costs to the nation resulting from
cancer health disparities among certain population groups (including racial and
ethnic minority groups and individuals with low SES) and to identify potential
interventions to address these disparities. The purpose of this report is to provide
a summary of the ideas and discussions that occurred during this meeting and to
review the current knowledge on the economics of cancer health disparities.
12 Economic Costs of Cancer Health Disparities: Summary of Meeting Proceedings
1.2
Objectives
The original objectives of the meeting were:
To examine the current evidence regarding the costs of cancer health disparities; ■
To assess the currently available cost data and data needs related to costs of cancer health disparities; ■
To explore new and creative ways of examining and estimating the economic costs of cancer health ■
disparities (since there are currently not enough databases containing data of this nature);
To strengthen the economic evidence base regarding the cost of cancer health disparities; and, ■
To explore new and creative strategies for reducing and eventually eliminating cancer health ■
disparities.
During the initial discussions among Think Tank participants, it became clear to the participants that
the evidence to support the completion of the objectives listed above was not available; therefore, the
participants focused on intervention strategies and future research areas which will enable completion
of these objectives.
1.3
Think Tank Process
The Think Tank meeting consisted of individual presentations from the interdisciplinary team of experts,
as well as group discussions and breakout sessions to explore certain issues in greater depth (see Appendix
A for a list of meeting participants). Participants for the meeting were selected based on their expertise
in specifi c areas of relevance to the Think Tank discussions, including clinical epidemiology, health care
policy, and cost-effectiveness analyses. Prior to the meeting, all participants received a package of pre-
planning documents, including a copy of the notes from the planning meeting convened by CRCHD
(Appendix B) and a background paper on economic costs of cancer health disparities prepared by the
CRCHD staff (Appendix C).
The two-day meeting began with introductions and discussions regarding the purpose and rationale behind
convening this Think Tank meeting and the core questions to be discussed and answered. The agenda for
Day 1 of the meeting consisted of six individual presentations followed by group discussion (The agenda
and brief descriptions of the presentations are provided in Appendix D). Additionally, the six individual
presenters participated in a panel discussion, during which both participants and observers asked ques-
tions and discussed the major issues from the day-long session. Day 2 began with a breakout session where
participants were divided into two groups and given the same set of key questions:
What is the total cost of cancer care? ■
What proportion of the total cost of cancer care is related to health disparities? ■
What would be the cost of eliminating cancer health disparities in America? ■
What is the value of reducing cancer health disparities in America? ■
What are the policy implications of reducing cancer health disparities? ■
What is the cost of changing policies? ■
Deliberations and discussions from the breakout session were summarized and followed by fi nal discus-
sions and wrap-up.
1.4
Organization of Report
This report begins with an overview of the determinants of cancer care disparity and a description of the
“cancer care continuum” (Section 2). Section 3 discusses the total cost of cancer care and limitations of
currently available data sources. Section 4 presents the methodological issues related to reducing cancer
health disparities, followed by Section 5, a discussion of the costs and cost-effectiveness of implementing
interventions to reduce cancer health disparities. Finally, Section 6 summarizes the Think Tank’s recom-
mendations for future research and policy initiatives.
Economic Costs of Cancer Health Disparities: Summary of Meeting Proceedings 13
Overview
SECTION 2
2.1
Defi nition of Disparity
There are several different defi nitions of disparities and the conclusions regard-
ing the impact of disparities can differ based on the defi nition used.
2
The NCI’s
defi nition of cancer health disparities is as follows:
“Disparities, or inequalities, occur when members of some population groups do
not enjoy the same health status as other groups.
“Disparities are determined and measured by three health statistics: incidence
(the number of new cancers), mortality (the number of cancer deaths), and sur-
vival rates (length of survival following diagnosis of cancer). Health disparities
occur when one group of people has a higher incidence or mortality rate than
another, or when survival rates are less for one group than another.
3
”
The Minority Health and Health Disparities Act of 2000 provides the following
defi nition of “disparity population”:
“A population is a health disparity population if there is a signifi cant dispar-
ity in the overall rate of disease incidence, prevalence, morbidity, mortality, or
survival rates in the population as compared to the health status of the general
population. In addition, [the defi nition may include] populations for which
14 Economic Costs of Cancer Health Disparities: Summary of Meeting Proceedings
there is a considerable disparity in the quality, outcomes, cost, or use of health care services or access to,
or satisfaction with such services as compared to the general population.”
7
2.2
Determinants of Disparities
Determinants of cancer health disparities are underlying factors that may have an effect on individual
outcome measures. Disparities are most often identifi ed along racial and ethnic lines, i.e., African Ameri-
cans, Hispanics, Native Americans/Alaska Natives, Asian Americans/Pacifi c Islanders, and whites have
different disease rates and survival rates. However, factors contributing to disparities extend beyond race
and ethnicity though.
3
They include factors within the health care delivery system (e.g., access to health
care, insurance coverage, health care network disconnects) as well as factors outside of the system (e.g.,
education, SES, geographic differences).
Factors Within the Health Care Delivery System
Within the health care delivery system, lack of insurance coverage is a major contributor to cancer health
disparities. Furthermore, the stability and quality of insurance coverage is even more important than simply
being insured. The U.S. Census Bureau reports that, in 2005, approximately 16% of the population (46.6
million people) had no health insurance coverage.
5
The percentage of persons without health insurance
was higher in certain racial groups and in groups with lower SES. Of Americans under 65 years of age who
are diagnosed with cancer, 20% of Hispanics, 14% of African Americans, and 10% of whites do not have
health insurance.
8
An Institute of Medicine (IOM) report “Care Without Coverage: Too Little, Too Late, ” found that
uninsured patients with breast, colorectal, or prostate cancer are in poorer health and more likely to die
prematurely than their insured counterparts, primarily due to delayed diagnosis.
9
For example, an uninsured
0
1
2
3
0
1
2
3
Colorectal
Cancer
1.7
2.6
1.4
1.5
1.7
Melanoma Breast
Cancer
Prostate
Cancer
Colorectal
Cancer
Ratio of the Probability of Late vs. Early
Stage Cancer, Uninsured/Insured
Ratio of the Risk of Death,
Uninsured/Insured
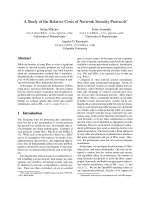
* Privately insured all had commercial indemnity plans. ** Among cancer cases identifi ed in 1994; mortality followup through 1997.
All differences are statistically signifi cant after adjusting for age, sex, race/ethnicity, co-morbidity, marital status (when appropriate), smoking status,
socioeconomic status, education, stage at diagnosis, and treatment.
SOURCES: The Kaiser Commission on Medicaid and the Uninsured, 2003.10
FIGURE 1
Ratio of the Probability of Diagnosis of Cancer at Late Stage,Uninsured
Compared with Insured,* 1994
Economic Costs of Cancer Health Disparities: Summary of Meeting Proceedings 15
woman with breast cancer faces a 30%-50% higher risk of dying compared with her insured counterpart,
and an uninsured person with colorectal cancer has a 50% greater chance of dying compared with someone
who has private insurance.
9
This fi nding is also true for other cancers, as shown in Figure 1.
Over time, high rates of persons without insurance coverage lead to unstable connections to care, disrup-
tions in care, and greater costs.
Lack of adequate insurance coverage limits access to care, partially due to
cost-related issues
12
and partially due to the lack of a primary care provider.
13
Finally, even in persons with
low incomes who are insured, cost-sharing and out-of-pocket expenses compromise receipt of effective
medical care.
11
Factors such as availability of appropriate providers and services at an affordable cost and access to appro-
priate referral services are important to receiving high quality health care and, if compromised, can con-
tribute to health care disparities. For instance, in rural areas there may be a lack of specialists which can
lead to delays in diagnosis of cancer and treatment, or language barriers can result in non-English speakers
not seeking or receiving appropriate care.
9
Disruption of traditional community-based care can also lead to
disparities as providers familiar with individuals in a particular locality may no longer be available.
14
Factors External to the Health Care Delivery System
Factors external to the health care delivery system which contribute to disparities include gender, race,
ethnicity, SES (income, education), and geographic location. According to Freeman (2004)
1
, the three
principal determinants of cancer disparities (Figure 2) are:
Poverty (low SES); ■
Culture; and ■
Social Injustice. ■
Poverty is generally correlated with lack of information, risk-promoting behaviors, and reduced access
to appropriate health care. The percentage of individuals living in poverty is disproportionately high
among African Americans, Hispanics/Latinos, Native Americans, Pacifi c Islanders, and Native Hawaiians
compared with white Americans. The poor are at greater risk of being diagnosed and treated for cancer
at late stages of disease and are less likely to survive a diagnosis of cancer. Among the three main deter-
minants, poverty contributes to health disparities more than the other two factors.
1
A study of colorectal
cancer screening among Medicare benefi ciaries concluded that much of the disparities in screening rates
can be explained by differences in socioeconomic status. Disparities in socioeconomic status decreased but
remained signifi cant even after adjustment for personal and health system factors.
15
Causes of Health Disparities
Prevention Early
Detection
Diagnosis/
Incidence
Treatment Post Treatment/
Quality of Life
Survival
and Mortality
Poverty/Low
Economic Status
Culture
Social Injustice
Causes of Cancer Health Disparities
FIGURE 2
SOURCE: Freeman, Adapted from
Cancer Epidemiology Biomarkers & Prevention
, April 2003.
16 Economic Costs of Cancer Health Disparities: Summary of Meeting Proceedings
All Races Non-Hispanic
White
Black
Percent of County Population Below Poverty Level in 1999
< 10%
10%-19.99%
20%
Race
Average Annual Age-Adjusted Death Rate per 100,000 Population
American
Indian
Asian/Pacific
Islander
Hispanic
0
2
4
6
8
2.3
3.1
4.2
2.1
2.7
3.1
4.5
6.0
6.6
2.0
2.5
4.2
2.5
3.3
3.2
2.7
3.6
4.8
FIGURE 3
U.S. Cervical Cancer Mortality by Race and Poverty Level, 1996-2000
SOURCE: Singh et al., 2004.
16
A recent report published by CRCHD on cervical cancer (2005) and research by Singh and colleagues
16
highlights the correlation of SES and disparities in the incidence and mortality of cervical cancer at the
county-level in the United States. The study found substantial inequalities in both the incidence and
mortality of cervical cancer, with rates of disparities becoming higher with increasing poverty and decreas-
ing education levels. Patients living in lower SES census tracts were also signifi cantly more likely to be
diagnosed at late stages of the disease and were less likely to survive. Figure 3 highlights these disparities.
Although poverty is considered a primary determinant of cancer health disparities, much of the statis-
tics on disparity are also related to racial differences. Race itself does play a role in determining cancer
disparities.
17, 18
A recent IOM report (2002) found that racial and ethnic disparities in health care exist in
the context of broader-scale social and economic inequalities. The report concluded that these disparities
persist even after controlling for SES (i.e. income and education). Selected statistics from the NCI and
the National Center for Health Statistics (NCHS) indicate several racial disparities.
19
African Americans have the highest cancer incidence and cancer-related death rates overall; ■
African American males have the highest incidence and mortality rates for colon, prostate, and lung ■
cancers;
While Caucasian American females have the highest incidence of breast cancer, African American ■
females have the highest death rates for breast cancer;
Economic Costs of Cancer Health Disparities: Summary of Meeting Proceedings 17
FIGURE 4
Critical Disconnect Between Research/Discovery and Delivery of Care
Critical Disconnect
Discovery Development Delivery
SOURCE: Freeman, 2000.
6
SOURCE: Zapka et al., 2003.
20
Failure in
Access to
Care
Failure to
Screen
Failure
During
Follow up of
Abnormal
Results
Failure During
Follow up of
Diagnostic/
Treatment
Plan
Failure to
Follow up
Surveillance
Plan
Failure to
Access
Care
Risk Assessment
Primary Prevention
Diagnosis
Treatment
Recurrence Surveillance
End-of-Life Care
Failure to
Identify Need
to Screen or
Counsel
Primary
Prevention
Failure
Failure in
Detection
Failure during
Diagnostic
Evaluation
Failure of
Treatment
Failure in
Surveillance
Failure in
Surveillance
Potential Failures During Process of Care
➔
➔
➔
➔
➔
➔
➔
➔
➔ ➔ ➔ ➔
➔
Screening/Detection
FIGURE 5
Cancer Care Continuum
➔
18 Economic Costs of Cancer Health Disparities: Summary of Meeting Proceedings
Hispanic/Latina females have the highest incidence rates among all racial groups for cervical ■
cancer, and Vietnamese females [a subset of Asian-Pacifi c Islanders] have the highest mortality
rates among all racial groups for cervical cancer; and,
Asian/Pacifi c Islanders have the highest incidence rates of liver and stomach cancers for both sexes. ■
2.3
Screening, Diagnosis, and Treatment Disparities:
The Cancer Care Continuum
Freeman has hypothesized that there is a critical disconnect between cancer research discovery/develop-
ment and the delivery of care to cancer patients
6
as illustrated in Figure 4.
Even for those who have access to care, the Cancer Care Continuum (Figure 5) illustrates that dispari-
ties in cancer care can occur at any stage of screening, diagnosis, or treatment. In the continuum from
risk assessment through end-of-life care, a patient can fail to receive adequate care during any or all
steps of the process. For example, a patient may not be screened appropriately, may not receive adequate
treatment, may not be able to access end-of-life care, or may experience all three as well as other failures
during the process.
Economic Costs of Cancer Health Disparities: Summary of Meeting Proceedings 19
Total Cost of Cancer Care
SECTION 3
otential critical disconnects in the cancer care continuum may result in
additional costs to both the health care system in terms of potentially
higher costs of treating late-stage cancers and to society as a whole due to
premature mortality. Several presentations and numerous discussions were held
during the Think Tank meeting to better understand the costs related to cancer
care and the challenges of measuring these cost impacts. In this section, the key
themes from these presentations and discussions are summarized. The section begins
with a background on the cost domains, followed by a summary of the overall cost
associated with cancer care, and fi nally an in-depth discussion of the challenges of
measuring the costs related to cancer health disparities.
P
20 Economic Costs of Cancer Health Disparities: Summary of Meeting Proceedings
3.1
Overview of Cost Domains
Economic costs of cancer include all resources required and used to provide a service—and the value of
foregone opportunities to use these resources for a different service. The economic costs of cancer care
and control include a wide range of factors: expenditures for cancer health care services; costs associated
with time and effort spent by patients and their families and by cancer treatment providers; and costs
associated with lost productivity due to cancer-related disability and premature death. Disparities in
cancer care may increase the costs for individuals, families, employers, governments, and society.
Health care costs can be divided into direct, indirect, and intangible costs.
Direct costs
■ are related to expenditures for goods, services, and other resources used in the direct pro-
vision of a service. Both direct medical (e.g., cost of medications) and direct non-medical (e.g., paid
child care) costs are categorized as direct costs.
Specifi c Cost Elements Required for Measuring
Total Cost of Cancer Care
TABLE 1
Core Direct Costs:
Screening ■
Hospitalization ■
Outpatient clinical care ■
Physician visits ■
Rehabilitation/ home health care ■
Prescription and non-prescription drugs ■
Medical devices (walkers, wheel chairs, etc.) ■
Nursing home/long-term care ■
Hospice care ■
Other Direct Costs:
Transportation to health care providers ■
Child care related to obtaining health care services ■
Special diets ■
Lodging for remote treatment facilities ■
Core Indirect Costs (impact on patient):
Reduced productivity ■
Job loss/Shift to lower-wage employment ■
Loss of promotion opportunities ■
Lost wages due to premature death ■
Other Related Indirect Costs (impact on family/friends):
Time lost from work and housekeeping by family members ■
or friends
Loss of volunteers/caregivers to the community ■
Intangible Costs:
Pain and suffering ■
Bereavement ■
Psycho-social impairment ■
Familial health ■
SOURCE: Gold et al., 1996
23
and Fryback et al., 2004.
24
Economic Costs of Cancer Health Disparities: Summary of Meeting Proceedings 21
Indirect costs ■ are generally resources related to days lost from work (i.e., loss of productivity). Medical
or health-related indirect costs are generally broken down into morbidity (e.g., lost productivity due
to work disability) and mortality (e.g., lost productivity due to premature death).
Intangible costs ■ are those related to adverse health effects for which there are no market prices (e.g.,
reduction in quality of life due to physical pain, emotional problems, and lifestyle changes). A reduc-
tion of intangible costs does not free up resources that could be used to produce other goods and
services. This makes it diffi cult to estimate the impact of these costs, which can also extend beyond
the patient to relatives who experience grief, bitterness, or depression.
21,22
Understandably, economic studies often focus only on direct and indirect costs due to the diffi culty in
assessing intangible costs. In presenting direct and indirect costs, an additional distinction is often made
in economic studies between costs primarily within the health care system (core costs) and costs outside
of the health system (non-core costs). The costs used in assessing the cost of cancer are shown in Table 1.
3.2
Overall Cost of Cancer Care
Costs related to cancer care contribute signifi cantly to the overall health care costs in the United States.
Hence, reliable and timely estimation of cancer-specifi c costs can help to assess the following:
25
Overall economic burden of cancer morbidity and mortality; ■
Magnitude of economic resources needed to effectively care for patients with cancer; ■
Cost-effectiveness of cancer prevention, screening, and treatment policies and programs; and, ■
Societal benefi t/cost return on investment from cancer research and control. ■
One approach to measuring the economic costs associated with cancer care is to measure the Cost of
Illness (COI) associated with cancer. COI is an evaluative approach that considers the treatment-related
economic costs as well as the economic value associated with loss of health and life.
26
COI estimates
SOURCE: Brown et al., 2002.
25
Cancer Care Costs by Stage at Diagnosis
FIGURE 6
Treatment Cost and Survival: Breast Cancer
22 Economic Costs of Cancer Health Disparities: Summary of Meeting Proceedings
generally consist of direct costs, morbidity costs, and mortality costs. The estimate of total cost of cancer
in the year 2005 is $209.9 billion: $74.0 billion in direct costs, $17.5 billion in morbidity costs, and $118.4
billion in mortality costs.
27
Several studies on cancer care have reported on the direct health care costs and patient time and employ-
ment costs. The fi ndings from these studies are reported in the sections below.
Direct Health Care Costs
Distribution of Cancer Care Costs
Using data from SEER-Medicare,
Brown and colleagues
25
generated
estimates of total Medicare payments
for Medicare enrollees following a
cancer diagnosis, as well as estimates
of cancer-specifi c payments by cancer
site, stage at diagnosis, and type of
treatment. Examination of the distribu-
tion of breast cancer care costs (See
Figure 6) revealed that cost curves
were U-shaped, with the two vertical
segments of the U (i.e., high costs)
representing initial and terminal phase
costs (costs occurring around the time
of diagnosis and at the time of death),
and the bottom of the U (lower costs)
representing continuing care costs
(costs occurring during the periods in
between diagnosis and death).
Cancer Care Costs by Stage
and Diagnosis
A confounding variable in estimating
cancer care costs is the stage at diagno-
sis. Overall, costs are generally highest
for Stages II and III and lower for
in situ, Stage I, and Stage IV.
25
For
example (See Table 2), an analysis of
cancer-related total Medicare payments
(includes only those 65 years and older)
for up to 25 years after the date of
diagnosis for colon cancer reveals that
the long-term costs for Stage II are
higher ($34,400) compared with long-
term costs for Stage IV ($29,400).
28
While initial cancer care costs are
higher for patients with Stage IV
diagnoses, long-term costs are higher
for patients with Stage II diagnoses
due to the additional continuing care
costs that accumulate over the longer
average survival period.
25
Cancer-Related Treatment Cost of Colorectal Cancer
TABLE 2
Stage Without Unrelated Costs
In Situ $28,000
Stage 1 32,700
Stage 2 34,400
Stage 3 41,600
Stage 4 29,400
SOURCE: Etzioni, Ramsey, et al., 2001.
Estimates of Direct Costs for Cancer Based
on SEER Medicare Data, 1996
TABLE 3
Cancer Site Direct Costs ($ billions)
All sites 42.39
Female breast 5.98
Colorectal 5.71
Prostate 4.61
Lung and bronchus 4.68
SOURCE: Brown et al., 2001.
26
Time Costs Related to Colorectal Cancer Treatment:
Difference in Cost for Cases Versus Controls (Net Costs)
TABLE 4
Phase of Care Patient
Time Costs
Direct
Medical Costs
Patient Time
as % of Direct
Medical Costs
Initial
(average)
$4,592 $23,743 19.3%
Continuing
(per month)
25 158 15.8
Terminal
(average)
2,788 7,577 36.8
Net Costs
SOURCE: Yabroff et. al. (2005).
32
Economic Costs of Cancer Health Disparities: Summary of Meeting Proceedings 23
Cancer Care Costs by Type of Cancer
Costs of cancer care not only differ based on stage of disease, but also by type of cancer. For example, the
1996 cost estimates by Brown et al. presented in Table 3 show that 50% of the direct medical costs for
cancer care for Medicare patients are associated with four types of cancers.
Medicare Expenditures versus National Expenditures for Cancer Care
A comparison of Medicare expenditures for cancer care versus national expenditures for cancer care
(1996 data) showed remarkable agreement in terms of both overall magnitude and expenditure compo-
nents by gender.
25
When expenditures based on the 13 most common cancer types were compared, breast,
colon, prostate, and lung were consistently the top four highest-cost cancers.
Cost of Cancer Patients Compared with Controls
Several studies have compared the cost of care for patients diagnosed with cancer to that for controls
without cancer, and consistently found that care for patients with cancer has higher direct costs. In a
recent case-control study, the overall average direct health care cost for patients with cancer was esti-
mated at $32,629, compared with $3,218 for controls without cancer, showing a signifi cant difference
in cost.
29
A study of female employees aged 50-64 diagnosed with breast cancer reported the average
annual direct cost associated with breast cancer to be $13,925 compared to $2,951 for a random sample of
female employees.
30
An analysis of the SEER-Medicare database estimated the lifetime cost for long-term
colorectal cancer survivors (at least 5 years) were $19,516 higher than costs for controls without cancer.
31
Time Costs
Time costs represent the value of the time patients and family members spend on activities related to
the patients’ cancer screening and treatment—time that could be spent engaged in other activities.
Since time costs are not generally measured by traditional health care accounting systems, it is diffi cult
to place a value on time costs. Table 4 presents patient time costs for colorectal cancer expressed in
terms of wages lost. As seen from the table, time costs can add signifi cantly to the total costs of cancer
care. The initial phase was the fi rst 6 months after diagnosis, the terminal phase was the fi nal 12 months
before death.
Employment Costs
A diagnosis of cancer may infl uence both an employee and an employer’s decisions regarding employment
status and the number of hours worked. Furthermore, a decision to discontinue employment following a
diagnosis of cancer has economic effects for the patient, his or her family, and society.
33–35
Analysis of the 1992 National Health Interview Survey
36
revealed that nearly one fi fth (18.2%) of the
cancer survivors who worked before or after their cancer diagnosis experienced employment problems
because of their cancer. These included on-the-job problems from an employer or supervisor, the inability
to change employers, and loss of their job because of cancer. Another study reported that 13% of all adult
survivors of a variety of cancers had quit working for disease-related reasons within 4 years of diagnosis.
37
The disability and work loss experienced by cancer survivors may ameliorate over time. A study of breast,
colon, lung, and prostate cancer survivors 35 to 75 years found that, 5 to 7 years after diagnosis, of those
who were working at the time of their initial diagnosis, 67% remained employed and that there was no
negative impact of survivor’s decision to retire or the quality of the retirement experience.
38
The ability
to return to work may depend on the type of cancer: for example, patients with central nervous system,
head and neck, or Stage IV blood and lymph malignancies are more likely to experience adverse employ-
ment outcomes.
37
A study on the impacts of Hodgkin’s and non-Hodgkin’s lymphoma on work initiation
after cancer treatment found that only 54% of patients in remission who were able to work returned
to work.
39
Overall, cancer does have a signifi cant impact on ability to work. Kessler and colleagues
40
analyzed a nationally representative telephone-mail survey and found that cancer was associated with the
highest reported prevalence of any impairment (66.2%) and the highest number of impairment days in
24 Economic Costs of Cancer Health Disparities: Summary of Meeting Proceedings
the past 30 days (16.4 days) compared to other chronic medical conditions such as major depression and
heart disease.
The work impacts specifi cally attributable to breast cancer have been examined in a large number of
studies. A recent study by Bradley and colleagues
41
examined the effect of breast cancer on women’s labor
supply and found that:
Compared to women who had never had the disease, survivors of breast cancer had a 10% lower ■
probability of being employed; and,
Breast cancer may force a woman to give up her employment, which may lead to economic hardship ■
for the patient and her family. In some cases, women undergoing breast cancer treatment continue to
work despite the negative consequences on their health because of the need to retain health insur-
ance coverage through their employer.
A notable fi nding in the study was that, among employed women, those with breast cancer may work
more hours per week compared with women without the disease. The authors hypothesize that survivors
and their families may be attempting to restore funds spent during the illness or else survivors approach
their work with renewed vigor. Other studies on breast cancer survivors also support the fi ndings in this
study that survivors who were working at the time of their diagnosis experienced negative impacts.
42–45
A
study by Stewart and colleagues
45
found that over 40% of breast cancer survivors reported that cancer had
affected their work. In addition, breast cancer survivors were more likely to be functionally impaired even
5 years after breast cancer diagnosis and this, in turn, resulted in reduced work effort over the long-term.
Overall, breast cancer survivors had signifi cantly larger reductions in annual market earnings than work-
ing controls about 5 years after diagnosis. Furthermore, Chirikos and colleagues
44
found that this reduc-
tion in earnings mainly resulted from reduced work effort and not change in pay rate.
This work loss or reduction in work hours related to cancer is a signifi cant indirect cost. Sasser and col-
leagues
30
analyzed disability claims from 7 large employers from 1998 through 2000 for females 50–64
years with breast cancer diagnosis and found that the average annual indirect costs associated with breast
cancer was $8,236. Another study found that among insured women with breast cancer, the out-of-pocket
expenditure and lost wages averaged $1,455 per month and represented a signifi cant fi nancial burden.
46
The employment-related cost of cancer is a very complex fi eld, in which several interacting factors may
infl uence a survivor’s decisions to work and thus his/her overall productivity. While there is some pub-
lished evidence available in this area, the employment costs of cancer needs to explored further. Further
research is needed to identify key factors that guide work decisions and the range of adaptations neces-
sary to reach the desired level of economic productivity.
47
No research to date has focused on the work
impacts associated with populations who experience health disparities in cancer care.
3.3
Data Limitations
In order to correctly measure the economic burden of a disease, adequate incidence and mortality data
must be available. In addition, reliable and timely data must be available at the level of cancer site, stage
at diagnosis, and type of treatments.
25
Currently, there is no reliable data source to systematically esti-
mate patient-level or population-level costs of cancer health disparities. There are several limitations to
performing cancer economic assessments based on data currently available.
1. Lack of recent data on cancer outcomes linked with resource use. The SEER-Medicare data is the only
national linked cancer registry and administrative claims data source and provides a valuable source to
perform economic assessments of cancer burden and treatments. Unfortunately, the latest year of data
for cancer incidence is 2002 with Medicare claims available for this cohort till 2003. Therefore, at best,
the data available for analysis is 4 years old. Given the rapid changes in cancer screening, diagnosis,
and treatment, the availability of more current data would provide better estimates.
Economic Costs of Cancer Health Disparities: Summary of Meeting Proceedings 25
2. No comprehensive national data on cancer epidemiology and outcomes. The most reliable data on
diagnosis, treatment, and survival comes from the SEER cancer registries. However, the availability
of high-quality SEER data is limited to approximately 26% of the U.S. population, residing in areas
with SEER registries. The NCI and Centers for Disease Control and Prevention (CDC) are work-
ing cooperatively through the CDC’s National Program of Cancer Registries (NPCR) to improve the
collection of high-quality data and coordination between the two registry programs. Potentially, these
collaborations could result in more universal data systems to assess cancer outcomes and costs.
3. Small sample sizes for studying minority populations. In general, only a small sample of the non-white
population is available for analysis, leading to unstable estimates for minority groups (for example
cervical cancer mortality rates among Vietnamese). The SEER cancer registry program has been
expanded recently to cover more of the racial, ethnic, and socioeconomic diversity of the country,
allowing for the better description and tracking of trends in health disparities.
25
This could allow for
better representation of minority groups in future data.
4. Limited data on individuals younger than 65 years. The data systems available to assess the quality
of care on a national or regional basis are fragmented,
48
particularly for those under 65 years of age.
Refl ecting the U.S. health care system, data for those under 65 years are limited by payer source,
and longitudinal analysis is often not possible because of limited enrollment periods with a specifi c
provider. Therefore, unlike SEER-Medicare data, which is largely limited to those 65 years and older,
there is no national linked cancer registry and administrative data to perform long-term assessments of
health care resource use for those under 65 years. In performing economic assessments, outcomes data
are limited in use unless supplemented with utilization and expenditure data.
49
In addition, given the
importance of cancer stage, data sources not linked to clinical endpoints [for example, the Healthcare
Cost and Utilization Project (HCUP)50] are of limited use.
5. Lack of standardization in collecting non-medical resource use and cost data. There is a great need
to better quantify the resources expended by patients, families, and caregivers outside of the health
care system.
24
In fact, recent estimates have shown that indirect costs associated with cancer are
higher than direct costs,
51
therefore data sources that accurately quantify these costs are required.
6. No national standards for race/ethnicity categories despite OMB Directive 15 which provides guide-
lines for racial and ethnic categories in the United States. Federal, state, and private institutions do
not coordinate in their attempts to code race, which makes it diffi cult for compare between these data
sources. Race is often self-reported and therefore the reliability of the data available is questionable.
In some cases (e.g. 2000 Census), mixed race individuals only select a category to indicate “more than
one race” and do not provide any details on race which signifi cantly limits the information available for
analysis. In addition, most private payer administrative data sources do not include race as a category.
52
7. Limited information on costs related to cancer care. A thorough assessment of a wide variety of costs
is required to generate a reliable total cost of providing cancer care and to estimate the cost associ-
ated with cancer health disparities. Currently, we do have reliable data to estimate hospital costs for
uninsured patients (uncompensated care costs), but not for estimating out-of-pocket payments made
by patients, indirect costs incurred by patients, family members, and the community as a whole.
26 Economic Costs of Cancer Health Disparities: Summary of Meeting Proceedings
SECTION 4
learly, the reduction or elimination of disparities and improvement in
cancer care outcomes would have signifi cant benefi ts for patients, the
community, and society as a whole. In this section, a synthesis of the
Think Tank discussions on approaches to measure the economic benefi ts of
reducing cancer health disparities and potential challenges are presented.
C
Economic Benefi ts of Reducing
Cancer Health Disparities