Hardiness in learning and study outcomes of business students
Bạn đang xem bản rút gọn của tài liệu. Xem và tải ngay bản đầy đủ của tài liệu tại đây (498.82 KB, 23 trang )
Nguyen Dinh Tho
|1
Hardiness in learning and study
outcomes of business students
NGUYEN DINH THO
UEH International School of Business –
Abstract
Realizing the role that hardiness in learning plays in the study
outcomes of business students, this study investigates the impact of
hardiness in learning of business students, overall as well as its
individual components, on their study outcomes, including quality of
college life, quality of life, and learning performance. The study also
explores the degrees of necessity of the components of hardiness in
learning (commitment, control and challenge) for the occurrence of
study outcomes. The results, based on a data set collected from a
sample of 722 business students in various universities in Ho Chi
Minh City, reveal that overall hardiness in learning has a positive
effect on study outcomes. In terms of individual components,
commitment, control and challenge have a positive impact on
learning performance, however, control does not affect quality of
college life and challenge has no effect on quality of life. In addition,
these components have different degrees of necessity for the
occurrence of study outcomes. These findings, generally, suggest
that universities could enhance the outcomes of business students by
offering programs that are able to cultivate students’ hardiness in
learning. However, attention should be paid to the degree of necessity
of each individual components, i.e., commitment, control and
challenge, in order to achieve a desired level of study outcomes.
Keywords: hardiness in learning; quality of college life; quality of
life; learning performance; business students.
1. Background
Stress can generate psychological problems and can affect peoples’
effectiveness at working and studying. To overcome challenges
introduced by stress, people need to be psychologically hardy.
Hardiness is a concept used to describe people’s commitment, control,
and challenge in their lives (Britt, Adler, & Barton, 2001; Fyhn, Fjell,
& Johnsen, 2016; Kobasa, 1979; Maddi, 2002). Commitment refers to
a “tendency to involve oneself in (rather than experience alienation
from) whatever one is doing or encounters”. Control is defined as a
“tendency to feel and act as if one is influential (rather than helpless)
in the face of the varied contingencies of
life”. Challenge is described as a “belief that change rather than
stability is normal in life and that the anticipation of changes are
interesting incentives to growth rather than threats to security”
(Kobasa, Maddi, & Kahn, 1982, 169).
Research shows that hardiness assists people in enhancing their
health and performance when coping with stressful conditions (e.g.,
Maddi, 1999; Stoppelbein, McRae, & Greening, 2017). Highly hardy
attitudes also help people to convert stressful events into common
problems to be solved (Bartone, Valdes, & Sandvik, 2016; Bartone, Eid,
Johnsen, Laberg, & Snook, 2009; Maddi, 1999; Sezgin, 2009) or
opportunities for growth and development (Kobasa & Puccetti, 1983),
thus improving performance and quality of life (Alfred, Hammer, &
Good, 2014; Bartone et al., 2009; Johnsen, Espevik, Saus, Sanden,
Olsen, & Hystad, 2017; Kelly, Matthews, & Bartone, 2014; Wiebe &
McCallum, 1986). In education, a number of studies have also
investigated the role of hardiness in students’ attitudes and
behaviour. For example, Abdollahi, Talib, Yaacob, and Ismail (2015)
and Abdollahi, Talib, Carlbring, Harvey, Yaacob, & Ismail (2016) find
that hardiness helps prevent stress and suicidal ideation among
undergraduate students and moderates the relationships between
problem-solving skills and perceived stress. However, the role of
hardiness in key study outcomes such as quality of college life and
quality life and learning performance is still under-investigated.
1.1.
Quality of college life and quality of life
Quality of college life and quality of life are concepts that have
received attention from researchers in the past several years (e.g.,
Arslan & Akkas, 2014; Cummins, 2010; Sirgy, Grzeskowiak, & Rahtz,
2007). Quality of life can be defined in terms of overall life satisfaction
(e.g., Vaez et al., 2004) or it can focus on particular aspects of life. And,
quality of college life is defined as students’ satisfaction with their
educational experience during the time they study and live at
university (Sirgy et al., 2007). A number of studies explore the factors
affecting quality of college life and quality of life in the developed
world. For example, Vaez et al. (2004) examine the relationship
between health status and quality of college life and discover that the
quality of college life for university students is lower than that of their
working peers. Research conducted by Cha (2003) indicates that there
is a positive relationship between quality of college life and personal
factors such as optimism, self-esteem, etc. Chow (2005) showed that
socio-economic status, experience in learning, living conditions, and
other factors have positive relationships with students’ well-being.
1.2.
Hardiness in learning and study outcomes of
business students
The literature on education indicates that study at university is one
of many causes of stress (e.g., Cole, Field, & Harris, 2004; Furr,
Westefeld, McConnell, & Jenkins, 2001). When studying at university,
students not only have to focus on completing educational activities
such as
readings, assignments, projects, and examinations, but they also
have to manage personal matters such as finances, part time jobs,
and social activities. Hardiness in learning plays an important role in
the learning process. Students with high levels of hardiness in learning
will spend their time and effort in studying. They feel and act as if they
are influential and welcome changes occurring during their lives at
university. During their university lives, students often experience
stressful circumstances. Students with high hardiness in learning will
be able to control stress in their learning process. This capability helps
them transform the stress caused by learning into more fun or
enjoyable university lives, developing and maintaining their
motivation to do what they need to do. When students have capabilities
to overcome the pressure of learning in class, they will acknowledge
the role of their professors and classmates in learning, leading to a
high level of satisfaction with their learning at university, that is, their
quality of college life is increased.
During their years at university students are called upon to
develop their cognitive and creative abilities; they develop
knowledge and skills that will admit them to their chosen
professions. Given the high stakes involved, this experience can be
very stressful. The theory of hardiness (e.g., Maddi, 2002) posits that
people
who
possess
hardiness
find
stressful
challenges
“developmentally provocative” and tend to respond to such challenges
as opportunities. They also enjoy higher levels of health and life
satisfaction. Applying this argument to business students, this study
expects those who exhibit a higher level of hardiness in learning will
enjoy a high quality of college life, quality of life and learning
performance. In conclusion, hardiness plays an important role in the
outcomes of individuals’ work and life such as mitigating stress,
enhancing their quality of work and life as well as performance
effectiveness. However, the following questions have not been
thoroughly answered and this study is undertaken with the aim of
answering these two questions in a context of a transitioning economy,
Vietnam.
Does hardiness in learning, conceptualized as a multidimensional
construct (comprising commitment, control and challenge) enhance
the study outcomes (including quality of college life, quality of life and
learning performance) of business students?
What level of commitment, control and challenge should business
students reach in order to achieve their desired level of quality of
college life, quality of life and learning performance?
2. Method
2.1. Research context
The continuing economic transformation of the Vietnamese
economy from a centrally- planned economy into a market-oriented
economy and accession to the World Trade Organization have created
several opportunities such as new markets for goods and services
210 |
ICUEH2017
exports, access to imported raw materials and technologies, and more
opportunities for international business co-operation. Together with
opportunities, a more open market however leads to more challenges
to Vietnamese firms. They have to face with vigorous competition and
the imposition of stricter business standards such as product quality
and safety (Nguyen, Shultz,
& Westbrook, 2012). Among several challenges, lack of knowledge
about business management is perhaps one of the most pressing for
Vietnamese firms. Thus, providing qualified business graduates for
the Vietnamese labor market a crucial role of Vietnamese
universities. Understanding the labor market’s need for competent
graduates, Vietnamese universities are striving to improve the quality
of their business education programs, putting more pressure on
Vietnamese students because they are now have to complete more
assignments and examinations and their performance standards are
rising.
Raising objective standards is important for improving educational
outcomes, at the student side, however, the educational outcomes
are reached when students’ outcomes, including students’ quality of
college life, quality of life and learning performance, are enhanced. For
that
reason, Vietnamese universities, with new performance
standards, should comprehend what contributes to their students’
outcomes. Consequently, Vietnamese is an appropriate country for the
study of the role of hardiness in learning in quality of college life,
quality of life and learning performance of business students.
2.2.
Procedure and sample
Research on the role of hardiness in learning in quality of college
life, quality of life and learning performance focuses solely on the net
effects using conventional statistical tools such as multiple regression
analysis or structural equation modelling (SEM). Such traditional
statistical approaches however do not help researchers to discover
the causal complexity of business phenomena (Ragin, 2008). The aim
of this study was not only investigate the net effect of hardiness in
learning, overall and its individual components, but also the level of
necessity of each component for students’ outcomes, comprising
students’ quality of college life, quality of life and learning
performance. To reach this aim, this study first used SEM to test the net
effect of hardiness in learning, overall and its components, on quality
of college life, quality of life and learning performance. Then, the study,
employing the necessary condition analysis (NCA; Dull, 2016a),
investigates the levels of necessity of three components of hardiness
in learning (i.e., commitment, control and challenge) for students’
quality of college life, quality of life, and learning performance.
A sample of 722 business students in various universities in Ho Chi
Minh City, the principal business centre of Vietnam, was surveyed to
collect the data used to validate the measures and to test the
hypotheses. The universities surveyed included University of Economics
Nguyen Dinh
Ho Chi Minh City, Ho Chi Minh City University of Technology,
Tho | 7Nong Lam
University, Saigon University, Huflit
University, Banking University Ho Chi Minh City, Hoa Sen University,
University of Finance – Marketing. Face-to-face interviews was
employed in this study. The sample included 373 (51.7%) students
in the first two years and 349 (48.3%) students in the second two
years. In terms of gender, there were 479 (63.3%) female students and
343 (33.7%) male students.
2.3.
Measures
There was four constructs under investigation: Hardiness in learning,
quality of college life, quality of life and learning performance.
Hardiness in learning was a multidimensional construct composed of
three components: commitment, control, and challenge. Each
component of hardiness in learning was also measured by three items
adopted from Bartone, Ursano, Wright, and Ingraham (1989). Note that
this study examines hardiness in learning of business students, that is,
in a specific context, not general hardiness. The scale measuring
hardiness therefore was modified to suit the research context.
Quality of college life was measured by four items, borrowed
from Sirgy et al. (2007). These four items reflect students’ overall
perception of their quality of college life when studying at their
universities. Note that,
quality of
college
life could
be
conceptualized as a multidimensional construct composed of various
components such as students’ satisfaction with the faculty, facilities,
student services, relationships with classmates, and extracurricular
activities, this study focused on the overall measure of quality of
college life (Nguyen et al., 2012; Sirgy et al., 2007). Quality of life was
measured by four items borrowed from Peterson and Ekici (2007).
Finally, learning performance was measured by four items reflecting
students’ self assessment of their overall knowledge, skills and abilities
obtained in their university. This scale was based upon Young, Klemz,
and Murphy (2003), and was modified and tested with Vietnamese
business students by Nguyen and Nguyen (2010).
All items were measured by a five-point Likert scale anchored by 1:
strongly disagree and 5: strongly agree. The questionnaire was
originally prepared in English and was translated into Vietnamese by
an academic fluent in both languages. Back-translation was conducted
to ensure the meanings. This procedure was undertaken because
English is not well understood by all Vietnamese students. Note that
the items were randomly assign into the questionnaire with an aim of
mitigating the agreement tendency bias. Note also that the
questionnaire were piloted by a group of eight business students at
the University of Economics Ho Chi Minh City to ensure the clarity of
the item meaning.
212 |
ICUEH2017
3. Results
3.1.
Measure validation
Confirmatory factor analysis (CFA) was used to validate the measure.
The study first tested the scale measuring hardiness in learning (a
second-order construct) and then, incorporated this scale into the
measures of quality of college life, quality of life and learning
performance (first-order constructs) to form the final measurement
model (saturated model). The screening process showed that although
the data exhibited slight deviations from normality, all univariate
kurtoses and skewnesses were in the acceptable range of [-1, 1].
The maximum likelihood estimation method therefore was used to
estimate the parameters in the measurement and structural models
(Muthen & Kaplan, 1985).
The CFA results indicate that the measurement model of
hardiness in learning received
a good fit to the [24 = 70.79 (p = 0.000), GFI = 0.979, CFI = 0.951, and
]
data: 2
RMSEA = 0.052.
In addition, all factor loadings were sufficient and significant (≥
0.50, p < 0.001). Next, the CFA results of one-factor model reveal that
the one-factor model received a poorer fit compared to the threefactor model: 2[27] = 170.35 (p = 0.000), GFI = 0.947, CFI = 0.850,
and RMSEA =
0.086. A Chi-square differential test also shows a significant difference
between the two models
leading to the choice of the three-factor model [27of = 99.56 (p <
24]
2
hardiness: ∆
0.001); GFI
= 0.979; CFI = 0.951; and RMSEA = 0.052. The final measurement
model also produced an
acceptable fit to the[17 = 419.71 (p = 0.000); GFI = 0.947; CFI = 0.942;
8]
data: 2
and RMSEA =
0.043. The factor loadings of all items were also substantial and
significant (≥ 0.50, p < 0.001). Finally, the correlation between any
pair of constructs was smaller than the square root of the average
variance extracted of each construct in the pair, supporting
discriminant validity across constructs (Fornell & Larcker 1981).
3.2. Common method bias
This study used a cross-sectional data set collected from a single
respondent (i.e., business students) which may raise the possibility of
common method biases (Podsakoff, MacKenzie, Lee,
& Podsakoff, 2003). Note that, in the design phase, the items
measuring the constructs in the model were randomly assigned to
the questionnaire with an aim of lessening such biases. In this
analysis phase, two statistical procedures were undertaken to assess
this possibility. First, a CFA Harman’s single factor model test was
Nguyen Dinh
employed. The CFA one-factor model received a very
Tho |poor
213 fit to
2
data [ (184) = 1511.88 (p = 0.000), GFI = 0.800, CFI = 0.684, and
RMSEA = 0.100],
compared to the trait factor [17 = 419.71 (p = 0.000); GFI = 0.947; CFI
8]
model [2
= 0.942; and
RMSEA = 0.043]. Next, an unmeasured latent variable that was
allowed to load on each item into the trait model was investigated.
The results indicate that the size and statistical significance
of the loadings were almost identical to those reported in the
measurement model. In addition, all loadings of the items on the
unmeasured latent variable were not significant. The results indicate
that the common method variance, if existed, was not a pervasive
problem in this study.
3.3. Structural model: Testing the net effect of
hardiness in learning on quality college life,
quality of life and learning performance
The SEM results show that the proposed model produced an
acceptable fit to the data:
2[196] = 445.12 (p = 0.000); GFI = 0.946; CFI = 0.941; and, RMSEA =
0.042. Table 1 presents
the estimates of the structural paths proposed in the model. A
closer examination of the structural paths reveals that hardiness in
learning had a significant impact on quality of college life (p < 0.001;
R2 = 30.8%), quality of life (p < 0.001; R2 = 9.2%) and learning
performance (p < 0.001; R2 = 31.6%). Note that the gender of
students served as a control variable and the results show that student
gender did not explain the variances of quality of college life, quality of
life and learning performance.
Table 1
Effects of hardiness in learning on quality college life, quality of
life and learning performance
Structural path
Hardiness in learning Quality
of college life
Hardiness
in learning Quality
of life
Hardiness
in learning Learning
B
SE
β
0.70 0.086 0.56
0.41 0.079 0.30
CR
p
8.10 0.00
0
5.21 0.00
0
0.10 0.56 8.22 0.00
performance
0
Student gender
0.00 0.047
0.00 -0.04 00.97
Control
Student
gender of
Quality
Quality
college life of life 0.05 0.00 -0.07 0.95
0.00
7
Student gender Learning
0.056
-0.07 -1.87 0.06
performance
Note. B: unstandardized estimate; SE: standard error; β: standardized estimate;2 CR:
0.82
critical ratio; p: p- value
When examining the impact of each component of hardiness in
learning separately, the SEM results show that the proposed model
received a poorer fit compared to the model in which hardiness in
learning was a second-order construct, but it was acceptable: 2[176]
= 673.17 (p
= 0.000); GFI = 0.918; CFI = 0.882; and, RMSEA = 0.063. Table 2
presents the estimates of the structural paths proposed in the model. A
closer examination of the structural paths reveals that commitment
and challenge had positive effects on quality of college life (p < 0.001
and p < 0.01, respectively) but control did not (p = 0.653). These
components explained 31.0 percent of the variance of quality of
college life. In terms of quality of life, the results show that
commitment and control had positive impacts on quality of life (p <
0.01 and p < 0.001, respectively; R2 = 7.8%), but challenge did not
(p = 0.095). Finally, all three components of hardiness
(commitment, control and challenge) in learning underlie the learning
performance of business students (p < 0.001, p < 0.05, and p < 0.001,
respectively; R2 = 25.4%).
Table 2
Effects of components of hardiness in learning on quality college
life, quality of life and learning performance
Structural path
Commitment Quality of
college
Control life
Quality of
college
life
Challenge Quality of
college
life
Commitment
Quality of
life
Control Quality of life
Challenge Quality of
life
Commitment Learning
performance
Control
Learning
performance
Challenge
Learning
B
SE
β
CR
p
0.64
0.077
0.54
8.39
0.000
0.03
0.057
0.02
0.45
0.653
0.13
0.049
0.13
2.61
0.009
0.21
0.068
0.16
3.00
0.003
0.26
0.075
0.21
3.44
0.000
0.10
0.059
0.09
1.67
0.095
0.50
0.076
0.37
6.57
0.000
0.16
0.071
0.12
2.20
0.028
0.37
0.068
0.33
5.43
0.000
performance
Note.
B: unstandardized estimate; SE: standard error; β: standardized estimate; CR:
critical ratio; p: p- value
3.4. NCA results: Exploring the degree of necessity
of commitment, control and challenge for
quality college life, quality of life and learning
performance
SEM was used to investigate the net effects of hardiness in learning
(overall as well as its components) on quality college life, quality of
life and learning performance. To discover the levels of necessity of
these conditions, this study utilized NCA. This is an analysis method
that assists researchers in identifying the degree of a necessary (but
not sufficient) condition for an outcome. In order to examine the level
of necessary conditions, NCA determines the ceiling line, the line that
separates the area with observations from the area without
observations (Dul, 2016a). Two common techniques used for
determining the ceiling line are the ceiling envelopment technique (a
piecewise linear line) with free disposal hull (CE-FDH) and the ceiling
regression (a straight line) with free disposal hull (CR-FDH) because
they are more flexible techniques. The NCA results produced by the
NCA package (Dul, 2016b) included the CE-FDH and CR-FDH ceiling
lines and bottleneck tables.
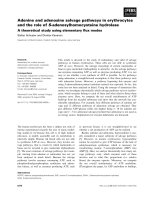
The ceiling lines and bottlenecks, produced by the NCA package,
showing the degrees of necessity of commitment, control and
challenge for quality of college life are presented in Figure 1 and Table
3, respectively. In Table 3, the degrees of all necessary conditions
(commitment, control and challenge) were determined through their
bottlenecks, expressed as percentage of
the range of observed values (0% = lowest value, 100% = highest
value; Dul, 2016b). On closer examination of the bottleneck results
one can see these conditions (commitment, control and challenge)
exhibited different levels of necessity. However, the effect size of two
conditions (commitment and challenge) were small (< 0.1) in both
techniques (CE-FDH and CR-FDH). Only one condition (control) plays a
necessary condition for the outcome (quality of college life). For
example, at the level of 20 percent of quality of college life, it is
necessary that control should at least be 16.7.0%. At this level of
quality of college life, commitment and challenge were not necessary
conditions. Only when quality of college life was at the 60-percent
level, all three conditions (commitment, control and challenge) were
necessary conditions (CE-FDH: commitment = 16.7%, control =
25.0%, and challenge = 8.3%; CR-FDH: commitment = 3.3%, control =
15.0%, and challenge = 2.4%; Table 3).
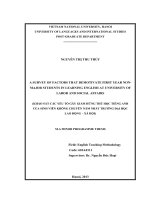
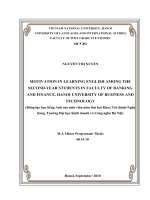
Similarly, Figure 2 and Figure 3 are the ceiling lines presenting the
degrees of necessity of commitment, control and challenge for quality
of life and learning performance, respectively. Table 4 and Table 5 are
the bottlenecks showing the degrees of necessity of commitment,
control and challenge for quality of life and learning performance,
respectively. As in the case of quality of college life, control received
the strongest effect size (dCE-FDH = 0.255; Table 4) in serving as a
necessity condition for the occurrence of quality of life. Commitment,
however, was a necessary condition for the occurrence of learning
performance that received the strongest effect size (dCE- FDH = 0.229;
Table 5).
Figure 1. Ceiling lines of necessary conditions for quality of
college life
NCA Plot : Control QCL
5
QCL
4
4
2
1
2
1
1
1
2
3
Commitment
4
5
OLS
CE-FDH CR-FDH
3
5
NCA Plot : Challenge - QCL
OLS
CE-FDH CR-FDH
3
QCL
3
2
QCL
4
5
NCA Plot : Commitment QCL
OLS
CE-FDH CR-FDH
1
2
3
Control
4
5
1
2
3
4
5
Challenge
Note: QCL: Quality of college life; Lower solid line: OLS regression line; Upper
solid line: CR-FDH ceiling line; Dashed line: CE-FDH ceiling line
216 |
ICUEH2017
Table 3
Bottleneck table: Required minimum levels of commitment,
control
challenge
differentand
desired
levelsfor
of quality of college life (%)
Quality
of
college
life
0
CE-FDH
Commitme
nt NN
10
CR-FDH
NN
Challeg
e NN
Commitme
nt NN
NN
NN
NN
20
NN
30
NN
16.
7
16.
40
NN
5
0
60
NN
7
16.
7
16.
16.
7
16.
7
25.
0
25.
8.3
6.7
7
16.
7
16.
0
25.
0
25.
8.3
10.
0
13.
70
80
90
Control
7
16.
7
0.083
100
d
NN
Challeg
e NN
NN
0.2
NN
NN
NN
3.1
NN
NN
NN
6.1
NN
NN
NN
9.1
NN
8.3
NN
0.9
8.3
3.3
12.
0
15.
8.3
0
25.
0
0.182
3
16.
7
0.042
8.3
0.047
Control
2.4
0
18.
0
20.
3.9
9
23.
9
26.
6.9
9
0.122
5.4
8.3
0.023
Note: CE-FDH: ceiling envelopment-free disposal hull; CR-FDH: ceiling
regression-free disposal hull; d: effect size; NN: not necessary; NA: not
available.
Figure 2. Ceiling lines of necessary conditions for quality of
life
NCA Plot : Control - QoL
5
4
OLS
CE-FDH CR-FDH
1
1
2
3
QoL
3
2
QoL
4
5
NCA Plot : Commitment - QoL
OLS
CE-FDH CR-FDH
1
2
3
Commitment
4
5
1
2
3
4
5
Control
Note: QoL: Quality of life; Lower solid line: OLS regression line; Upper solid line:
CR-FDH ceiling line; Dashed line: CE-FDH ceiling line
Table 4
Bottleneck table: Required minimum levels of commitment,
control and challenge for different desired levels of quality of life
(%)
CE-FDH
Quality
of
life
0
Commitme
nt
NN
10
CR-FDH
NN
Challeg
e
NN
Commitme
nt
NN
NN
NN
NN
20
8.3
30
8.3
16.
7
16.
25.
0
25.
7
16.
7
16.
0
25.
0
25.
7
33.
3
33.
8.3
0
25.
0
41.
3
33.
3
66.
8.3
7
66.
7
0.255
41.7
40
5
0
60
70
80
90
Control
7
50.
0
0.203
100
NN
Challeg
e
NN
NN
NN
NN
NN
NN
NN
NN
NN
4.1
1.6
NN
NN
9.8
9.8
NN
NN
15.
6
21.
18.
0
26.
NN
4
27.
2
32.
3
34.
5
42.
7.2
9
38.
7
44.
7
51.
0
59.
8.3
41.7
Control
NN
17.
5
27.
5
2
0.1
0.213
71 CR-FDH: ceiling
Note: CE-FDH: ceiling envelopment-free disposal hull;
regression-free disposal hull; d: effect size; NN: not necessary; NA: not
available.
d
0.083
9
38.
3
0.071
Figure 3. Ceiling lines of necessary conditions for learning
performance
NCA Plot : Control - Learning.peformance
5
Learning.peformance
4
4
2
1
2
1
1
1
2
3
Commitment
4
5
OLS
CE-FDH CR-FDH
3
5
NCA Plot : Challenge - Learning.peformance
OLS
CE-FDH CR-FDH
3
Learning.peformance
3
2
Learning.peformance
4
5
NCA Plot : Commitment - Learning.peformance
OLS
CE-FDH CR-FDH
1
2
3
Control
4
5
1
2
3
4
Challenge
Note: Lower solid line: OLS regression line; Upper solid line: CR-FDH ceiling
line; Dashed line: CE-FDH ceiling line
5
218 |
ICUEH2017
Table 5
Bottleneck table: Required minimum levels of commitment,
control
challenge
differentand
desired
levelsfor
of learning performance (%)
Learning
CE-FDH
peforman Commitme Control
ce
nt NN
0
NN
CR-FDH
Challeg
e NN
Commitme
nt NN
Control
NN
Challeg
e NN
10
NN
NN
NN
NN
NN
NN
20
NN
NN
NN
NN
NN
NN
30
8.3
NN
NN
NN
NN
NN
40
8.3
NN
NN
3.4
NN
NN
5
0
60
8.3
NN
NN
NN
NN
25.
0
41.
16.
7
25.
NN
13.
5
23.
7.7
NN
0
33.
3
50.
16.7
19.
6
31.
4.8
7
41.
7
50.
6
33.
7
43.
0
75.
0
0.229
0
58.
3
0.156
33.3
8
53.
9
64.
5
43.
5
55.
0.083
0
0.203
4
0.129
70
80
90
100
d
16.7
33.3
13.
7
22.
6
31.
5
0.056
Note: CE-FDH: ceiling envelopment-free disposal hull; CR-FDH: ceiling
regression-free disposal hull; d: effect size; NN: not necessary; NA: not
available.
4. Discussion, implications and directions for future
research
Recognizing the role that hardiness in learning plays in the outcomes
of students, this study investigates the impact of hardiness in learning,
overall as well as its individual components (i.e., commitment, control
and challenge), on the quality of college life, quality of life, and
learning performance of business students. The study also explores
the degrees of necessity of commitment, control and challenge for
the occurrence of study outcomes. The results reveal that overall
hardiness in learning has a positive effect on study outcomes. In terms
of individual components, commitment, control and challenge have a
positive impact on learning performance, however, control does not
affect quality of college life and challenge has no effect on quality of
life. In addition, these components have different degrees of
necessity for the occurrence of study outcomes. These findings offer a
number of implications for theory, research and practice.
In terms of theory and research, first, this study first reconfirms the
net effects of hardiness in learning as well as its components on study
outcomes and then, discovers their degrees of necessity. During the
past several years, studies have investigated the role of hardiness in
work
and study outcomes (e.g., Bartone et al., 2009; Kobasa et al., 1982;
Maddi, 1999; Nguyen et al., 2012; Sezgin, 2009). Such studies,
however, have mainly discovered the net effects of hardiness on
various work and study outcomes. This study, among first studies,
examines of the levels of necessity of the components of hardiness
(i.e., commitment, control, and challenges) for study outcomes. The
study, therefore, may assist researchers in better understanding the
role of hardiness, a key psychological resource, especially, the degree
of necessity of its components for the study outcomes of business
students. In so doing, the study sheds light on a new way of research
on psychological resources in general and hardiness in particular,
especially in transitioning markets like Vietnam.
In terms of practice, the study findings suggest certain ways in which
universities might be able to enhance the study outcomes of business
students. Note that hardiness was originally conceptualized as a
personality trait which is considerably stable over time. Recent
research shows that hardiness is a part trait and part state, and
therefore is open to change and development (Bartone, Valdes, &
Sandvik, 2016). This gives opportunities for hardiness assessment and
training programs. For example, Maddi (2002) has proved successful
in cultivating hardy skills and attitudes. Vietnamese universities could
organize such hardiness training programs whether as regular credit
courses or non-credit courses to equip students with hardy attitudes
and skills, helping to study outcomes of business students. In so
doing, Vietnamese universities may reach their educational standard
to satisfy the need of qualified business graduates.
This study has a number of limitations. First, the model was only
tested with undergraduate business students in some key universities
in Ho Chi Minh City. The model should be tested with post-graduate
business students as well as business students at universities in other
cities and provinces in Vietnam, such as in Can Tho, Da Nang, and
Hanoi to enhance the generalizability of the results. Second, the
model only examines the sole role of hardiness in study outcomes.
There are several other psychological resources that may interact with
hardiness to enhance the study outcomes of business students, such
as optimism, self-efficacy, hope, and personality traits (e.g., the Big
Five). This deserves further investigation in future research.
References
Abdollahi, A., Talib, M. A., Carlbring, P., Harvey, R., Yaacob, S. N., & Ismail, Z.
(2016). Problem-solving skills and perceived stress among undergraduate
students: The moderating role of hardiness. Journal of Health Psychology,
DOI: />
220 |
ICUEH2017
Abdollahi, A., Talib, M. A, Yaacob, S. N., & Ismail, Z. (2015). The role of
hardiness in decreasing stress and suicidal ideation in a sample of
undergraduate students. Journal of Humanistic Psychology, 55(2), 202222.
Alfred, G. C., Hammer, J. H., & Good, G. E. (2014). Male student veterans:
Hardiness, psychological well- being, and masculine norms. Psychology of
Men & Masculinity, 15(1), 95-99.
Arslan, S., & Akkas, O. A. (2014). Quality of college life (QCL) of students
in Turkey: Students’ life satisfaction and identification. Social Indicators
Research, 115(2), 869-884
Bartone, P. T., Valdes, J. J., & Sandvik, A. (2016). Psychological hardiness
predicts cardiovascular health.
Psychology, Health & Medicine, 21(6), 743-749.
Bartone, P. T., Eid, J., Johnsen, B. H., Laberg, J. C., & Snook, S. A. (2009). Big
five personality factors, hardiness, and social judgment as predictors of
leader performance. Leadership & Organization Development Journal,
30(6), 498-521.
Bartone, P. T., Ursano, R. J., Wright, K. M., & Ingraham, L. H. (1989). The impact
of a military air disaster on the health of assistance workers: A
prospective study. Journal of Nervous and Mental Disease, 177(6), 317328.
Britt, T. W., Adler, A. B., & Barton, P. T. (2001). Deriving benefits from
stressful events: The role of engagement in meaningful work and
hardiness. Journal of Occupational Health Psychology, 6(1), 53- 63.
Cha, K. -H. (2003). Subjective well-being among college students. Social
Indicators Research, 62(1), 455- 477.
Chow, H. P. H. (2005). Life satisfaction among university students in a
Canadian prairie city: A multivariate analysis. Social Indicators Research,
70(2), 139-150.
Cole, M. S., Field, H. S., & Harris, S. G. (2004). Student learning motivation and
psychological hardiness: Interactive effects on students’ reactions to a
management class. Academy of Management Learning and Education,
3(1), 64-85.
Cummins, R. A. (2010). Subjective wellbeing, homeostatically protected mood
and depression: A synthesis. Journal of Happiness Studies, 11(1), 1-17.
Dul, J. (2016a). Necessary condition analysis (NCA): Logic and methodology
of 'necessary but not sufficient' causality. Organizational Research
Methods, 19(1), 10-52.
Dul, J. (2016b). Necessary condition analysis. R package version 2.0. URL:
http://cran.r- project.org/web/packages/NCA/
Fornell, C., & Larcker, D. F. (1981). Evaluating structural equation models with
unobservable variables and measurement error. Journal of Marketing
Research, 18(1), 39-50.
Nguyen Dinh
Tho
| 221 Suicide
Furr, S. R., Westefeld, J. S., McConnell, G. N., & Jenkins, J. M.
(2001).
and depression among college students: A decade later. Professional
Psychology: Research and Practice, 32(1), 97-100.
Fyhn, T., Fjell, K. K., & Johnsen, B. H. (2016). Resilience factors among police
investigators: Hardiness- commitment a unique contributor. Journal of
Police and Criminal Psychology, 31(4), 261-269.
Johnsen, B. H., Espevik, R., Saus, E. R., Sanden, S., Olsen, O. K., & Hystad, S.
W. (2017). Hardiness as a moderator and motivation for operational duties
as mediator: The relation between operational self- efficacy, performance
satisfaction, and perceived strain in a simulated police training scenario.
Journal of Police and Criminal Psychology, doi:10.1007/s11896-017-92251.
Kelly, D. R., Matthews, M. D., & Bartone, P. T. (2014). Grit and hardiness as
predictors of performance among West Point cadets. Military Psychology,
26(4), 327-342.
Kobasa, S. C. (1979). Stressful life events, personality, and health: An inquiry
into hardiness. Journal of Personality and Social Psychology, 37(1), 1-11.
Kobasa, S. C. & Puccetti, M. C. (1983). Personality and social resources in
stress resistance. Journal of Personality and Social Psychology, 45(4),
839-850.
Kobasa, S. C., Maddi, S. R., & Kahn. S. (1982). Hardiness and health: A
prospective study. Journal of Personality and Social Psychology, 42(1),
168-177.
Maddi, S. R. (1999). Comments on trends in hardiness research and
theorizing. Consulting Psychology Journal: Practice & Research, 51(2),
67-71.
Maddi, S. R. (2002). The story of hardiness: Twenty years of theorizing,
research and practice. Consulting Psychology Journal, 54(3), 175-185.
Muthen, B. & Kaplan, D. (1985). A comparison of some methodologies for
the factor analysis of non- normal Likert variables, British Journal of
Mathematical and Statistical Psychology, 38(2), 171-189.
Nguyen, T. T. M. & Nguyen, T. D. (2010). Determinants of learning performance
of business students in a transitional market. Quality Assurance in
Education, 18(4), 304-316.
Nguyen, T. D., Shultz, C. J., & Westbrook, M. D. (2012). Psychological hardiness
in learning and quality of college life of business students: Evidence from
Vietnam. Journal of Happiness Studies, 13(6), 1091- 1103.
Peterson, M., & Ekici, A. (2007). Consumer attitude toward marketing and
subjective quality of life in the context of a developing country. Journal of
Macromarketing, 27(4), 350-359.
Podsakoff, P. M., MacKenzie, S. B., Lee, J. -Y., & Podsakoff, N. P. (2003).
Common method biases in behavioral research: A critical review of the
literature and recommended remedies. Journal of Applied Psychology,
88(5), 879-903.
Posadzki, P., Musonda, P., Debska, G., & Polczyk, R. (2009). Psychosocial
conditions of quality of life among undergraduate students: A cross
sectional survey. Applied Research in Quality of Life, 4(3), 239–258.
Ragin, C. (2008). Redesigning Social Inquiry. Chicago IL: University of Chicago
Press.
Sezgin, F. (2009). Relationships between teacher organizational commitment,
psychological hardiness and some demographic variables in Turkish
primary schools. Journal of Educational Administration, 47(5), 630-651.
Sirgy, M.J., Grzeskowiak, S., & Rahtz, D. (2007). Quality of college life of
students: Developing and validating a measure of well-being. Social
Indicators Research, 80(2), 343-360.
222 |
ICUEH2017
Stoppelbein, L., McRae, E., & Greening, L. (2017). A longitudinal study of
hardiness as a buffer for posttraumatic stress symptoms in mothers of
children with cancer. Clinical Practice in Pediatric Psychology, 5(2), 149160
Vaez, M., Kristenson, M., & Laflamme, L. (2004). Perceived quality of life and
self-rated health among first-year university students: A comparison with
their working peers. Social Indicators Research, 68(2), 221-234.
Wiebe, D. J., & McCallum, D. M. (1986). Health practices and hardiness as
mediators in the stress-illness relationship. Health Psychology, 5(5), 425438.
Young, M. R., Klemz, B. R., & Murphy, J. W. (2003). Enhancing learning
outcomes: The effects of instructional technology, learning styles,
instructional methods, and student behaviour. Journal of Marketing
Education, 25(2), 130-142.