TAX POLICY: Tax-Exempt Status of Certain Bonds Merits Reconsideration, and Apparent Noncompliance with Issuance Cost Limitations Should Be Addressed doc
Bạn đang xem bản rút gọn của tài liệu. Xem và tải ngay bản đầy đủ của tài liệu tại đây (2.41 MB, 77 trang )
United States Government Accountabilit
y
Office
GAO
Report to the Committee on Finance,
U.S. Senate
TAX POLICY
Tax-Exempt Status of
Certain Bonds Merits
Reconsideration, and
Apparent
Noncompliance with
Issuance Cost
Limitations Should Be
Addressed
February 2008
GAO-08-364
What GAO Found
United States Government Accountability Office
Why GAO Did This Study
Highlights
Accountability Integrity Reliability
Februar
y
2008
TAX POLICY
Tax-Exempt Status of Certain Bonds Merits
Reconsideration, and Apparent Noncompliance with
Issuance Cost Limitations Should Be Addressed
Highlights of
GAO-08-364, a report to the
Committee on Finance, U.S. Senate
To view the full product, including the scope
and methodology, click on
GAO-08-364.
For more information, contact Michael
Brostek at (202) 512-9110 or
The outstanding amount of state
and local government tax-exempt
bonds has increased over the years.
Congress is interested in whether
the bonds are used for appropriate
purposes since the federal
government forgoes billions in tax
revenues annually by excluding the
bonds’ interest from investors’
federal gross income. Questions
also exist over the bonds’
borrowing costs as they can divert
funds from the funded projects.
This report (1) describes recent
trends in tax exempt bonds,
(2) provides information on the
types of facilities financed with tax-
exempt bonds, and (3) discusses
borrowing costs considering the
methods of selling bonds and
compares issuance costs paid from
bond proceeds for governmental
and qualified private activity bonds.
In addition to interviewing relevant
officials, we analyzed IRS’s
Statistics of Income (SOI) data and
data from Thomson Financial to
address these objectives.
What GAO Recommends
Congress should consider whether
facilities, including hotels and golf
courses, that are privately used
should be financed with tax-
exempt governmental bonds. GAO
also recommends that IRS clarify
how bond issuers report issuance
costs and develop methods to
detect and address apparent
noncompliance with limits on using
bond proceeds for issuance costs.
In response, the Acting IRS
Commissioner agreed with our
recommendations and outlined the
actions IRS would take.
In recent years, the volume of tax-exempt bonds issued annually for both
governmental and private activity bonds has reached historically high levels.
Generally, the volume of new money bond issues has been greater than bonds
issued for refunding purposes. The volume of tax-exempt bonds issued,
particularly bonds issued for refunding, tends to be highest when interest
rates decline. Because the interest earned by investors who purchase tax
bonds is generally excluded from federal income taxes, the federal revenue
losses amount to billions of dollars annually.
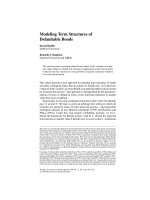
Total Dollar Amount of All Long-term, Tax-Exempt Bonds Issued Annually, 1991 through 2005
0
50
100
150
200
250
300
350
400
450
500
200520042003200220012000199919981997199619951994199319921991
Dollars in billions (constant 2007 dollars)
Source: GAO analysis of IRS’s Statistics of Income Division data.
Year
Note: Amounts include governmental and qualified private activity bonds for new money and
refunding bonds. Calendar year 2005 is the most recent available IRS data.
Tax-exempt governmental and private activity bonds are used to finance a
wide range of projects and activities, with bonds issued for “educational
purposes” generally being the largest category of governmental bonds
annually. Nonprofit organizations are the largest issuers of qualified private
activity bonds. Previous legislation prohibited using qualified private activity
bonds for certain facilities, including professional sports stadiums, hotels, and
private golf courses. However, many of these types of facilities are still being
financed with tax-exempt governmental bonds. Congress has held hearings on
this issue primarily focusing on sports stadiums.
Although the evidence is not definitive, studies have generally shown that
interest costs are lower for bonds sold when competition between
underwriters exists compared to when bond sales are negotiated with
underwriters after controlling for other factors. About half of all issuers of
qualified private activity bonds reported paying issuance costs from bond
proceeds from 2002 to 2005. IRS’s guidance does not indicate what to report
when no issuance costs are paid from bond proceeds. Of those reporting
issuance costs, some private activity bond issuers reported paying issuance
costs from bond proceeds that exceed statutory limits.
Contents
Letter 1
Results in Brief 3
Background 5
In Recent Years, the Dollar Amount of Long-term Tax-Exempt
Bonds Issued Annually Has Been at Historically High Levels, and
the Tax Exemption Is One of the Largest Federal Tax
Expenditures 10
Tax-Exempt Bonds Are Used to Finance a Wide Range of Facilities
and Activities 18
Borrowing Costs Vary Depending on Bond Characteristics, and
Some Bonds Appear to Exceed the Statutory Limit on Issuance
Costs Paid from Bond Proceeds 35
Conclusions 42
Matter for Congressional Consideration 43
Recommendations for Executive Action 43
Agency Comments 43
Appendix I Objectives, Scope, and Methodology 45
Appendix II Sources of Information on the Facilities and
Activities Financed Using Tax-Exempt Bonds 49
Appendix III Summary of Thomson Financial 2007 Bond Buyer
Yearbook Data, Use of Proceeds, 2002-2006
Combined
51
Appendix IV Amount and Number of New Money, Long-term
Governmental Bonds Issued by IRS SOI Purpose
Categories, 2001-2005 Combined
53
Appendix V List of Studies Reviewed on Interest Costs in
Competitive and Negotiated Sales 54
Page i GAO-08-364 Tax Policy
Appendix VI Comments from the Internal Revenue Service 55
Appendix VII Comments from the Department of the Treasury 57
Appendix VIII GAO Contact and Staff Acknowledgments 71
Tables
Table 1: The Amounts of Long-term Tax-Exempt Bonds Issued for
New Money and Refunding Purposes, 1991 to 2005 13
Table 2: Summary of Bond Buyer Yearbook Data on Uses of
Municipal Bonds Issued in Calendar Year 2006 19
Table 3: Summary of Facilities and Activities Financed with Tax-
Exempt Bonds Issued in 2006 Based on a Limited Sample
of 40 Official Statements 24
Table 4: Summary of Facilities and Activities Financed with New
Money, Long-term Tax-Exempt Private Activity Bonds
Issued in 2005 27
Table 5: New Types of Private Activity Bonds Created since 2001 28
Table 6: New Hotels Financed with Tax-Exempt Governmental
Bonds Issued from 2002 through 2006 31
Table 7: Municipal Golf Courses Opened in 2005 and Financed with
Tax-Exempt Governmental Bonds 33
Table 8: Median Issuance Costs Paid from Bond Proceeds as a
Percentage of Bond Proceeds for Long-term Qualified
Private Activity Bonds Issued from 2002 to 2005 39
Table 9: Median Issuance Costs as a Percentage of Bond Proceeds
for Long-term Governmental Bonds Issued from 2002 to
2005 41
Figures
Figure 1: Total Dollar Amounts of All Long-term Tax-Exempt
Bonds Issued Annually from 1991 through 2005 10
Figure 2: Comparison of the Dollar Amounts of Long-term
Governmental and Qualified Private Activity Bonds Issued
from 1991 through 2005 12
Page ii GAO-08-364 Tax Policy
Figure 3: Percentage Change in New Money and Refunding Issues
versus Changes in Interest Rates, 1992 through 2005 15
Figure 4: Estimated Revenue Loss from Excluding Interest Earned
on Tax-Exempt Bonds from Federal Income Tax, 2000
through 2012 17
Figure 5: Dollar Amount and Number of New Money, Long-term
Governmental Bonds Issued in 2005 by IRS SOI Purpose
Categories 22
Abbreviations
AMT alternative minimum tax
I.R.C. Internal Revenue Code
IRS Internal Revenue Service
JCT Joint Committee on Taxation
MSRB Municipal Securities Rulemaking Board
SOI Statistics of Income Division
Treasury Department of the Treasury
This is a work of the U.S. government and is not subject to copyright protection in the
United States. It may be reproduced and distributed in its entirety without further
permission from GAO. However, because this work may contain copyrighted images or
other material, permission from the copyright holder may be necessary if you wish to
reproduce this material separately.
Page iii GAO-08-364 Tax Policy
United States Government Accountability Office
Washington, DC 20548
February 15, 2008
The Honorable Max Baucus
Chairman
The Honorable Charles E. Grassley
Ranking Member
Committee on Finance
United States Senate
The outstanding volume of state and local government tax-exempt bond
debt grew significantly from about $1.4 trillion in 2000 to over $2.1 trillion
in 2006 in constant 2007 dollars. Because the tax exemption allows
taxpayers to generally exclude the bond interest from their federal gross
income, the federal government forgoes tax revenue. According to our
analysis of the Department of the Treasury’s (Treasury) estimates, forgone
federal tax revenues were about $32.0 billion in 2000 and were projected
to be about $37.0 billion in 2007.
1
Congressional interest in the use of tax-
exempt bonds has heightened because of the large dollar amounts of
bonds outstanding coupled with the large amounts of forgone federal tax
revenues.
State and local governments have broad discretion in using tax-exempt
bonds to finance public infrastructure and other projects. Although state
and local governments (and certain nonprofit entities) can use tax-exempt
bond financing to subsidize activities of private entities, Congress
previously placed limitations on the use of such financing for specific
private activities and, in general, has limited the annual volume on such
bonds.
2
For example, Congress allows the use of tax-exempt bonds for
privately owned facilities such as airports, docks, and wharves subject to
annual state-by-state volume caps. In addition, there are special rules for
providing tax-exempt bond financing for private uses within certain
1
Summing the individual tax preference estimates, as is done to obtain these totals, is
useful for gauging the general magnitude of the federal revenue involved, but it does not
take into account possible interactions between individual provisions. Despite the
limitations in summing separate revenue loss estimates, these are the best available data
with which to measure the value of tax expenditures. Other researchers also have summed
tax expenditure estimates to help gain perspective on the use of this policy tool and
examine trends in the aggregate growth of tax expenditure estimates over time.
2
Pub. L. No. 99-514 (1986).
Page 1 GAO-08-364 Tax Policy
geographic areas (e.g., enterprise and empowerment zones, the New York
Liberty Zone, and the Gulf Opportunity Zone) to provide incentives for
economic development.
Because issuing bonds can be a complex process requiring specialized
services in planning and selling the bonds, congressional interest has also
focused on the borrowing costs, including interest costs and issuance
costs, that bond issuers pay when bonds are issued. Concerns have
focused on the methods of selling the bonds because this might affect the
interest costs paid by municipal governments and ultimately the amount of
federal forgone revenues. Further, issuance costs can divert bond
proceeds from the facilities and activities for which the bonds were
intended to be used.
To support Congress’s efforts to review the types of facilities and activities
that are financed with tax-exempt bonds and understand the factors
affecting the costs of issuing the bonds, you requested this study. Our
objectives were to
• describe recent trends in the dollar volume of tax-exempt bonds;
• provide information on the types of facilities and activities that are
financed with tax-exempt bonds, in particular, information on hotels and
municipal golf courses that were recently financed with tax-exempt bonds;
and
• provide information on borrowing costs that bond issuers pay by
summarizing relevant research on whether bond interest costs vary by the
method of sale, considering characteristics of the bond and bond issuer
and providing information on how bond issuance costs vary between
governmental and private activity bonds, including the extent to which
private activity bond issuers exceed the statutory limit for issuance costs
as a percentage of bond proceeds.
To address our objectives, we obtained information from several sources
that are recognized as being reliable sources for data on tax-exempt
bonds. To describe recent trends in the dollar amounts and numbers of
tax-exempt bonds, we used data from the Internal Revenue Service’s (IRS)
Statistics of Income Division (SOI), which collects data from the
information returns issuers of tax-exempt bonds are required to file with
IRS. We also used data contained in the Bond Buyer Yearbook, a
publication that summarizes information on bond issuances that is widely
used as a reference by bond industry experts. To provide information on
the facilities and activities financed using tax-exempt bonds, we relied on
data from SOI, the Bond Buyer Yearbook, and a limited random sample of
Page 2 GAO-08-364 Tax Policy
official statements for tax-exempt bonds. Official statements are used to
market the bonds and contain descriptive information on the facilities and
activities financed using the bonds. Because we could not find a
comprehensive source of information on hotels and municipal golf courses
financed with tax-exempt bonds, we provide some limited data from the
best available sources we could identify. To provide information on
borrowing costs associated with tax-exempt bonds, we summarized
relevant recent research on whether interest costs vary considering the
method of sale and analyzed SOI data on issuance cost as reported to IRS
by bond issuers. For information pertaining to our work in general, we
interviewed officials in IRS’s Tax-Exempt Bond Office in its Government
Entities and Tax-Exempt Division and Treasury’s Office of Tax Policy and
other experts in taxation and government finance in the Government
Finance Officers’ Association, the Securities Industry and Financial
Markets Association, and the Congressional Research Service.
We determined that the data we used in this report were sufficiently
reliable for our purposes. Appendix I provides a detailed description of
our methodology, sources, and limitations. We conducted our work from
December 2006 through January 2008 in accordance with generally
accepted government auditing standards.
Since 2002, the dollar amount of long-term tax-exempt bonds issued
annually has reached historically high levels. Governmental bonds, which
are generally issued for traditional public purposes, account for the
majority of the bonds issued each year. However, the dollar volume of
qualified private activity bonds, which provide tax-exempt financing for
facilities and activities that are private in nature and meet certain legal
requirements, has also been noticeably higher in recent years. More than
half of the bonds issued are new money issues, that is, bonds for new
facilities and activities. Because the interest income that investors earn
from tax-exempt bonds is generally not included in their federal gross
income, the cost to the federal government is significant and growing.
Based on estimates by Treasury and the Joint Committee on Taxation
(JCT), the federal government forgoes tens of billions of dollars of revenue
annually.
The majority of governmental bonds are used for purposes related to
education, transportation, and public facilities and activities, whereas
Results in Brief
Page 3 GAO-08-364 Tax Policy
qualified private activity bonds are mostly used by 501(c)(3)
3
nonprofit
organizations and entities, such as governmental authorities specifically
established to support private activities, such as airports, docks, wharves,
and other facilities often intended to generate economic development. In
the 1980s, Congress passed laws that limited the dollar amount of private
activity bonds that could be issued in a given year as well as specifying
certain facilities as not being eligible for tax-exempt private activity bond
financing, including sports stadiums, hotels, and private golf courses.
However, tax-exempt governmental bonds can still be used to finance
some of these types of facilities and projects for which tax-exempt private
activity bonds can no longer be used. Based on limited information, we
found 18 newly constructed hotels that were financed in whole or in part
with governmental bonds issued from 2002 through 2006. Also, based on
limited information, we found that six municipal golf courses that opened
in 2005 were financed by governmental bonds. Recent congressional
hearings have raised questions about using governmental bonds for
purposes that are private in nature, such as professional sports stadiums,
but similar attention has not been focused on other types of facilities that
are essentially private in nature.
Although the results varied, recent studies generally showed that the
competitive method of selling municipal bonds has lower interest costs,
after controlling for other factors, than using the negotiated method of
sale. However, several recently issued studies also show that there is not a
statistically significant difference in interest costs for bonds sold on a
competitive versus negotiated basis. Bond issuance costs vary by size and
type of bond for both governmental and private activity bonds. Smaller
bonds tend to report higher issuance costs as a percentage of bond
proceeds than larger bonds. Some qualified private activity bonds issued
from 2002 through 2005 reported issuance costs paid from bond proceeds
that exceed statutory limits, an apparent violation of applicable federal
laws. For example, from 2002 to 2005, between 17 and 39 qualified private
activity bonds annually—about 1 to 2 percent of qualified private activity
bonds that reported issuance costs paid from bond proceeds—reported
issuance costs that exceeded applicable statutory limits. IRS officials said
that these apparent violations merited investigation, but given the large
lost revenue implications of certain other forms of noncompliance, IRS
would have to address low-cost options for addressing violations of
3
Section 501(c)(3) of the Internal Revenue Code defines the conditions for nonprofit, or
charitable organizations to maintain tax-exempt status.
Page 4 GAO-08-364 Tax Policy
issuance cost restrictions. Over half of the issuers of qualified private
activity bonds issued from 2002 through 2005 reported issuance costs paid
from bond proceeds, but for nearly half of issued bonds the issuers left the
line on issuance costs blank when reporting to IRS. IRS cannot be sure it is
able to detect nonreporting and address apparent violations with the
statutory limit on using bond proceeds for issuance costs, in part because
its instructions to issuers do not clearly indicate what to report to IRS
when no bond proceeds are used for issuance costs.
As Congress considers whether tax-exempt governmental bonds should be
used for professional sports stadiums that are generally privately used, it
should also consider whether other facilities, including hotels and golf
courses, that are privately used should continue to be financed with tax-
exempt governmental bonds. Additionally, to help IRS better monitor
whether issuers of qualified private activity bonds are complying with the
statutory limit on using bond proceeds for issuance costs, we recommend
that the Commissioner of Internal Revenue (1) clarify IRS’s forms and
instructions for reporting issuance costs paid from bond proceeds so that
bond issuers are required to clearly designate on the form instances where
bond proceeds were not used to pay issuance costs and (2) develop cost-
effective methods to address apparent noncompliance with the statutory
limits in a manner that would not preclude IRS from examining the bonds
for more substantive compliance issues in the future.
The Acting Commissioner of Internal Revenue provided comments on a
draft of this report in a February 7, 2008, letter. She said that IRS agrees
with our recommendations and indicated specific actions it plans to take
to address them. The Treasury Assistant Secretary for Tax Policy also
provided comments on a draft of this report in a February 8, 2008, letter.
Treasury’s comments focused on use of tax-exempt governmental bonds
to finance stadiums and other projects with significant private business
use. Treasury said that this is arguably a structural weakness in the
targeting of the federal tax expenditure for tax-exempt bonds under the
existing legal framework and noted options to address this structural
weakness. Written comments from IRS are reprinted in appendix VI and
written comments from Treasury are reprinted in appendix VII.
Tax-exempt bonds are valid debt obligations of state and local
governments. Under Section 103 of the Internal Revenue Code (I.R.C.), the
Background
Page 5 GAO-08-364 Tax Policy
interest earned on most bonds issued by state and local governments is
tax-exempt. This means that the interest paid to bondholders is generally
not included in their gross income for federal income tax purposes.
4
The
tax exemption lowers the bond issuer’s borrowing costs and may provide
equivalent or higher after-tax yields to investors than alternative
investments that are not tax-exempt. Tax-exempt bond financing can
apply to different types of debt financing arrangements, including notes,
loans, commercial paper, certificates of participation, and tax-increment
financing.
5
The tax-exempt status remains throughout the life of the bonds
provided that all applicable laws are satisfied. IRS’s Tax-Exempt Bond
Office in its Tax Exempt and Government Entities division is responsible
for administering tax laws pertaining to tax-exempt bonds.
Tax-exempt bonds can be characterized as new money and refunding
issues. New money issues refer to bonds used to finance a new project. A
refunding issue refers to any bond issue used to pay debt service on and
retire an outstanding issue. Typically, refunding is done for reasons such
as to reduce the interest rate and ease restrictions on the original bond
contract. Refunding issues are either current or advanced based on the
timing between the issuance of the new bonds and the maturity date of the
outstanding bonds. Current refunding occurs when new bonds are issued
within 90 days of the final payment on the prior issue and advance
refunding occurs if the new bonds are issued more than 90 days before
final payment on the prior issue.
For federal tax purposes municipal bonds are classified as either
governmental bonds or private activity bonds. In general, governmental
bonds are tax-exempt and are used to build public capital facilities and
serve the general public interest. The I.R.C. does not specifically define
governmental bonds; rather, all municipal bonds that do not meet the
criteria to be classified as private activity bonds are governmental bonds.
4
States may also allow tax-exempt bond interest to be excluded from state income taxes.
5
Notes, commercial paper, certificates of participation, and tax-increment financing are all
different types of financing arrangements typically used in connection with tax-exempt
bonds. Notes have short-term maturities and are issued to address mismatches in timing of
expenditures and offsetting revenues. Commercial paper is an unsecured obligation also
used to finance short-term credit needs. Certificates of participation are financing
arrangements in which an individual buys a share of the lease revenues of an agreement
made by a municipal or governmental entity, rather than the bond being secured by those
revenues. Tax-increment financing is a way of pledging some of the increased taxes that
result when property is redeveloped to pay the costs of associated public investment.
Page 6 GAO-08-364 Tax Policy
Municipal bonds are classified as private activity bonds, which provide
financing to private businesses, if they pass both the private payment and
the private business use test. These tests specify that if more than 10
percent of the bond proceeds are used for private business purposes and
more than 10 percent of the bond proceeds are secured by payments from
property used for private business use, then the bond is a private activity
bond. A bond that is classified as a private activity bond can be taxable or
tax-exempt. Congress has specified certain private activities (see tables 4
and 5) that can be financed with tax-exempt bonds. Private activity bonds
that receive tax-exempt status are called qualified private activity bonds.
Private activities that are not “qualified” are taxable.
Generally, qualified private activity bonds are subject to a number of
restrictions that do not apply to governmental bonds, including a 2 percent
limit on using proceeds of the bond sale to pay issuance costs,
6
annual
state-by-state limitations on the volume of bonds that can be issued, and
the disallowance for advanced refunding. In addition, the interest income
from qualified private activity bonds is an addition to income for purposes
of calculating the alternative minimum tax (AMT) whereas the interest on
governmental bonds is not.
7
However, some exceptions to these
restrictions exist for qualified 501(c)(3) private activity bonds
8
issued by or
on behalf of nonprofit entities. Qualified 501(c)(3) bonds do not count
toward annual state-by-state volume limits; the interest income on these
bonds issued after August 7, 1986, is not subject to AMT rules; and unlike
other qualified private activity bonds, qualified 501(c)(3) bonds can be
advance refunded.
Tax-exempt bonds can be structured as general obligation or revenue
bonds. General obligation bonds, also known as full faith and credit
obligations, are secured by revenues obtained from the issuer’s general
taxing powers, including sales taxes, property taxes, and income taxes.
6
Qualified private activity bonds for small mortgage revenue bonds and veterans’ mortgage
revenue bonds are subject to a 3.5 percent limit on bond proceeds for issuance costs.
7
AMT is a separate federal tax system that applies to both individual and corporate
taxpayers. It parallels the income tax system but with different rules for determining
taxable income, different tax rates for computing tax liability, and different rules for
allowing the use of tax credits.
8
Section 501(c)(3) bonds are issued by charitable organizations that qualify for exemption
under I.R.C. § 501(c)(3). Such organizations must be organized and operated exclusively
for educational, religious, or charitable purposes, and no part of the organizations’ net
earnings may inure to or be for the benefit of any shareholders or individuals.
Page 7 GAO-08-364 Tax Policy
Most general obligation bonds are used to build public infrastructure, such
as school buildings, jails, police stations, and city halls, and are classified
as governmental bonds for tax purposes. In contrast, revenue bonds are
issued to finance specific projects or enterprises and investors get paid
from the revenues generated by the financed projects. Revenue bonds can
be either governmental bonds or private activity bonds for tax purposes.
In addition to issuing tax-exempt bonds directly, state and local
governments may establish other entities to issue bonds “on behalf of”
such governmental units, or any political subdivision thereof.
9
For
example, a specifically constituted nonprofit corporation acting on behalf
of governmental units might own, operate, and issue debt to finance a
local airport. In addition to issuing bonds for government operations and
services, qualified governmental units are permitted to issue qualified
private activity bonds to provide tax-exempt financing for certain private
activities. In these cases, the qualified governmental unit generally acts as
a conduit, meaning that the qualified governmental unit issues the bonds,
but the nongovernmental entity receiving the benefit of tax-exempt
financing is required to provide the funds to repay the bonds.
Municipal governments incur costs to issue their bonds. Bond issuance
costs include the underwriting spread, which is the difference between the
price paid to the issuer by the underwriter and the price at which the
bonds are reoffered to investors, and fees for bond counsel, financial
advisors, public hearings, printing, and other costs. In addition, at the time
bonds are issued, issuers may choose to purchase bond insurance or
secure a line of credit to further ensure that principal and interest
payments will be made on time. This additional security can improve the
bond’s credit rating and result in lower interest costs over time for bond
issuers. Bond insurance or other types of credit designed to ensure the
timely repayment of bonds may not count as issuance costs for the
purposes of calculating the 2 percent limit with which qualified private
activity bonds generally must comply.
9
Although not states or subdivisions of states, Indian tribal governments are provided with
a tax status similar to state and local governments for specified purposes under
I.R.C. § 7871. Among the purposes for which a tribal government is treated similar to a
state is the issuance of tax-exempt bonds. However, tribal bond issues are subject to
limitations not imposed on state and local government issuers. Tribal governments are
authorized to issue tax-exempt bonds only if substantially all of the proceeds are used for
essential governmental functions or certain manufacturing facilities.
Page 8 GAO-08-364 Tax Policy
Bond issuers have two principal avenues for marketing their bonds in the
primary market
10
—competitive bids and negotiated sales.
11
In competitive
bids, underwriters who sell the bonds compete against each other to
market the bonds for the issuer, while in negotiated sales, the issuer
selects the underwriter and negotiates the terms of the bond sale. The
majority of tax-exempt bonds are issued through negotiated sales.
Guidance issued in 1996 and revised in 2007 by the Government Finance
Officers’ Association on the preferred method of sale emphasized that
both methods offer advantages in different circumstances. Generally,
competitive sales are favored in cases when the bond has a relatively high
credit rating; the bond is secured by strong, long-standing revenue
streams; and the structure of the bond does not include innovative
financing methods that require explanation to the bond market.
Negotiated sales may be preferred in cases where a bond with relatively
complex features is to be issued during a time period with volatile interest
rates, giving the underwriter and the issuer more flexibility in terms of the
timing of the bond issue and the underwriter more time to search for
investors better suited to more complex bonds. The revised guidance on
the preferred method of sale puts more emphasis on the advantages for
issuers to obtain financial advice that is independent from the underwriter.
In offering bonds for sale, various documents may be prepared, including a
preliminary (announcing the prospective bond sale) and final (after the
bonds have been issued) official statement. Official statements contain
information describing the bond issue, including the dollar amount,
maturity dates, financing arrangements, and information on the types of
facilities and activities being financed. A copy of the final official
statement is required to be sent to the Municipal Securities Rulemaking
Board (MSRB), a congressionally chartered organization that regulates
securities firms and banks involved in underwriting, trading, and selling
municipal securities.
10
A bond is being offered in the primary market during its original sale, where the bond
proceeds go to the bond issuer. Bonds being offered in the secondary market are being
traded among investors after the original sale has taken place.
11
A third method, referred to as private placement, is less frequently used. Under the
private placement method, the issuer sells bonds directly to investors.
Page 9 GAO-08-364 Tax Policy
Based on IRS data, the dollar amounts of long-term tax-exempt bonds
issued have been at their highest levels in recent years. Since 2002, the
dollar amount of long-term, tax-exempt bonds issued has exceeded
$395 billion annually.
12
In only 2 earlier years from the period 1991 through
2001, did the annual amount of bonds issued exceed $350 billion.
Furthermore, during this same period, municipal governments never
issued more bonds than in recent years. Figure 1 shows the annual dollar
amount of long-term, tax-exempt governmental and private activity bonds,
including new money and refunding bonds, issued from 1991 through 2005.
In Recent Years, the
Dollar Amount of
Long-term Tax-
Exempt Bonds Issued
Annually Has Been at
Historically High
Levels, and the Tax
Exemption Is One of
the Largest Federal
Tax Expenditures
Figure 1: Total Dollar Amounts of All Long-term Tax-Exempt Bonds Issued Annually from 1991 through 2005
0
50
100
150
200
250
300
350
400
450
500
200520042003200220012000199919981997199619951994199319921991
Dollars in billions (constant 2007 dollars)
Source: GAO analysis of IRS’s Statistics of Income Division data.
Year
Note: Amounts presented each year include governmental and qualified private activity bonds for new
money and refunding bonds. Calendar year 2005 is the most recent available IRS data.
12
Numbers are presented in constant 2007 dollars.
Page 10 GAO-08-364 Tax Policy
The recent increases in the dollar amounts of governmental bonds issued
have been a leading factor contributing to the high volume of tax-exempt
bonds issued since 2002. Figure 2 compares the annual dollar amounts of
governmental and qualified private activity bonds issued from 1991
through 2005. In recent years, that is, 2002 through 2005, at least
$295 billion of governmental bonds have been issued annually, or on
average about $314.8 billion per year. In comparison, in the earlier years of
1991 through 2001, the average amount of governmental bonds issued
annually was about $194.3 billion, or about 62 percent less than the
average annual amounts from 2002 through 2005 after adjusting for
inflation.
Similar to governmental bonds, the amounts of private activity bonds
issued annually has also been at peak levels since 2002. From 2002 through
2005, over $100 billion dollars in qualified private activity bonds were
issued each year. About $116 billion of qualified private activity bonds
were issued in 2005, more than in any other year since 1998. The average
dollar amount of qualified private activity bonds issued annually from 2002
through 2005 was about $106.7 billion. In comparison, in the earlier years
of 1991 through 2001, the average amount of qualified private activity
bonds issued annually was about $86.1 billion, or about 24 percent less
than the average annual amounts from 2002 through 2005 after adjusting
for inflation. Thus, though not as large as the comparable increase for
governmental bonds, there has been a noticeable increase in the amount
of qualified private activity bonds issued recently.
Page 11 GAO-08-364 Tax Policy
Figure 2: Comparison of the Dollar Amounts of Long-term Governmental and Qualified Private Activity Bonds Issued from
1991 through 2005
Dollars in billions (constant 2007 dollars)
0
50
100
150
200
250
300
350
200520042003200220012000199919981997199619951994199319921991
Source: GAO analysis of IRS’s Statistics of Income Division data.
Year
Governmental bonds
Private activity bonds
While both governmental and qualified private activity bonds reached
historically high levels recently, the amount of governmental bonds issued
annually has fluctuated to a greater extent. For example, from 1992 to
2005, the dollar amounts of governmental bonds issued annually either
increased or decreased by an average of about 25 percent per year. In
contrast, qualified private activity bonds fluctuated to a lesser extent, by
an average of about 13 percent per year. The wider fluctuation in
governmental bonds could be in part because governmental bonds are not
subject to as many restrictions, including annual state-by-state volume
caps, as qualified private activity bonds. Even if the volume cap for private
activity bonds is not reached for all states, the volume cap can place
constraints on the volume of private activity bonds issued because some
individual states may reach their limits and this would restrict them from
issuing any additional qualified private activity bonds that year.
13
13
From 2001 through 2005, about half of the states, including the District of Columbia, used
their full allocation of tax-exempt private activity bonds. In total, only about 2 percent of all
qualified private activity bonds subject to annual volume caps were not used by the states
during this period.
Page 12 GAO-08-364 Tax Policy
Another way to analyze the dollar amount of tax-exempt bonds is to
compare new money bonds to refunding bonds. Although the amount of
refundings substantially increased around 2002, new money bond issues
were generally higher than refunding issues each year since 1991. Since
1991, the dollar amount of refundings has been greater than new money
issues in only 3 years—1992, 1993, and 2005. From 2001 through 2005, the
amount of new money tax-exempt bond issues has exceeded $200 billion
annually (in constant dollars). This is greater than any year from 1991
through 2000. Table 1 shows the annual volume and percentage of long-
term, tax-exempt bonds issued for new money and refunding purposes
from 1991 through 2005.
Table 1: The Amounts of Long-term Tax-Exempt Bonds Issued for New Money and
Refunding Purposes, 1991 to 2005
Dollars in millions (constant 2007 dollars)
Year New money Percentage of total Refunding Percentage of total
1991 $146,746 62.5 $ 88,188 37.5
1992 144,697 45.3 174,969 54.7
1993 128,582 33.2 258,222 66.8
1994 139,764 59.9 93,487 40.1
1995 125,931 63.5 72,360 36.5
1996 140,312 59.1 97,179 40.9
1997 152,271 57.6 112,233 42.4
1998 192,762 54.4 161,694 45.6
1999 184,067 66.0 94,831 34.0
2000 173,223 72.0 67,385 28.0
2001 203,402 60.7 131,955 39.3
2002 227,899 54.1 193,494 45.9
2003 225,440 53.4 196,723 46.6
2004 224,850 56.7 171,688 43.3
2005 218,491 49.0 227,287 51.0
Source: GAO analysis of IRS’s Statistics of Income Division data.
Note: Totals include both governmental and qualified private activity bonds.
Tax-exempt bond issuers tend to issue more debt when interest rates
decline. Since 1991, years when interest rates were at their lowest levels
generally have corresponded with the years in which the amounts of tax-
exempt bonds issued, including bonds for refunding, were the highest. For
Page 13 GAO-08-364 Tax Policy
example, since 2002, average interest rates on tax-exempt bonds
14
have
fallen to their lowest levels since the early 1970s. During this same time
period, the dollar amount of tax-exempt bonds issued has been at the
highest level since 1993.
Figure 3 shows how changes in interest rates have corresponded with the
amounts of new money and refunding bonds. As the figure illustrates,
generally, increases in the dollar amounts of bonds that were refunded
have accompanied declines in interest rates. This indicates that municipal
governments tend to take advantage of interest rate declines to restructure
existing bond debt to obtain more attractive financing terms, such as
obtaining a lower interest rate to reduce borrowing costs. On the other
hand, changes in the dollar amounts of new bond issues do not appear to
correspond as closely to interest rate changes as the amounts of
refundings. One explanation for this could be that municipal governments
tend to issue new bonds based on current needs to finance operations and
activities, and decisions regarding new financing are likely to be less
sensitive to interest rates.
14
We used the Bond Buyer 20-Bond Index, a set of general obligation bonds maturing in 20
years, to compare interest rates on tax-exempt bonds over time.
Page 14 GAO-08-364 Tax Policy
Figure 3: Percentage Change in New Money and Refunding Issues versus Changes in Interest Rates, 1992 through 2005
Percent changes in dollar amount issued Percent changes in interest rates
-80
-60
-40
-20
0
20
40
60
80
100
20052004200320022001200019991998199719961995199419931992
-15
-10
-5
0
5
10
15
Source: GAO analysis of IRS’s Statistics of Income Division data and Thomson Financial data in the Bond Buyer Yearbook.
Year
Percent change in new money
Percent change in refunding
Percent change in interest rates
The Estimated Revenue
Loss from Outstanding
Tax-Exempt Bonds Is One
of the Largest Federal Tax
Expenditures
Because the interest earned by investors who purchase tax-exempt bonds
is generally excluded from federal income taxes, the federal government
incurs a revenue loss each year. Revenue loss estimates are based on the
total dollar value of outstanding tax-exempt bonds and not on the dollar
amounts of tax-exempt bonds issued in a given year. Both Treasury and
JCT provide estimates of the revenue loss associated with tax-exempt
bonds. Though calculated differently, both estimates show that the
revenue loss is in the billions of dollars annually.
According to our analysis of Treasury’s estimates, the revenue loss from
excluding the interest earned on tax-exempt bonds from federal income
tax is the ninth largest tax expenditure in the I.R.C. in 2007. Figure 4
shows our analysis of Treasury’s revenue loss estimates from 2000 to 2012.
The estimates indicate that the federal government could lose about
Page 15 GAO-08-364 Tax Policy
$37 billion in 2007—$25.4 billion from interest on governmental bonds and
$11.6 billion from interest on qualified private activity bonds.
15
As figure 4
shows, the estimated revenue loss from governmental bonds has
fluctuated from a high of $30.1 billion in 2003 to a low of $23.6 billion in
2006. According to our analysis of Treasury’s estimates, the revenue loss is
likely to be about $27.9 billion from governmental bonds and about
$12.6 billion from qualified private activity bonds by 2012.
15
Summing the individual tax preference estimates is useful for gauging the general
magnitude of the federal revenue involved, but it does not take into account possible
interactions between individual provisions. Despite the limitations in summing separate
revenue loss estimates, these are the best available data with which to measure the value of
tax expenditures and make comparisons to other spending programs. Other researchers
also have summed tax expenditure estimates to help gain perspective on the use of this
policy tool and examine trends in the aggregate growth of tax expenditure estimates over
time.
Page 16 GAO-08-364 Tax Policy
Figure 4: Estimated Revenue Loss from Excluding Interest Earned on Tax-Exempt Bonds from Federal Income Tax, 2000
through 2012
Dollars in billions (constant 2007 dollars)
Source: GAO Analysis of Treasury Department Estimates Printed in the President's 2002, 2004, 2006,
and 2008 Budgets, Analytical Perspectives.
Year
Qualified private activity bonds
Government bonds
0
50
10
15
20
25
30
35
40
45
2012201120102009200820072006200520042003200220012000
Note: Summing the individual tax preference estimates is useful for gauging the general magnitude of
the federal revenue involved, but it does not take into account possible interactions between
individual provisions. All data points presented are estimates, but data points for future years are also
projections.
JCT estimates also suggest a similar pattern of higher estimated revenue
losses attributable to excluding the interest earned on tax-exempt bonds
from federal gross income in future years. For example, in 2007, JCT
reported that the federal government would forgo about $27.8 billion due
to tax-exempt governmental bonds and projected that the revenue losses
would grow to about $31.9 billion in 2011. For qualified private activity
bonds, our analysis of JCT estimates shows the revenue loss increasing
Page 17 GAO-08-364 Tax Policy
from $8.6 billion in 2007 to about $10.1 billion in 2011, an 18 percent
increase.
16
Tax-exempt governmental and private activity bonds are used to finance a
wide range of facilities and activities, primarily in support of the entity
responsible for paying the bond debt service. Information describing the
types of facilities and activities that are financed with tax-exempt bonds is
available from several sources. In addition, tax-exempt governmental
bonds can be used to finance some facilities and activities for which most
tax-exempt private activity bonds cannot, including some facilities that
Congress specifically prohibited from being financed with qualified private
activity bonds.
To illustrate the wide range of purposes for which tax-exempt bonds are
used, we reviewed the most recent information available on bonds in
Thomson Financial’s Bond Buyer Yearbook and IRS’s SOI data. We also
reviewed a limited sample of official statements to further illustrate the
uses of tax-exempt bonds. Because most of the information is summarized
by broad descriptive categories, it does not fully reveal the wide range of
facilities and activities for which tax-exempt bonds can be used. Appendix
II describes the primary sources for information on the facilities and
activities financed with tax-exempt bonds.
The Bond Buyer Yearbook contains historical data and is a resource and
reference tool for portfolio managers, underwriters, financial advisors, and
other professionals seeking information on municipal bonds. As previously
stated, the yearbook does not separate information on the uses of bonds
based on whether the bonds are governmental, qualified private activity,
or taxable bonds. Nonetheless, the Bond Buyer Yearbook still provides a
general sense of the types of projects financed with tax-exempt bonds.
Table 2 summarizes Thomson Financial 2006 data in the 2007 Bond Buyer
Yearbook by 10 major categories and 48 subcategories. The table also
shows the proportion of bonds issued for each category and subcategory.
Tax-Exempt Bonds
Are Used to Finance a
Wide Range of
Facilities and
Activities
Uses of Municipal Bonds Based
on Bond Buyer Yearbook Data
16
JCT does not publish estimates for tax expenditures valued at less than $50 million per
year. As a result, JCT does not include estimates for the revenue loss associated with all
qualified private activity bonds.
Page 18 GAO-08-364 Tax Policy
Table 2: Summary of Bond Buyer Yearbook Data on Uses of Municipal Bonds Issued in Calendar Year 2006
Dollars in thousands (nominal 2006 dollars)
Category
Total
amount
Percentage of total amount
for all categories
Total
issues
Percentage of total issues
for all categories
Average
size
Development $4,891,000 1.3 387 3.0 $12,638
Industrial 2,279,900 0.6 224 1.8 10,178
Economic 2,367,300 0.6 152 1.2 15,574
Office buildings 243,800 0.1 11 0.1 22,164
Education 106,545,800 27.4 4,197 33.0 25,386
Primary 60,492,500 15.6 3,380 26.5 17,897
Higher 29,447,800 7.6 650 5.1 45,304
Student loans 16,051,200 4.1 82 0.6 195,746
Other 554,300 0.1 85 0.7 6,521
Electric power 12,897,200 3.3 177 1.4 72,866
Environmental
facilities
7,869,800 2.0 154 1.2 51,103
Pollution control 6,206,800 1.6 95 0.7 65,335
Solid waste 1,663,000 0.4 59 0.5 28,186
Recycling 0 0.0 0 0.0 0
Health care 40,102,200 10.3 827 6.5 48,491
General acute 30,871,100 7.9 518 4.1 59,597
Single specialty 475,400 0.1 20 0.2 23,770
Children’s 1,398,600 0.4 14 0.1 99,900
Equipment loans 58,400 0.0 3 0.0 19,467
General medical 1,384,400 0.4 19 0.1 72,863
Nursing homes 474,900 0.1 34 0.3 13,968
Assisted living 914,700 0.2 66 0.5 13,859
Continuing care 4,524,700 1.2 153 1.2 29,573
Housing 30,532,700 7.9 955 7.5 31,971
Single family 24,107,400 6.2 606 4.8 39,781
Multifamily 6,425,300 1.7 349 2.7 18,411
Public facilities 14,650,700 3.8 661 5.2 22,164
Libraries/museums 867,400 0.2 71 0.6 12,217
Government offices 2,968,200 0.8 121 1.0 24,531
Fire stations 366,700 0.1 93 0.7 3,943
Jails/prisons 1,418,900 0.4 62 0.5 22,885
Police stations 558,700 0.1 16 0.1 34,919
Convention centers 2,443,100 0.6 57 0.4 42,861
Page 19 GAO-08-364 Tax Policy
Dollars in thousands (nominal 2006 dollars)
Category
Total
amount
Percentage of total amount
for all categories
Total
issues
Percentage of total issues
for all categories
Average
size
Stadiums/arenas 3,996,300 1.0 31 0.2 128,913
Theaters 311,000 0.1 7 0.1 44,429
Parks/zoos/
beaches
824,800 0.2 132 1.0 6,248
Other recreation 895,600 0.2 71 0.6 12,614
Transportation 42,344,000 10.9 519 4.1 81,588
Airports 8,245,900 2.1 105 0.8 78,532
Seaports 3,008,500 0.8 48 0.4 62,677
Toll roads 14,576,500 3.8 222 1.7 65,660
Bridges 2,127,400 0.5 13 0.1 163,646
Tunnels 0 0.0 0 0.0 0
Parking facilities 510,600 0.1 49 0.4 10,420
Mass transit 13,875,000 3.6 81 0.6 171,296
Other 100 0.0 1 0.0 100
Utilities 42,014,500 10.8 1,328 10.4 31,637
Water/sewer 28,715,400 7.4 1,153 9.1 24,905
Gas works 10,741,700 2.8 27 0.2 397,841
Telephone 148,500 0.0 9 0.1 16,500
Sanitation 737,600 0.2 59 0.5 12,502
Flood control 620,000 0.2 24 0.2 25,833
Combined utilities 1,051,300 0.3 56 0.4 18,773
General purpose 86,711,000 22.3 3,526 27.7 24,592
General purpose 86,449,400 22.2 3,518 27.6 24,573
Veterans 203,800 0.1 1 0.0 203,800
Places of worship 47,900 0.0 5 0.0 9,580
Agriculture 9,900 0.0 2 0.0 4,950
Total $388,558,900 100.0 12,731 100.0 $30,521
Source: GAO analysis of Thomson Financial data in the 2007 Bond Buyer Yearbook.
As shown in table 2, the majority of municipal bonds issued in calendar
year 2006, both in terms of dollar amounts and numbers of bonds, fell in
the education and general purpose categories. Bonds categorized for
education-related purposes accounted for over 27 percent of the total
amount issued and about one-third of the number of bonds issued that
year. Bonds in the general purpose category accounted for over 22 percent
of the total dollar amount and more than one-quarter of the number of
bonds issued during 2006. In addition, nearly one-fourth of the total
Page 20 GAO-08-364 Tax Policy