Understanding Emerging Market Bonds Claude B. Erb Liberty Mutual Insurance Company pdf
Bạn đang xem bản rút gọn của tài liệu. Xem và tải ngay bản đầy đủ của tài liệu tại đây (123.83 KB, 36 trang )
Understanding Emerging Market Bonds
Claude B. Erb
Liberty Mutual Insurance Company
Campbell R. Harvey
Duke University
National Bureau of Economic Research
Tadas E. Viskanta
Draft as of: October 21, 1999
Abstract
Although emerging market bonds have been a investment option for centuries, only in the last
decade have we had the data to begin to study their behavior. According to this data emerging
market bonds have had high volatility, negative skewness and low, but increasing, correlation with
existing asset classes. Not surprisingly we find that as with other asset classes, country risk plays
an important role in the pricing of emerging market bonds. We also introduce a measure of
market sentiment for emerging market bonds. For many investors the extreme characteristics of
emerging market bonds will make it difficult for them to invest, for others we provide some insight
on means for emerging market bond investments.
2
Introduction
The 1990s emerging market bonds have seen nearly a full cycle of sentiment. Starting
with their emergence after a decade of default and turmoil. Next the strong
performance of emerging market bonds attracted considerable attention and some
measure of acceptance. Indeed, from 1991 to the summer of 1997, the average
returns on emerging market bonds in the 1990s exceeded that of the Standard and
Poor’s 500 index. At the time we argued [Erb, Harvey and Viskanta (1997a)], that any
judgment on the viability of emerging market bonds as an asset class was difficult given
1) the short history of data and 2) that characteristics were being measured over a long
bull market. Then in 1997 & 1998 the world capital markets saw two bouts of severe
economic and financial crisis. These setbacks not only produced poor returns and
some subsequent defaults. It also impeded further interest into the asset class.
Much of the research into emerging market bonds was done prior to these economic
and financial declines. A number of authors then pointed out some of the benefits to
emerging market debt. While highlighting the risks involved, Nemerever (1996), Dahiya
(1997), and Froland (1998) all made the case for investment in emerging market bonds.
None however could have foreseen the coming turmoil and shakeout.
Emerging market equities, on the other hand, have garnered a great deal more
research attention. Harvey (1995) finds that standard asset pricing models fail when
applied to these markets. Harvey attributes the failure of these models to the lack of
integration of the emerging capital markets with global capital markets. Bekaert and
Harvey (1995, 1997) propose and test models of expected returns in emerging markets
that explicitly take the degree of market integration into account. Erb, Harvey and
Viskanta (1996) propose a model of expected returns based on risk ratings in emerging
market countries.
With nearly a decade of data we are now more aware of both the opportunities and
pitfalls involved with emerging market debt. In this paper we have the following
3
objectives. First, a brief exploration of the history of emerging market lending. Second,
we examine the recent performance of emerging market bonds and note the unique
statistical properties of emerging market bond returns, including their correlation with
other asset classes. Third, we note the importance of country risk in the pricing and
returns of emerging market bonds. Fourth, we document some new statistical insights
on emerging market bonds. Finally, we note how investors and plan sponsors might
approach potential investments in emerging market bonds.
Historical Perspective
Although many of the discussions about emerging market bonds apply only to the last
decade global bond investing has a long and storied history. Through, at least, the First
World War London was the center of global finance. Although today it is hard to
believe the United States was for much of the nineteenth century viewed as an
emerging market. Not only was it emerging, but went through periodic eras of default.
According to Chernow (1990), “During the depression of the 1840s – a decade dubbed
the Hungry Forties – state debt plunged to fifty cents on the dollar. The worst came
when five American states – Pennsylvania, Mississippi, Indiana, Arkansas and
Michigan – and the Florida Territory defaulted on their interest payments.”
1
Latin American lending had already become quite widespread in the nineteenth century.
Again Chernow, “ as early as 1825 nearly every borrower in Latin America had
defaulted on interest payments. In the nineteenth century, South America was already
known for wild borrowing sprees, followed by waves of default.”
2
By the 1920s foreign
lending in the United States had once again become widespread. In fact the sale of re-
packaged foreign bonds to individual investors, and the subsequent losses, played a
role in the enactment of the Glass-Steagall Act in 1933, see Chernow (1990).
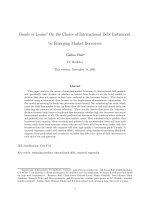
Volatility has been a hallmark of emerging market bonds throughout time. Exhibit 1a
shows the yield on Argentinean and Brazilian bonds from 1859 through 1959.
3
One
4
can clearly see periodic bouts of distress and volatility. This long-term historical
perspective allows us to put the volatile decade of the 1990s into context. Exhibit 1b
shows the stripped yields over US Treasuries for Argentina and Brazil from 1991 to
1999. Again we see both high relative yields and ample volatility.
Data
Data on the emerging market bonds is limited in large part by the short history of many
of these instruments. We have found that J.P. Morgan Securities provides an
impressive source of data on emerging market bonds and we will utilize their data
throughout this paper. They now track a number of indices including EMBI (Emerging
Market Bond Index), EMBI+, and EMBI Global. EMBI consists of U.S. dollar
denominated Brady bonds.
4
EMBI+ expands on EMBI by including other non-local
currency denominated bonds and has more restrictive liquidity requirements. As of
September 30, 1999, the EMBI Global index included bonds from 27 countries.
A related problem, recognized in regard to emerging market equities, is that of market
survivorship. Goetzman and Jorion (1999) demonstrate that emerging market equity
markets that re-emerge after a period of dormancy have higher returns for some initial
period greater than their long-term expected return. The upward bias should also be
evident in emerging market bond markets as well. The aftermath of debt renegotiation
and market liberalization drove returns for a period above their sustainable long-term
average. Therefore, these data need to be interpreted with great care.
J.P. Morgan also produces the ELMI+ (Emerging Local Market Index) a local currency
denominated money market index that covers 24 countries. It differs from the earlier
indices in a number of respects. First it contains securities denominated in each
country’s local currency. Second, the index has a short duration (48 day average life as
of September 30, 1999). Third the country composition differs materially from the hard
currency indices. To date most foreign emerging market investment has been in the
5
longer duration hard currency bonds. However, given the problems many emerging
markets suffered due to the currency mismatch between their revenues and debt
service requirements we should not be surprised to see a preference towards local
currency denominated debt.
5
The issue will be finding investors willing to take on that
not inconsiderable currency risk.
Risk and Expected Returns of Emerging Market Bonds
We need to exercise some caution in any historical analysis of emerging market bond
performance. The J.P. Morgan EMBI index dates back only to January 1991. Whereas
returns data for emerging market equities, from the International Finance Corporation
(IFC), dates back to 1976. There are great dangers to drawing inferences on such
short samples. For example, in the summer of 1997 the average performance of the
EMBI index exceeded that of the S&P 500 and considerably exceeded that of the U.S.
high yield index. Such return differentials were often used to promote investment in
emerging market bonds.
Two years makes a huge difference. Both emerging market equities and bonds were
subject to massive sell-offs beginning in August 1997. Average returns have decreased
and volatility has increased.
Exhibit 2a shows that emerging market bonds (JPM EMBI) stand out in the northeast
portion of the graph.
6
Over the January 1991 to September 1999 period emerging
market bonds have higher returns than emerging market equities (IFCG and IFCI) and
U.S. high yield corporate debt (CSFB High Yield). The return advantage, however,
came with the cost of higher volatility which we will see for emerging market bonds is
largely idiosyncratic in a style analysis framework.
Exhibit 2b shows that emerging market bonds (JPM EMBI, EMBI+ & EMBIG) continue
to stand alone in the northeast part of the graph. Over the January 1994 to September
6
1999 period emerging market bonds continue to have higher returns than emerging
market equities (IFCG and IFCI) and U.S. high yield corporate debt (CSFB High Yield).
However the advantage over domestic high yield has narrowed dramatically and comes
at the expense of substantially higher volatility.
In both graphs it is also evident that emerging market bonds have considerably smaller
market capitalization than other major global asset classes. This is demonstrated by
the size of the bubble on either Exhibit 2a or 2b which represents the relative US$
market capitalization as of September 1999. It is hard to even compare emerging
market bonds with major equity indices (S&P 500, MSCI EAFE) or major bond indices
(Lehman Aggregate or the JP Morgan Non-US GBI). More apt comparisons for
emerging market bonds include domestic high yield bonds (CSFB High Yield) or
emerging market equities (IFCI or IFCG). Again there remains a market capitalization
gap, but it at least we are in the order of magnitude. JP Morgan’s EMBI Global is
however a larger opportunity set given its inclusion of a number of countries excluded
from its prior standard benchmark, EMBI+.
Distributional Characteristics of Emerging Market Bonds
Research into the distributional characteristics of emerging market equities has shown
significant deviations from normality. Bekaert and Harvey (1997) and Bekaert et al.
(1997) demonstrate that emerging market equities exhibit skewness and excess
kurtosis. They show that given a typical investor's preferences optimal investment
weights should reflect the asset’s contribution to portfolio skewness.
The intuition for this is straightforward. People like assets that deliver high positive
skewness and are willing to accept low (or even negative) expected returns for these
assets (lottery tickets, option payoffs). Investors do not like negative skewness. To take
on negative skewness, investors demand a higher expected return.
7
7
One difficulty with measuring skewness is that it likely changes through time. Therefore
looking at past data may give no indication of future expected skewness. This is the so-
called “peso problem” in economic theory. Looking at past currency movements, you
may see little variation in rates during a managed float regime. However, there is a
probability of a devaluation that you cannot detect from looking at past data. This is just
the definition of negative skewness.
This issue of not being able to detect negative skewness using past data does not
appear to be relevant for emerging market bonds. For example, in the January 1991 to
May 1997 period, the EMBI has a negative skewness of -0.8. In the January 1994 to
May 1997 period, the negative skewness is -0.6. During this same period, the EMBI+
has a negative skewness of -0.8. There was considerable evidence - before the
emerging market meltdown - that emerging market bonds possessed negative
skewness. This negative skewness is consistent with the high expected returns.
The events beginning in the summer of 1997 caused an even greater measured
negative skewness. Exhibit 3a shows that the skewness for the EMBI portfolio in the
January 1991 to September 1999 period is -1.9. From January 1994 to September
1999 we seek skewness of –1.6, -2.0 and –2.0 for EMBI, EMBI+, and EMBI Global
respectively.
We can see in Exhibit 3b that this skewness is driven in part by a large negative
observation. This –25.6% return for EMBI in August 1998 is quite visible at the left
hand part of the graph. However even when we exclude this observation from the
entire January 1991 to September 1999 sample we still see skewness of –0.8.
Asset Class Correlations
In Exhibit 4 presents the correlation of J.P. Morgan's EMBI index with other asset
classes. The sub-periods capture the results leading up to the initial emerging market
8
crisis, and the subsequent time period. We use EMBI because it has the longest
history. The results would not be affected by the use of broader benchmarks, because
the correlation between EMBI and EMBI+ or EMBI Global is very high at 0.98, and 0.99,
respectively.
Examining the data through July 1997, one notices that the highest correlations are with
the two IFC emerging market indices. Correlations against other U.S. dollar bond
indices hover around 0.40 up to July 1997. A first glance at the data suggests that
emerging market bonds are somewhat unique in their return patterns. However, there is
an extraordinary shift in the patterns when the most recent data is examined.
Contrasting the period up to July 1997 to the 26 months afterwards, the correlation with
the CSFB high yield index increases over 50 percent. The correlation with the S&P 500
is greater than 0.75 and is only slightly smaller than the IFC indices. The correlation
with the government bond indices shifts from positive in the earlier period to negative in
the most recent period.
Another way of approaching this question is to examine emerging market bond returns
in a multivariate setting. We choose a Sharpe-style attribution methodology to examine
both the overall and time-series properties of the asset class.
8
If we can determine
which asset classes that emerging market bonds correlate with, we gain a better
understanding of what role they might play in a portfolio context.
Exhibit 5a & 5b shows the results for an analysis from January 1991 to September
1999. Over the full sample, the largest contributor to variation in emerging market debt
returns is the IFC index. The CSFB High Yield index is the second most important
followed by the S&P500 and long-term U.S. government bonds.
One can see in Exhibit 5b that emerging market bonds have gone through three distinct
phases. The first phase which ends around June 1995 is characterized by a great deal
of volatility in asset class contributions. The CSFB High Yield index begins as the most
9
prominent contributor. This should not be surprising because initially emerging market
bonds were viewed, and sold, as a viable domestic high yield substitute. Emerging
market bonds began showing up in what were previously purely domestic portfolios.
High yield bonds eventually give way to the IFC Investable and Lehman Long Term
Government Bond Index. This period has the lowest R-squares averaging some 54%.
9
In this next period from July 1995 to September 1997 emerging market bonds are
described solely by two asset classes: emerging market equities and long term US
treasuries. This period finds volatility decreasing and the sovereign spreads on
emerging market debt steadily decrease to what would be their historic low in
September 1997. The explanatory power of these asset classes increases to some
63%.
That era of relative tranquility gives way to a crisis filled period. The returns on
emerging market bonds effectively decouple from the US treasuries and are now
associated with three major asset classes: emerging market equities, US equities and
US high yield reappears as an influence. We see the highest R-squares of around
71%.
From this analysis we can see that over as short a period as a decade we cannot truly
summarize the asset class influences on emerging market bonds. It clearly depends on
the type of return regime expected. If emerging market bonds return to a more placid
period we would expect to see a higher correlation with US treasuries and a continued
influence of emerging market equities.
Bonds and Equities
Are emerging market equities and bonds substitutes? Intuition suggests that high yield
bonds should behave similarly to equities - especially in times of distress. Our intuition
is that emerging market stocks and bonds should have higher intra-market correlations
10
than those in the developed markets due to their country specific risk. This would allow
an investor the chance to more readily substitute bonds and stocks within an emerging
country. This could be very helpful in markets where liquidity and/or investability are
issues.
Kelly, Martins and Carlson (1998) document this exact relationship between emerging
market equities and bonds. They find that the lower a country’s perceived
creditworthiness the higher the correlation between its bond and equity markets. They
also document the fact that credit shocks, both positive and negative, have had the
anticipated effect on correlations.
Exhibit 6 details the equity-bond correlations for 18 countries and the major emerging
market bond and equity indices. We report three sub-periods: January 1994-September
1999, January 1994-July 1997 and August 1997-September 1999. The third period
isolates the emerging market sell-off and subsequent rebound.
The correlations are generally high which is consistent with our intuition. The most
striking pattern in Exhibit 6 is the increase in the intra market correlations during the
most recent period. Brazil, Peru, South Korea and Venezuela all show increased intra
market correlations. For the index as a whole, the correlation increases from 0.73 in the
period up to July 1997 to 0.84 over the last 26 months.
It is also the case that intra-market bond-equity correlations increase with perceived
risk. This relationship is documented in Kelly, Martins and Carlson (1998) and Erb,
Harvey and Viskanta (1999). In Exhibit 7 we can see that for the period January 1994
to September 1999 intra-market bond versus equity correlations increase as
creditworthiness decreases, as measured by the Institutional Investor Credit Ratings.
Were it not for two prominent outliers (Morocco and Nigeria) the R-square measure
would increase from 11% to 50%. One can also see that the bond-equity correlations
for the developed and emerging markets are substantially (nearly 0.60) different.
11
Country Risk Ratings and Emerging Market Bonds
As with all types of debt, investors in the emerging markets need to concern themselves
with three primary sources of risk. The first is interest rate risk. This issue is non-trivial
in regard to some emerging market bonds. Some of the bonds issued through loan
restructurings have complex structures that need to be properly modeled to capture the
interest rate sensitivities. This becomes all the more important because many emerging
market bonds have relatively long durations. The second risk is currency risk. We
have not focused on currency risk because most of our analysis focuses on U.S. dollar
based debt. However, as mentioned earlier, local currency bond issuance will likely
grow in the future. Hence, the management of currency risk will undoubtedly become
more important over time.
The third type of risk is sovereign, or country risk. The countries in the emerging
market bond arena cover not only a wide geographic area, but also cover a wide range
of situations. For example most observers would recognize that the issues facing Brazil
are quite different from those facing Russia or the Philippines. Accordingly researchers
are focusing more effort on explaining the pricing of sovereign risk and how various
services rate and rank sovereign risk.
Eichengreen and Mody (1997) study the fundamental determinants of yield spread on
emerging market debt. They determine that sentiment has played a key role in
determining emerging market bond spreads from 1991-1996. Cantor and Packer
(1996) examine the factors that go into determining sovereign ratings. They find that
macroeconomic factors are able to explain a large amount of the variation in commonly
used sovereign ratings. They also examine the impact of changes in ratings on
sovereign credit spreads. Dym (1997) also uses a model to derive credit sensitivities
for a number of emerging markets and uses them to create a credit model investment
strategy. Purcell (1996), also focuses on the emerging markets, examines the sources
of sovereign risk and their role in emerging market bond investing. Erb, Harvey, and
12
Viskanta (1997b) model various commercial rating services' country risk ratings using
macroeconomic variables, and examine their use in the portfolio management process.
A simple way of testing the value of publicly available country risk ratings is to use them
to form portfolios. In Exhibit 8 we show the results of a portfolio simulation using the JP
Morgan EMBI Global universe of countries. Every month we sort the countries into two
portfolios based on the prior month’s ICRG Composite Rating. One can see that the
riskier portfolio outperformed the less risky portfolio and the benchmark. However this
came with substantially higher volatility, and beta. In addition the most recent high risk
sort includes: Algeria, Brazil, Colombia, Cote d'Ivoire, Croatia, Ecuador, Lebanon,
Malaysia, Nigeria, Russia, South Africa, Turkey and Venezuela. While this exercise
does not necessarily provide us an investable strategy it does give us some confidence
for country risk to discriminate between high and low expected return countries.
Given this research, we should not be surprised to see that perceptions of country risk
are reflected in sovereign yields and country bond returns. Erb, Harvey, and Viskanta
(1996b) show that commonly used country risk ratings do an impressive job in
explaining the cross-section of real yields in a sample of developed market bonds. In
the emerging markets we study bonds denominated in U.S. dollars. This allows us to
directly examine cross-country yield spreads over the appropriate (maturity-adjusted)
Treasury yields.
Exhibit 9 shows the relation between Institutional Investors’ Country Credit Ratings and
the spread over U.S. Treasuries for the EMBI Global universe of countries. To simplify
the analysis, and to keep it in two dimensions, we estimated for each country the
spread over Treasuries for a four year spread duration.
10
This has important ramifications for the type of analysis investors need to undertake.
To add value above and beyond a given benchmark, an analyst needs to concern him
or herself with the reasons behind the deviations from the calculated relationship
between spreads and risk ratings. For outliers deciding whether the market is
13
improperly estimating country risk or mispricing certain bonds is the key to active
emerging market bond selection.
Part of the issue may be the market is already anticipating credit risk adjustments. In
Exhibit 10 we list the countries in the major emerging market indices, Political Risk
Service’s International Country Risk Guide Composite Rating, ICRG’s one year forecast
Composite Rating, and contemporaneous and forecasted yield spreads. Towards the
bottom of the table one can see that Political Risk Services is forecasting reversals of
fortune for Thailand (down) and Turkey (up). Forecasting future risk profiles adds
another dimension to the analyst’s job in active bond management.
Slope of the Sovereign Yield Curve
The issue of pricing emerging market bonds is an important one not only for its own
sake, but also for our understanding of other emerging market assets. All financial
valuation models require some estimate of the discount function. Understanding the
dynamics of emerging market interest rates can help in accurately discounting cash
flows in the emerging markets. Analysts have recognized in the emerging markets an
upward sloping term structure of sovereign (interest rates over comparable U.S.
Treasuries) spreads in many of the emerging markets. We can this is in Exhibit 11 we
can see that this credit yield curve is upward sloping in a number of major emerging
markets.
In this example, which only covers Eurobonds so as to keep credit comparable among
a country’s bonds, we see that there are exceptions to the rule. Distress tends to invert
this curve. Prominent examples of this at the moment are Ecuador and Russia (not
shown). In Exhibit 11 Venezuela also seems to be significantly inverted.
However this notion of an upward sloping sovereign yield curve is contrary to theory for
risky issuers. Helwege and Turner (1999) survey the literature and find theoretical and
14
empirical support for inverted credit yield curves. However in their research they find
that once credit quality is held constant for any given issuer, the credit yield curve
slopes upward. Although this topic requires additional study, we can have some added
confidence that this general notion of upward sloping yield curves in the emerging
markets is confirmed in other risky bond markets as well.
Emerging Market Bond Sentiment
Just as we confirmed this notion of upward sloping sovereign yield curves in another
setting, we also can find a measure of emerging market sentiment in another market as
well. Many analysts view the premium (or discount) on closed-end funds as a
sentiment measure of small investors. While we do not have the data to confirm the
composition of ownership of domestically traded closed-end emerging market bond
funds we can still examine the collective premium/discount on these funds and see if it
has some ability to discriminate among return regimes.
In Exhibit 12 we can see the average premium on (up to) ten domestic closed-end
emerging market bonds funds plotted against the JP Morgan EMBI+ total return index
on a weekly basis. From this graph we can see that investors tend to bid up premiums
during times of distress and reduce premiums during periods of relatively positive
market returns. This relationship seems to point to investors’ having a preference for
yield stabilization, i.e. when NAVs are high, market prices are low, when NAVs are low,
market prices are high.
It is interesting to note that it took the crisis in the Autumn of 1997 and the Summer of
1998 to really shift sentiment dramatically from its period of relative tranquility. This
measure can provide emerging market bond investors with an indicator not dependent
upon bond prices themselves. Another sentiment measure worth examining would be
the relative in and outflows from dedicated open-end emerging market bonds funds.
While neither of these would be a precise timing tool, they could be helpful in gauging
15
market sentiment.
Of course, the closed-end fund discount/premium need not simply reflect sentiment.
Bekaert and Urias (1996) link the discount/premium to the degree of integration and
diversification potential of closed-end country funds. While Arora and Ou-Yang (1999)
present a dynamic model of premia and discounts on closed-end funds within a rational
expectations framework.
Portfolio Context
For many investors the numerous practical issues involved with emerging market bonds
will prevent them from making any sort of strategic commitment. Indeed there are a
number of reasons to bypass emerging market bonds, starting with their small relative
market capitalization and limited liquidity. Emerging market bond returns are also highly
volatile and negatively skewed. From a practical perspective emerging market bond
investments require additional analytic capabilities to cover some two dozen countries
and markets. For these reasons, and more, many investors will find the costs outweigh
the potential benefits of investing in what is a minor world investment opportunity.
For others the potential return opportunities are simply too large to ignore. In a world of
low single digit equity risk premia, the nearly 1000 basis point sovereign spread on
EMBI Global, as of September 30, 1999 begins to look attractive. For those investors,
and others, there are some practical issues involved with emerging market bonds that
need to be addressed.
The first issue is one of benchmark selection. As with many asset-class benchmarks
the issue of benchmark efficiency is an obvious one. For example JP Morgan had, until
recently, certain liquidity requirements for inclusion in their indices. This led to
benchmarks that were highly weighted towards Argentina, Brazil. Even in their
expanded benchmark, EMBI Global, these three countries make up 55% of the index.
16
For many investors this sort of concentration is simply not acceptable. JP Morgan has
addressed this issue with EMBI Global Constrained that attempts to limit this
overconcentration. With Argentina, Brazil and Mexico falling to some 36% of the index.
However many investors will feel more comfortable with a self-structured portfolio. This
is already a common practice with emerging market equity portfolios and can applied to
emerging market bonds as well.
11
For example, an investor could structure a
benchmark so as to target a specific level of country risk, or limit any individual
country’s benchmark weight.
Given that a strategic commitment to emerging market bonds may not be feasible,
many investors have tried to squeeze emerging market bonds into a related asset class
in the hope of at least capturing some of the inherent return opportunities.
Unfortunately this is a business risk given the high tracking errors between emerging
market bonds and domestic high yield and non-US government bond indices. For
example from January 1994 to September 1999 EMBI Global had annualized tracking
errors of 17% and 22%, respectively, with the CS First Boston High Yield index and the
JP Morgan Non-US Government Bond index. This makes the tactical decision between
emerging market bonds and its asset class partners particularly treacherous.
However some have concluded that investing in emerging market bonds in conjunction
with emerging market equities is a viable solution, for example see Kelly, Martins and
Carlson (1998). From January 1994 to September 1999 JP Morgan EMBI Global and
IFC Investable had an annualized tracking error of 15%. While still highly variable it
seems that this is a more feasible solution. There are other benefits from a balanced
emerging market portfolio including potentially greater liquidity and greater
diversification opportunities.
Conclusions
Despite nearly a decade of data, there is much left to learn about emerging market
17
bonds. As we have seen the character of emerging market bond returns has been
highly variable through time. In relatively good times, emerging market bonds seem to
have rather unique return characteristics. However, in times of crisis, they are highly
correlated with equity markets. The bonds have shown negative skewness that if
expected to continue, needs to be compensated for in terms of higher expected returns.
For many potential investors this combination of a relatively small market capitalization,
high volatility, and negative skewness makes it impractical to invest in emerging market
bonds.
Despite this, many emerging markets will require continuing capital inflows. The bond
markets seem to be a preferred way of funneling capital to sovereign and quasi-
sovereign entities. Undoubtedly the crises of 1997 and 1998 have made it difficult for
many investors to view emerging markets as a viable investment opportunity. Hopefully
this paper has provided some insights on the recent history in emerging markets and
has highlighted the issues involved in emerging market bond investments going
forward. Although the emerging bond markets are no longer priced at crisis levels,
neither have they regained the level of complacency seen in the Autumn of 1997.
Given the volatile history of these markets over the past decade, this middle ground
may, in fact, be a reasonable starting point for the next decade.
1
Chernow, Ron, The House of Morgan, 1990, Simon & Schuster: New York, p. 5.
2
Ibid, p. 71.
3
Although one can argue that Argentina was at the time a relatively well developed country. Its equity market
capitalization in the early 1920s exceeded that of England.
4
Brady bonds are those bonds issued under a Brady Plan restructuring. A Brady Plan debt restructuring, named
after former U.S. Treasury Secretary Nicholas Brady, generally exchanges debt for freely traded bonds, reduces the
overall level of debt and interest payments, and often offers new bonds with a pledge of U.S. Treasury zero-coupon
bonds.
5
See Harvey and Roper (1998).
6
Abbreviation Index
CSFB High Yield Credit Suisse First Boston High Yield Bond Index
IFCI International Finance Corporation Investable Composite
IFCG International Finance Corporation Global Composite
JPM EMBI J.P. Morgan Emerging Market Bond Index
JPM EMBI+ J.P. Morgan Emerging Market Bond Index Plus
JPM EMBIG J.P. Morgan Emerging Market Bond Index Global
JPM Non-US GBI J.P. Morgan Non-US Global Bond Index (unhedged)
Lehman Aggregate Lehman Brothers Aggregate Bond Index
18
Lehman LT Government Lehman Brothers Long Term Government Bond Index
Lehman IT Government Lehman Brothers Intermediate Term Government Bond Index
MSCI EAFE Morgan Stanley Capital International Europe, Australasia, and Far East Index
S&P 500 Standard and Poor's 500 Index
Wilshire 4500 Wilshire Associates 4500 Stock Index
7
In the context of a portfolio, we measure the contribution to the skewness of a portfolio, or coskewness. This
measure is analogous to the beta for contribution to variance. See Harvey and Siddique (1999).
8
The asset class factor model seeks to explain the target returns using a pre-defined set of asset class returns. This
can give us some insight into the strength of the relationship between asset classes. See Sharpe (1992) for an
introduction to the style measurement process.
9
Strictly speaking, the R-square statistics from a Sharpe style analysis are not true r-square statistics.
Because of the constraints on the analysis, at best we should characterize them as quasi-R-squares.
10
For each country we used the spread over Treasuries and spread duration for a number of sovereign bonds in
each country. We then fit a linear regression for each country and calculated the spread over Treasuries for a four
year duration. We chose four years because that approximates the overall spread duration on the J.P. Morgan
EMBI Global index.
11
See Masters (1998) for a discussion of the issues involved with emerging market equity indices. Many
of these same issues are present with any emerging market bond index.
19
ACKNOWLEDGEMENTS
Much of this material was originally published as “New Perspectives on Emerging Market Bonds” in the
Winter 1999 edition of the Journal of Portfolio Management, and was presented at the 1999 International
Investment Forum meeting. The authors would like to thank Brian Mitchell at J.P. Morgan Securities, Inc.
and Andrew Roper for their assistance.
BIBLIOGRAPHY
Arara, Navneet and Hui Ou-Yang, "Closed-End Funds: A Dynamic Model of Premia and Discounts,"
Working paper, University of North Carolina at Chapel Hill, 1999.
Bekaert, Geert, and Campbell R. Harvey, "Time-Varying World Market Integration," Journal of Finance,
1995, Vol. 50 No. 2, pp. 403-444.
Bekaert, Geert, and Campbell R. Harvey, "Emerging Equity Market Volatility," Journal of Financial
Economics, 1997, Vol. 43 No. 1, pp. 29-77.
Bekaert, Geert, Claude B. Erb, Campbell R. Harvey, and Tadas E. Viskanta, "Distributional Characteristics
of Emerging Market Equities and Asset Allocation," Journal of Portfolio Management, Winter 1998, pp.
102-116.
Bekaert, Geert and Michael Urias, "Diversification, Integration and Emerging Market Closed-end Funds,"
Journal of Finance, 1996, Vol. 51 No. 3, pp. 835-869
Bernstein, Robert J., and John A. Penicook Jr., “Emerging Market Debt: Practical Portfolio
Considerations”, in Emerging Market Capital Flows, Richard Levich (Ed.), Stern School of Business, New
York University, 1998, Kluwer Academic Publishers, pp. 335-373.
Chernow, Ron, The House of Morgan, 1990, Simon & Schuster: New York.
Dahiya, Sandeep, “The Risks and Returns of Brady Bonds in a Portfolio Context,” Financial Markets,
Institutions & Instruments, Vol. 6 No.5, December 1997, pp. 45-60.
Dym, Steven, "Country Risk Analysis for Developing Country Bond Portfolios," Journal of Portfolio
Management, Winter 1997, pp. 99-103.
Eichengreen, Barry, and Ashoka Mody, “What Explains Changing Spreads on Emerging Market Debt:
Fundamentals or Market Sentiment?” 1997, Working Paper.
Erb, Claude B., Campbell R. Harvey, and Tadas E. Viskanta, "Expected Returns in 135 Countries,"
Journal of Portfolio Management, Spring 1996, pp. 46-58.
Erb, Claude B., Campbell R. Harvey, and Tadas E. Viskanta, "The Influence of Political, Economic and
Financial Risk on Expected Fixed Income Returns," Journal of Fixed Income, September 1996, pp. 7-31.
Erb, Claude B., Campbell R. Harvey, and Tadas E. Viskanta, 1997a, “Emerging Market Bonds: A Global
Perspective”, Proceedings of the Association for Investment Management and Research Financial
Analysts Seminar, Northwestern University, July 24, 1997.
Erb, Claude B., Campbell R. Harvey, and Tadas E. Viskanta, Country Risk in Global Financial
Management, Research Foundation of the Institute for Chartered Financial Analysts, Charlottesville, VA,
1997b.
Erb, Claude B., Campbell R. Harvey, and Tadas E. Viskanta, "A New Perspective on Emerging Market
Bonds," Journal of Portfolio Management, Winter 1999, pp. 83-92.
20
Froland, Charles, “Opportunities for Institutional Investors in Emerging Market Debt,” Journal of Pension
Plan Investing, Vol. 2 No.3, Winter 1998, pp. 84-99.
Goetzmann, William and Phillipe Jorion, “Re-Emerging Markets,” Journal of Financial and Quantitative
Analysis, March 1999, pp.
Harvey, Campbell R., 1995, “Predictable Risk and Returns in Emerging Markets,” Review of Financial
Studies, Fall 1995, pp. 773-816.
Harvey, Campbell R. and Andrew Roper, 1998, “The Asian Bet”, Unpublished working paper, Duke
University, Durham, NC.
Harvey, Campbell R. and Akhtar Siddique, “Conditional Skewness in Asset Pricing Tests,” Journal of
Finance, 1999, forthcoming.
Helwege, Jean and Christopher M. Turner, “The Slope of the Credit Yield Curve for Speculative-Grade
Issuers,” Journal of Finance, October 1999, pp.
Kelly, Jonathan M., Luis F. Martins, and John H. Carlson, “The Relationship Between Bonds and Stocks in
Emerging Countries,” Journal of Portfolio Management, Spring 1998, pp. 110-122.
Masters, Seth, “The Problem with Emerging Market Indexes,” Journal of Portfolio Management, Winter
1998, pp. 93-100.
J.P. Morgan Securities Inc., "Emerging Market Bond Index Monitor," September 1999.
Nemerever, William L., "Opportunities in Emerging Market Debt," in Investing Worldwide VII: Focus on
Emerging Markets, Association for Investment Management and Research, Charlottesville, VA, 1996.
Purcell, John F. H., "Sovereign Risk in Emerging Markets," in Investing Worldwide VII: Focus on
Emerging Markets, Association for Investment Management and Research, Charlottesville, VA, 1996.
Sharpe, William F., "Asset Allocation: Management Style and Performance Measurement," Journal of
Portfolio Management, Winter 1992, pp. 7-19.
Taylor, II, Brian, Guide to the Global Financial Database, Third Edition, 1997.
Exhibit 1a
Historical Perspective
Long Term Historical Yields
0
2
4
6
8
10
12
14
16
1859
1864
1869
1874
1879
1884
1889
1894
1899
1904
1909
1914
1919
1924
1929
1934
1939
1944
1949
1954
1959
Simple Yield (%)
Argentina
Brazil
USA
Semi-Annual Observations
Source: Global Financial Database
Exhibit 1b
Historical Perspective
Recent Yields
0
2
4
6
8
10
12
14
16
18
20
22
1990:12
1991:04
1991:07
1991:11
1992:02
1992:06
1992:09
1992:12
1993:04
1993:07
1993:11
1994:02
1994:06
1994:09
1995:01
1995:04
1995:08
1995:11
1996:03
1996:06
1996:09
1997:01
1997:04
1997:08
1997:11
1998:02
1998:06
1998:09
1999:01
1999:04
1999:08
JPM EMBI Index Sovereign Spread (%)
EMBI
Argentina
Brazil
Weekly Observations
Source: JP Morgan Securities, Inc.
Exhibit 2a
World Capital Markets
Risk, Return and Relative Capitalization
0%
2%
4%
6%
8%
10%
12%
14%
16%
18%
20%
22%
0% 5% 10% 15% 20% 25%
Annualized Volatility
Annualized Average Return
Data: Monthly US$ Total Returns (1991:01-1999:09)
S&P 500
Wilshire 4500
JPM EMBI
CSFB High Yield
Lehman LT Govt
Lehman IT Govt
Lehman Aggregate
JPM Non-US GBI
MSCI EAFE
IFCI
IFCG
Exhibit 2b
World Capital Markets
Risk, Return and Relative Capitalization
-15%
-10%
-5%
0%
5%
10%
15%
20%
25%
30%
0% 5% 10% 15% 20% 25%
Annualized Volatility
Annualized Average Return
Data: Monthly US$ Total Returns (1994:01-1999:09)
S&P 500
Wilshire 4500
JPM EMBIG
CSFB High Yield
Lehman LT Govt
Lehman IT Govt
Lehman Aggregate
SB Non-US WGBI
MSCI EAFE
IFCI
IFCG
JPM EMBI+
JPM EMBI
Exhibit 3a
World Capital Markets
Skewness
-2.5
-2.0
-1.5
-1.0
-0.5
0.0
0.5
1.0
JP Morgan
EMBI
JP Morgan
EMBI+
JP Morgan
EMBIG
CSFB High
Yield
Lehman
Aggregate
Lehman IT
Goverment
Lehman LT
Government
JP Morgan
Non-US GBI
S&P 500
Wilshire
4500
MSCI EAFE
IFC Global
IFC
Investable
Skewness
1991:01-1999:09
1994:01-1999:09
Data: Monthly US$ Total Returns