GLOBAL WEALTH REPORT 2012 ppt
Bạn đang xem bản rút gọn của tài liệu. Xem và tải ngay bản đầy đủ của tài liệu tại đây (2.46 MB, 64 trang )
Research Institute
Thought leadership from Credit Suisse Research
and the world’s foremost experts
October 2012
Global Wealth
Report 2012
Contents
03 Introduction
04 Global wealth overview
08 Household wealth: A global portrait
16 The global wealth pyramid
22 Household debt
31 Inheritance of wealth
38 What will the future bring?
45 Wealth of nations
46 United States
47 Japan
48 China
49 India
50 France
51 United Kingdom
52 Switzerland
53 Russia
54 Singapore
55 Korea
56 Indonesia
57 South Africa
58 Chile
59 Brazil
60 Australia
61 Canada
62 Authors
63 Disclaimer / Imprint
COVERPHOTO: ISTOCKPHOTO.COM/CHRIS HEPBURN, PHOTO: ISTOCKPHOTO.COM/COTESEBASTIEN
For more information, please contact:
Richard Kersley, Head of Global Research
Product, Credit Suisse Investment Banking,
Michael O’Sullivan, Head of Portfolio
Strategy & Thematic Research,
Credit Suisse Private Banking
michael.o’
GLOBAL WEALTH REPORT 2012_2
Introduction
The Credit Suisse Global Wealth Report and the more detailed
accompanying Global Wealth Databook aim to provide the most
comprehensive study of world wealth. Unlike other studies, they
measure and analyze trends in wealth across nations, from the
very bottom of the “wealth pyramid” to ultra high net worth
individuals.
This third Wealth Report continues our close collaboration
with Professors Anthony Shorrocks and Jim Davies, recognized
authorities on this topic, and the architects and principal authors
of “Personal Wealth from a Global Perspective,” Oxford
University Press, 2008.
The last two Wealth Reports painted a detailed picture of fast-
rising wealth in the emerging world. This year in the context of
the debate on the “fiscal cliff” and the Eurozone crisis, we
change tack and focus on indebtedness by bringing our unique
data set of household debt to bear.
Using new wealth data, we review past trends in household
debt, and combine household and government debt to highlight
which countries have sustainable overall debts levels and which
have most problems with government debt.
Another new focus is inheritance, an important aspect of
wealth transfer. Sixty-nine percent of Forbes billionaires are
self-made, with less than one-third having inherited their wealth,
although if we exclude China, Russia and the other transition
countries, this figure rises to slightly above one-third. Moving
beyond billionaires to look at all households in the OECD, the
data are not precise, but our work suggests that 30%–50% of
their wealth is inherited.
Overall, we estimate that global household wealth in mid-
2012 totaled USD 223 trillion at current exchange rates,
equivalent to USD 49,000 per adult globally. Looking ahead, and
assuming moderate and stable economic growth, we expect total
household wealth to rise by almost 50% in the next five years
from USD 223 trillion in 2012 to USD 330 trillion in 2017. The
number of millionaires worldwide is expected to increase by
about 18 million, reaching 46 million in 2017. We expect China
to surpass Japan as the second wealthiest country in the world.
However, the USA should remain on top of the wealth league,
with USD 89 trillion by 2017.
The Credit Suisse Global Wealth Report lays the foundation
for a long-running examination by the Credit Suisse Research
Institute of one of the crucial research areas in economics, and
a vital driver of future megatrends. Moreover, it continues the
thought leadership and proprietary research undertaken by the
Research Institute over the past three years.
Hans-Ulrich Meister
Chief Executive Officer Credit Suisse Private Banking &
Chief Executive Officer Credit Suisse Switzerland
GLOBAL WEALTH REPORT 2012_3
Changes to household wealth between
mid-2011 and mid-2012
The economic uncertainties of the past year – par-
ticularly those affecting Eurozone countries – have
cast a large shadow over household wealth. Eco-
nomic recession in many countries, combined with
widespread equity price declines and relatively
subdued housing markets, has produced the
worst environment for wealth creation since the
outbreak of the financial crisis. As a consequence,
total global household wealth fell by 5.2% to USD
223 trillion between mid-2011 and mid-2012, the
first annual decline since the financial crisis of
2007–2008. However, prospects are not as
gloomy as this result might suggest because the
overall drop is attributable to the appreciation of
the US dollar. Based on constant exchange rates,
aggregate global household wealth actually rose
by about 1% over the last year – not an impressive
performance compared to recent years, but still
better than expected, given the challenging eco
-
nomic environment.
Europe was responsible for USD 10.9 trillion of
the total global loss of USD 12.3 trillion (see Table
1). Even with constant exchange rates, total house-
hold wealth in Europe fell by about USD 1 trillion.
Asia-Pacific (excluding China and India) was the
other big regional loser, shedding USD 1.3 trillion
on the back of the dollar appreciation. Other losses
in Africa, India and the Latin American countries
were offset by modest gains in North America (USD
880 billion) and China (USD 560 billion), which had
a relatively quiet time compared with recent years in
which wealth growth in China has averaged 13%
per annum since 2000. The latest wealth estimates
indicate that by mid-2011, all regions (except
Africa) had fully recovered from the financial crisis;
however, Europe and India have now dropped back
below the level achieved in 2007.
Asset price changes
Financial assets and non-financial assets (e.g. real
estate) contributed roughly equal amounts to the
decline in gross household wealth, and both com-
ponents decreased in all regions of the world apart
from North America and China. The percentage
decline in financial assets was especially prominent
in India and Europe, although Africa and Latin
America also registered drops of roughly 10%. In
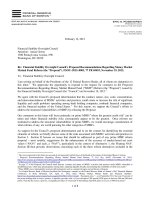
some respects, the situation could have been much
worse. In the 12 months to mid-2012, equity prices
in many regions of the world fell substantially rela-
tive to their levels in mid-2011. The extent of the
decline is evident from the data displayed in Figure
1, which shows that market capitalization fell in all
the G8 countries as well as in China and India, and
that the decline exceeded 10% in half of these
countries. While Italy tops the list with a 23% drop,
greater declines were experienced in Finland, Ban-
gladesh, Austria, Romania, Spain and Israel. Mar-
ket capitalization fell by more than 30% in Portugal
and Ukraine, and by more than 40% in Argentina,
Global wealth
overview
The Credit Suisse Global Wealth Report aims to provide the most
reliable and comprehensive data on global household wealth, covering
all components of wealth and spanning the entire wealth spectrum,
from very wealthy individuals to the less well-off. Subdued economic
growth and collapses in equity prices have made the past year a
challenging one for wealth creation and preservation. In this chapter,
we review important aspects of the recent economic environment
and highlight some of the topics discussed later in the report.
PHOTO: KEYSTONE/CHROMORANGE/TIPSIMAGES GUIDO/ALBERTO ROSSI
GLOBAL WEALTH REPORT 2012_4
Table 1
Changes in household wealth in 2011–2012 by region
Source: James Davies, Rodrigo Lluberas and Anthony Shorrocks, Credit Suisse Global Wealth Databook 2012
Total net wealth Change in total net wealth Change in financial assets Change in non-financial assets
2012
USD bn
2011–12
USD bn
2011–12
%
2011–12
USD bn
2011–12
%
2011–12
USD bn
2011–12
%
Africa 2,393 -127 -5.0 -112 -8.1 -42 -3.0
Asia-Pacific 50,724 -1,311 -2.5 -298 -1.0 -938 -3.1
China 20,190 562 2.9 233 2.4 367 3.4
Europe 69,351 -10,882 -13.6 -6,237 -14.9 -6,480 -12.1
India 3,193 -699 -18.0 -139 -20.8 -586 -17.4
Latin America 8,696 -760 -8.0 -447 -10.4 -450 -6.9
North America 68,173 882 1.3 361 0.6 403 1.5
World 222,719 -12,336 -5.2 -6,640 -4.6 -7,728 -5.8
Greece and Serbia. Relatively few countries
escaped reversals, although stock prices rose by
more than 15% in Thailand, Tunisia, Vietnam, Mex-
ico and the Philippines, while Ireland rebounded
from its recent setbacks with a robust rise of 88%.
House prices are another indicator (with a short
time lag) of household wealth, primarily of the
non-financial kind. In global terms, house prices
have been relatively flat, as suggested by the
changes recorded for nine countries in Figure 1,
which are confined to a range between –6% and
+6% (data for Russia are unavailable). Elsewhere,
house prices rose by 8% in Poland and by 14% in
Austria, while they declined by around 9% in Por
-
tugal and Taiwan, by 14% in Ireland, and by more
than 40% in Malaysia.
US dollar appreciation
The last major factor affecting global wealth com-
parisons is the change in exchange rates versus
the US dollar, which declined almost everywhere
between mid-2011 and mid-2012. The 14%
depreciation of the euro roughly equates to the
world average, although Brazil, Hungary, India,
Poland and Romania recorded declines greater
than 20%. Canada and the United Kingdom man-
aged to limit the depreciation to 6%, and China and
Japan bucked the trend with a year-on-year appre-
ciation of about 2.5%, although the yuan has been
on a downtrend since early 2012, which means
that the 12-month comparison for China may be
somewhat misleading. Taken together, exchange
rate movements reduced US dollar-denominated
global wealth by about 6%, which explains the dif-
ference between the 5% decline in aggregate
global wealth denominated in current US dollars
and the 1% rise measured in constant dollars. Of
course, exchange rate movements have a more
noticeable impact on the relative position of indi-
vidual countries in a global context.
Level and trends in household wealth
The impact of these asset price changes and
exchange rate movements is examined in more
detail in the next chapter, which provides estimates
of the level and trend in total household wealth and
its principal components across regions and coun-
tries since the year 2000. Chapter 3 pays special
attention to the pattern of wealth holdings across
the adult population, as captured in the global
wealth pyramid, and summarizes year-on-year
changes in the number of US dollar millionaires and
their countries of residence.
Special topics for 2012
The report this year features a detailed review of
household debt, covering G7 countries since the
1980s and all countries in the world since the year
2000. The analysis reveals many interesting find-
ings that appear to have gone unnoticed. We also
examine the link between household debt and the
sovereign debt of countries. The other special topic
in 2012 focuses on inherited wealth. It looks inter
alia at the degree to which evidence of inheritance
varies across wealth levels and over time, and how
the share of inherited and self-made wealth across
countries depends on factors such a savings rates,
growth rates and life expectancy.
Looking ahead
Our research has established that by the middle of
2011, household wealth in all regions (except
Africa) had fully recovered from the 2007–08 finan-
cial crisis. The prospects for Europe look less bright
because household wealth has suffered hits from
several quarters. Equity markets have been dismal,
house prices have been stagnant, and depreciating
currencies have added to the overall gloom. Euro
-
zone countries, in particular, have tended to move
downwards in the wealth league tables, and resi-
dents in these countries have tended to be replaced
in the higher wealth groups. History suggests that
the combination of equity price falls and currency
depreciation affecting Europe over the last year are
unlikely to be repeated to the same extent this year;
but the overall wealth outlook remains neutral at
best, rather than positive. From a global viewpoint,
it is the emerging market giants – most especially
China – which will continue to hold the key to
household wealth creation in the immediate future
(as we outline in our chapter on forecasts).
Figure 1
Percentage change in market capitalization, house prices
and USD exchange rate, 2011–2012
Source: James Davies, Rodrigo Lluberas and Anthony Shorrocks, Credit Suisse Global Wealth Databook 2012
50-5-10-15-20-25
United States
United Kingdom
Russia
Japan
Italy
India
Germany
France
China
Canada
House prices USD exchange rate
Market capitalization
PHOTO: KEYSTONE/HERRGOTT RICARDO
GLOBAL WEALTH REPORT 2012_6
GLOBAL WEALTH REPORT 2012_7
Household wealth:
A global portrait
Wealth is one of the pillars of the economic system – driving economic
growth, the accumulation of capital, trends in consumption, asset prices,
and specific industries such as healthcare and banking. Although the very
top wealth holders attract a great deal of attention, there is a shortage of
reliable data and research on the overall pattern of household wealth. In
this chapter, we summarize the pattern of wealth ownership across regions
and countries, and analyze the core trends over time.
GLOBAL WEALTH REPORT 2012_8
The Credit Suisse Wealth Report aims to be the
best available source of information on global
household wealth, providing the most reliable
results and the most comprehensive coverage. We
assemble data on household wealth from a variety
of sources, and apply state-of-the-art techniques
to produce estimates of the level and pattern of
household wealth across individual adults. Our
analysis encompasses the whole spectrum of
wealth holdings from rich to poor across all coun-
tries and regions. The more extensive Credit Suisse
Wealth Databook that accompanies this report
describes the methodology employed in greater
detail. This chapter outlines some of the key results
and trends related to wealth levels.
Trends in global wealth
We estimate that global household wealth in mid-
2012 totaled USD 223 trillion based on current
exchange rates, equivalent to USD 49,000 per adult
in the world. Figure 1 shows that by the middle of
2011, global wealth had recovered from the 2007
financial crisis; at that time, total wealth matched or
exceeded the pre-crisis levels in all regions except
Africa. During the past year, economic uncertainty
and exchange rate movements have reduced US
dollar-denominated aggregate wealth everywhere
except North America and China, and this decline
was sufficient to return India and Europe below the
2007 peak. While Europe remains the region with
the highest total wealth, its lead on North America is
now just USD 1.2 trillion, the smallest gap since
Europe overtook North America in 2006.
Despite the setbacks in 2007 and more recently,
household wealth has grown strongly over the past
decade, with the global aggregate doubling from
the USD 113 trillion recorded at the start of the
millennium. Even adjusting for the rise in the global
population and for exchange rate fluctuations, net
worth has increased by 38% since the year 2000,
equivalent to 2.7% growth per annum. The sepa-
PHOTO: ISTOCKPHOTO.COM/ESCOLUX
GLOBAL WEALTH REPORT 2012_9
rate regional series displayed in Figure 2 based on
constant USD exchange rates reinforce the view
that the underlying trends have been, and continue
to be, broadly positive. They show that all regions
except Latin America experienced a downturn in
2007–08, and that – when exchange rate fluctua-
tions are ignored – growth in wealth, both before
and after the crisis, has been uniformly positive,
apart from the period 2000–02 in North America
and last year in Europe.
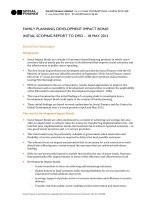
Global wealth by country
The figure for average global wealth masks the
considerable variation across countries and regions
(see Figure 3). The richest nations, with wealth per
adult over USD 100,000, are found in North Amer-
ica, Western Europe, and among the rich Asia-
Pacific and Middle Eastern countries. They are
headed by Switzerland, which in 2011 became the
first country in which average wealth exceeded
USD 500,000. Exchange rate fluctuations have
reduced its wealth per adult from USD 540,000 in
2011 to USD 470,000 in 2012; but this still
remains considerably higher than the level in Aus-
tralia (USD 350,000) and Norway (USD 330,000),
which retain second and third places despite falls of
about 10%. Close behind are a group of nations
with average wealth above USD 200,000, many of
which have experienced double-digit depreciations
against the US dollar, such as France, Sweden,
Belgium, Denmark and Italy. Countries in the group
which have not been adversely affected have
moved up the rankings – most notably Japan to
fourth place with wealth of USD 270,000 per adult
and the USA to seventh place with USD 260,000
per adult.
Interestingly, the ranking by median wealth is
slightly different, favoring countries with lower lev-
els of wealth inequality. As was the case last year,
Australia (USD 195,000) tops the table by a con-
siderable margin, with Japan, Italy, Belgium, and
the UK in the band from USD 110,000 to 140,000,
and Singapore and Switzerland with values around
USD 90,000. The USA lags far behind with median
wealth of just USD 55,000.
Intermediate wealth
In terms of wealth per adult, the set of richest
countries has been very stable. During the past
year, only Greece has dipped below the USD
100,000 threshold, although Spain and Cyprus are
close to demotion with average wealth of USD
105,000 and USD 113,000 respectively. Greece
joins other European Union (EU) countries (Portu-
gal, Malta and Slovenia) at the top of the ெinterme-
diate wealth” group, with mean wealth ranging from
USD 25,000 to USD 100,000. Recent EU entrants
(Czech Republic, Estonia and Slovakia) are found
lower down this band, but several others (Hungary,
Poland, Lithuania and Romania) have been
Figure 1
Aggregate global wealth, 2000–2012
Source: James Davies, Rodrigo Lluberas and Anthony Shorrocks, Credit Suisse Global Wealth Databook 2012
Figure 2
Total wealth 2000–2012 at constant exchange rates,
by region
Source: James Davies, Rodrigo Lluberas and Anthony Shorrocks, Credit Suisse Global Wealth Databook 2012
250
200
15 0
10 0
50
2000 2001 2002 2003 2004 2005 2006 2007 2008 2009 2010 2011 2012
USD trn
Africa
India
Latin America
China
Asia-PaciƟc
EuropeNorth America
0
100
USD trn, log scale
10
Europe
1
North America $VLD3DFLƟF China Latin America India Africa
2000 2001 2002 2003 2004 2005 2006 2007 2008 2009 2010 2011 2012
GLOBAL WEALTH REPORT 2012_10
demoted during the past year. The intermediate
wealth band also encompasses a number of Middle
Eastern nations (Oman, Bahrain, Lebanon, and
Saudi Arabia) and several Latin American countries
(Chile, Mexico, Uruguay and Costa Rica) consid-
ered to be emerging markets. Colombia has been
promoted to the group, but Brazil has moved in the
opposite direction, together with its BRICS col-
league, South Africa.
Frontier wealth
The ெfrontier wealth” range from USD 5,000 to
25,000 per adult covers the largest number of
countries and most of the heavily populated ones,
including China, Russia, Indonesia, Brazil, Paki-
stan, Philippines, Turkey, Egypt and Iran. The band
also contains many transition nations outside the
EU (Albania, Armenia, Azerbaijan, Bosnia, Georgia,
Serbia, Kazakhstan and Mongolia), most of Latin
America (Argentina, Ecuador, El Salvador, Panama,
Paraguay, Peru and Venezuela), and many coun-
tries bordering the Mediterranean (Algeria, Jordan,
Libya, Morocco, Syria and Tunisia). South Africa is
now positioned alongside other leading sub-Saha-
ran nations in this group: Botswana, Equatorial
Guinea, Namibia and Swaziland.
The final category with wealth below USD 5,000
remains heavily concentrated in Africa, although the
overall geographical composition shifted this year,
when India dropped down to join other major Asian
nations (Bangladesh, Cambodia, Laos, Nepal, Sri
Lanka and Vietnam). Belarus, Moldova and Ukraine
are three countries bordering the EU, which also
languish in the middle of this wealth range.
Figure 3
World wealth levels 2012
Source: James Davies, Rodrigo Lluberas and Anthony Shorrocks, Credit Suisse Global Wealth Databook 2012
Under USD 5,000
Wealth per adult (USD)
USD 5,000 to 25,000
USD 25,000 to 100,000
Over USD 100,000
No data
Wealth of regions
In mid-2012, Europe and North America had very
similar shares of total household wealth, 31.1%
and 30.6% respectively. North America is the
region with the highest average wealth, but
Europe’s bigger population makes up the differ-
ence. Figure 4 shows that the 23% share of wealth
held in Asia-Pacific countries (excluding China and
India) is very close to the population share of the
region. Elsewhere, the disparity between popula-
tion and wealth becomes increasingly apparent.
Despite making enormous strides in recent years,
Chinese residents account for 21.5% of the adult
population of the world, yet only 9.1% of global
wealth. In Latin America, the ratio is similar: 8.4%
to 3.9%; but in Africa and India, the population
share exceeds the wealth share by a factor of ten.
Trends in wealth per adult and its
components
As Figure 5 shows, average household net worth
trended upwards from 2000 until the crisis in 2007,
then fell by approximately 10% before recovering in
2011 to slightly above the pre-crisis level. Further
setbacks this year have pushed wealth per adult
back below the previous peak. However, exchange
rate movements account for much of the year-on-
year variation. Using constant USD exchange rates
yields a smoother time trend and a single signifi-
cant downturn in 2008, after which point the recov-
ery has continued more or less unabated.
The time series for the financial and nonfinan-
cial components of wealth closely follow the pat-
GLOBAL WEALTH REPORT 2012_11
tern for net worth, and both have now returned
below the 2007 peak. At the start of the millen-
nium, financial assets accounted for well over half
of the household portfolio, but the share declined
until 2008, at which point the global wealth portfo-
lio was equally split between financial and non-
financial assets (mostly property). In the period
since 2008, the balance has again tipped slightly
towards financial assets.
On the liabilities side of the household balance
sheet, average debt rose by 80% between 2000
and 2007, and subsequently leveled out. It now
amounts to USD 8,600 per adult, about 7% lower
than it was the same time a year ago. Expressed as
a proportion of household assets, average debt has
moved in a narrow range, rising over the period, but
never exploding.
The composition of household portfolios varies
widely and systematically across countries. The
most persistent feature is the rise in the relative
importance of both financial assets and liabilities
with the level of development. For instance, finan-
cial assets account for 43.1% of gross assets in
Europe and 67.1% in North America, but just
15.9% of gross assets in India. Household debt as
a percentage of gross assets is 16% in Europe and
18.1% in North America, but only 3.7% in India
and 8.7% in Africa. There is also variation in port-
folios unrelated to the level of development. Some
developed countries, like Italy, have unusually low
liabilities (10.0% of gross assets), while others
have surprisingly high debt, like Denmark (33.7%
of gross assets). In addition, the mix of financial
assets varies greatly, reflecting national differences
in financial structure. The share of equities in total
financial assets, for example, ranges from 43.4%
in the USA, down to just 20.1% and 6.5% in Ger-
many and Japan respectively.
Changes to household wealth from
mid-2011 to mid-2012
The adverse global economic climate and the USD
appreciation that occurred during the year until
mid-2012 meant that household wealth rose by
more than USD 100 billion in only four countries:
the USA (USD 1.3 trillion), China (USD 560 bil
-
lion), Japan (USD 370 billion) and Colombia (USD
100 billion). Figure 6 shows that Eurozone mem-
bers suffered the largest losses, led by France
(USD 2.2 trillion), Italy (USD 2.1 trillion), Germany
(USD 1.9 trillion) and Spain (USD 870 billion).
These losses were exacerbated by the unfavorable
euro-dollar exchange rate movement, but even in
euro terms, wealth declined by EUR 50 billion in
Germany, EUR 148 billion in France, EUR 177 bil
-
lion in Spain and EUR 286 billion in Italy. Sizeable
USD wealth reductions were also recorded in the
UK (USD 720 billion), India (USD 700 billion),
Australia (USD 600 billion), Brazil (USD 530 bil-
lion), Canada (USD 440 billion) and Switzerland
(USD 410 billion).
Figure 4
Wealth and population by region, 2012
Source: James Davies, Rodrigo Lluberas and Anthony Shorrocks, Credit Suisse Global Wealth Databook 2012
Figure 5
Global trends in wealth per adult and its components
Source: James Davies, Rodrigo Lluberas and Anthony Shorrocks, Credit Suisse Global Wealth Databook 2012
50 3010 15 20 25
Europe
North America
$VLD3DFLƟF
China
Latin America
India
Africa
Share of total wealth in %
Share of adult population in %
USD per adult
50000
40000
30000
20000
10000
Financial wealth
0
Net worth at constant exchange ratesDebtNet worth
1RQƟQDQFLDOZHDOWK
2000 2001 2002 2003 2004 2005 2006 2007 2008 2009 2010 2011 2012
Notes on concepts and methods: Net worth or “wealth” is defined as the value of financial assets
plus real assets (principally housing) owned by households, less their debts. This corresponds to the
balance sheet that a household might draw up, listing the items which are owned and their net value if
sold. Personal pension fund assets are included in principle, but not entitlements to state pensions.
Human capital is excluded altogether, along with assets and debts owned by the state (which cannot
easily be assigned to individuals).
For convenience, we disregard the relatively small amount of wealth owned by children on their own
account, and frame our results in terms of the global adult population, which totaled 4.6 billion in 2012.
The “Asia-Pacific” region excludes China and India, which are treated separately due to the size of their
populations.
Data for 2011 and 2012 refer to mid-year (end-June) estimates; the figures for earlier years indicate
year-end values.
GLOBAL WEALTH REPORT 2012
_12
The largest percentage gains and losses generate
a slightly different list. A steady USD exchange
rate, combined with an 11% improvement in mar-
ket capitalization, helped Colombia to top the coun-
try rankings with a 16% rise in household wealth.
Algeria, Hong Kong, Peru and Uruguay also
recorded gains of more than 5%. The downside is
more evident, especially in Eurozone countries,
where double-digit losses were recorded every-
where (see Figure 7). Other sizeable declines were
recorded for Russia (–13%), Mexico (–14%),
South Africa (–15%) and India (–18%), while East-
ern Europe had a very poor year, led by the Czech
Republic and Poland (both with –18%), Hungary
(–25%) and Romania (–36%).
Distribution of wealth across individuals
If we are to understand how global wealth is spread
across households and individuals – rather than
regions or countries – we need information on the
distribution of wealth within countries. For this
study, we combine data on the levels of household
wealth across countries and patterns of household
wealth within countries in order to estimate the
global distribution of wealth.
Our estimates indicate that once debts have
been subtracted, an adult requires only USD 3,700
in assets to be in the wealthiest half of world citi-
zens. However, a person needs at least USD
71,000 to belong to the top 10% of global wealth
holders and USD 710,000 to be a member of the
top 1%. Taken together, the bottom half of the
global population possess barely 1% of total
wealth, although wealth is growing fast for some
members of this segment. In sharp contrast, the
richest 10% own 86% of the world’s wealth, with
the top 1% alone accounting for 46% of global
assets.
Regional comparisons
The pattern of regional representation in global
wealth deciles (i.e. population tenths) is shown in
Figure 8. The most striking feature is perhaps the
comparison between China and India. China has
very few representatives at the bottom of the global
wealth distribution and relatively few at the top, but
dominates the upper middle section, with 40% of
its population in deciles 6–9. The sizeable presence
of China in this section reflects not only its popula-
tion size and its growing average wealth, but also
wealth inequality which, despite recent increases,
remains modest by the standards of the developing
world. China’s position in the global picture has
shifted towards the right in the past decade due to
its strong record of growth, rising asset values, and
currency appreciation. China now has more people
in the top 10% of global wealth holders than any
other country except for the USA and Japan, hav-
ing moved into third place in the rankings by over-
taking Italy and Germany. In contrast, residents of
Figure 6
Change in total wealth 2011–2012: Biggest winners
and losers (USD bn)
Source: James Davies, Rodrigo Lluberas and Anthony Shorrocks, Credit Suisse Global Wealth Databook 2012
Figure 7
Percentage change in total wealth 2011–2012:
Biggest winners and losers
Source: James Davies, Rodrigo Lluberas and Anthony Shorrocks, Credit Suisse Global Wealth Databook 2012
-2500 -2000 -1500 0-1000 -500 500 1000 1500 2000
Canada
Brazil
Australia
Spain
United States
United Kingdom
Colombia
Netherlands
Belgium
Sweden
Taiwan
Mexico
Switzerland
Japan
Italy
India
Germany
France
China
-40 -30 -20 0-10 10 20
Italy
Finland
Czech Republic
India
United States
Portugal
Colombia
Greece
France
Ireland
South Africa
Sweden
Japan
Hungary
Poland
Spain
Romania
Algeria
China
GLOBAL WEALTH REPORT 2012_13
India are heavily concentrated in the lower wealth
strata, accounting for a quarter of people in the
bottom half of the distribution. However, its extreme
wealth inequality and immense population means
that India also has a significant number of members
in the top wealth echelons.
As Figure 8 shows, residents of Asia-Pacific
nations (excluding China and India) are fairly evenly
spread across the global wealth spectrum. How-
ever, this uniformity masks a substantial degree of
polarization. Members of high-income Asian coun-
tries, such as Japan, Singapore and Hong Kong,
are heavily concentrated at the top end: half of all
adults in high-income Asian countries are placed in
the top global wealth decile. In contrast, residents
of lower-income countries in Asia, such as Indone-
sia, Bangladesh, Pakistan and Vietnam, tend to be
found much lower down in the wealth distribution.
In fact, when high-income countries are excluded
from the Asia-Pacific group, the wealth pattern
within the remaining countries resembles that of
India, with both regional groupings contributing
about one quarter of the bottom half of wealth
holders. Africa is even more concentrated at the
bottom end. Half of all African adults are found in
the bottom two global wealth deciles. At the same
time, wealth inequality within and across countries
in Africa is so high that some individuals are found
among the top 10% of global wealth holders, and
even among the top 1%.
Latin America is another region whose wealth dis-
tribution closely mimics the global pattern, with
individuals fairly evenly spread across the wealth
deciles. North America and Europe are skewed
much more towards the high end, together
accounting for 60% of individuals in the top 10%,
and an even higher percentage of the top percen-
tile. Europe alone accounts for 36% of members of
the top wealth decile, a proportion that rose consid-
erably over the past decade as the euro appreci-
ated against the US dollar, but has declined a little
during the past 12 months.
Year-on-year changes in membership of top
wealth decile by country
We estimate that more than six million residents in
both Japan and China joined the top global decile,
along with around half a million new members
each in Chile, Colombia and Hong Kong (see
Table 1). They displaced about six million mem
-
bers of the top decile who were domiciled in Ger-
many, Italy and Spain, and nearly five million adults
resident in the major developing economies of
Brazil, South Africa, India, Mexico and Taiwan. To
belong to the top percentile (i.e. top 1%) of the
global wealth distribution required USD 710,000
in mid-2012; hence, the pattern of residence
across countries is expected to be similar to that
of millionaires. Our results indicate that almost
Figure 8
Regional composition of global wealth distribution 2012
Source: James Davies, Rodrigo Lluberas and Anthony Shorrocks, Credit Suisse Global Wealth Databook 2012
100 %
40%
50%
60%
70%
80%
90%
30%
20%
10 %
0%
Decile
1 2 3 4 5 6 7 8 9 10
$VLD3DFLƟF
India
China
Africa
Europe
Latin America
North America
GLOBAL WEALTH REPORT 2012_14
Adults (thousand) in global top 10% Adults (thousand) in global top 1%
Country 2011 2012 Change Country 2011 2012 Change
Japan 68,894 75,525 6,631 b USA 12,584 16,376 3,792
China 28,950 34,996 6,046 b Japan 5,642 6,590 948
UK 28,453 29,321 868 b Chile 44 66 22
Chile 739 1,416 677 b Peru 10 28 18
Denmark 1,641 2,190 549 b Morocco 3 21 18
Colombia 1,331 1,846 515 b Colombia 60 75 15
Hong Kong 1,174 1,654 480 b Philippines 28 38 10
Korea 7,302 7,611 309 b UAE 65 70 5
Canada 13,315 13,621 306 b Hong Kong 133 138 5
Netherlands 5,727 6,010 283 b Thailand 26 30 4
Poland 1,551 1,334 -217 b Taiwan 553 404 -149
Taiwan 6,714 6,384 -330 b Spain 671 517 -154
Israel 1,862 1,500 -362 b Brazil 507 352 -155
Mexico 5,651 5,221 -430 b Belgium 634 461 -173
India 4,138 3,616 -522 b Canada 1,603 1,428 -175
South Africa 2,449 1,586 -863 b Denmark 426 201 -225
Italy 32,184 30,684 -1,500 b Australia 1,861 1,571 -290
Germany 29,880 28,143 -1,737 b France 3,982 3,540 -442
Brazil 9,322 6,656 -2,666 b Germany 2,964 2,455 -509
Spain 16,361 13,640 -2,721 b Italy 2,778 2,073 -705
World 451,795 459,238 7,443 World 45,185 45,938 753
four million US residents moved into the top global
wealth percentile, together with nearly one million
Japanese. As expected, they replaced many resi-
dents of Eurozone countries: Italy (-705,000),
Germany (-509,000), France (-442,000), Bel-
gium (-173,000) and Spain (-154,000). Australia,
Denmark, Canada, Brazil and Taiwan between
them shed about another million members.
World wealth spectrum
Wealth is one of the key components of the eco-
nomic system. It is valued as a source of finance
for future consumption, especially in retirement,
and for reducing vulnerability to shocks such as
unemployment, ill health or natural disasters.
Wealth also enhances opportunities for informal
sector and entrepreneurial activities, when used
either directly or as collateral for loans. These func-
tions are less important in countries that have gen-
erous state pensions, adequate social safety nets,
good public healthcare, high quality public educa-
tion and well-developed business finance. Con-
versely, the need to acquire personal assets is par-
ticularly compelling and urgent in countries that
have rudimentary social insurance schemes and
restricted options for business finance, as is the
case in much of the developing world.
The Credit Suisse Wealth Report is designed to
provide a comprehensive portrait of world wealth,
Table 1
Winners and losers in the global wealth distribution
Source: James Davies, Rodrigo Lluberas and Anthony Shorrocks, Credit Suisse Global Wealth Databook 2012
covering all regions and countries, and all parts of
the wealth spectrum from rich to poor. Despite a
decade of negative real returns on equities, several
equity bear markets, and the collapse of housing
bubbles, we find that total global wealth has dou-
bled since 2000. Strong economic growth and ris-
ing population levels in emerging nations are impor-
tant drivers of this trend.
The list of top ten countries in the wealth-per-
adult league table includes many smaller, dynamic
economies – Switzerland, Norway, Luxembourg,
Singapore and Sweden – as well as Australia and
G7 members, Japan, France, the USA and the UK.
Notable cases of emerging wealth are found in
Chile, Columbia, the Czech Republic, Lebanon, Slo
-
venia and Uruguay, while ெfrontier” wealth is evident
in Egypt, Indonesia, Malaysia, Tunisia and Vietnam.
For a number of reasons, wealth varies greatly
across individuals. Our estimates suggest that the
lower half of the global population owns barely 1%
of global wealth, while the richest 10% of adults
own 86% of all wealth, and the top 1% account
for 46% of the total. Over time, this may change,
particularly if enough low-wealth countries experi
-
ence rapid growth, and if China and India fulfill
their potential to be major catalysts of global meta-
morphosis. However, any trend towards equaliza-
tion is likely to be slow. In the next section, we look
at the pattern of wealth holdings across individuals
in more detail.
GLOBAL WEALTH REPORT 2012_15
The global
wealth pyramid
This chapter looks in more detail at the pattern of wealth ownership across all
adults in the world, through the lens of the “wealth pyramid”. This allows us to
analyze not only the top echelons of wealth holders, but also the “middle” and
“bottom” sections of the wealth pyramid, which other studies tend to ignore.
Many factors contribute to the disparity in personal
wealth across individuals. At one end of the spec-
trum, there are individuals at early stages of their
career who have had little chance and little motiva-
tion to accumulate assets, those who have suffered
business setbacks or personal misfortunes, and
those who simply live in parts of the world where
opportunities for wealth creation are severely lim-
ited. At the other end of the spectrum, there are
individuals who have acquired a large fortune
through a combination of talent, hard work or sim-
ply being in the right place at the right time.
The wealth pyramid
The wealth pyramid shown in Figure 1 captures
these wealth differences in striking detail. It has a
large base of low wealth holders, with the upper
tiers occupied by progressively fewer people. The
pyramid data are derived from our estimates for
mid-2012 and it thus provides a snapshot of the
wealth pattern across the adult population. While
the overall features tend to change slowly over
time, the various strata are very fluid, and the indi-
vidual occupants are highly mobile, seldom remain-
ing in the same place over the course of their life-
time. For this reason, while the top stratum of the
pyramid remains the principal driver of private asset
flows and investment trends, the emerging wealth
holders in the middle and base segments are rightly
seen as sources of great dynamism, triggering new
trends in consumption and industrial change.
In 2012, we estimate that 3.2 billion individuals
– more than two-thirds of the global adult popula-
tion – have wealth below USD 10,000, and a fur-
ther one billion (23% of the adult population) are
placed in the USD 10,000–100,000 range. While
the average wealth holding is modest in the base
and middle segments of the pyramid, total wealth
amounts to USD 39 trillion, underlining the poten-
tial for new consumer trends products and for the
development of financial services targeted at this
often neglected segment.
The remaining 373 million adults (8% of the
world) have assets exceeding USD 100,000. This
includes 29 million US dollar millionaires, a group
which contains less than 1% of the world’s adult
population, yet collectively owns nearly 40% of
global household wealth. Amongst this group, we
estimate that 84,500 individuals are worth more
than USD 50 million, and 29,000 are worth over
USD 100 million.
The composition of the wealth pyramid in 2012
is broadly similar to that of the previous year, except
for the fact that the overall reduction in total wealth
increases the percentage of adults in the base level
from 67.6% to 69.3% and reduces the relevant
population share higher up the pyramid by a corre-
sponding amount. The respective wealth shares are
virtually unchanged.
The base of the pyramid
The various strata of the wealth pyramid have dis-
tinctive characteristics. Although members of the
base level are spread widely across all regions, rep-
resentation in India and Africa is disproportionately
high, while Europe and North America are corre-
PHOTO: KEYSTONE/IMAGEBROKER/FLORIAN KOPP
GLOBAL WEALTH REPORT 2012_16
GLOBAL WEALTH REPORT 2012_17
spondingly underrepresented (see Figure 2). The
base tier has the most even distribution across
regions and countries, but it is also the most het-
erogeneous, spanning a wide range of family cir-
cumstances. In developed countries, only about
30% of the population fall into this category, and
for most of these individuals, membership is a tran-
sient or life cycle phenomenon associated with
youth, old age, or periods of unemployment. In
contrast, more than 90% of the adult population in
India and Africa are located within this band. In
many low-income African countries, the percent-
age of the population is close to 100%. Thus, for
many residents of low-income countries, lifetime
membership of the base tier is the norm rather than
the exception. However, lower living costs mean
that the upper limit of USD 10,000 is often suffi-
cient to assure a reasonable standard of living.
While bottom-of-the-pyramid countries have
limited wealth, it often grows at a fast pace. In
India, for example, wealth is skewed towards the
bottom of the wealth pyramid, yet it has tripled
since 2000. Indonesia has also seen dramatic
growth, and aggregate wealth in Latin America is
now USD 8.7 trillion, compared to USD 3.4 trillion
in 2000. In contrast, while North Americans domi-
nate the top of the wealth pyramid, wealth in the
USA has grown more modestly, from USD 39.5
trillion in 2000 to USD 62 trillion today.
Middle class wealth
The one billion adults located in the USD 10,000–
100,000 range are the middle class in the global
distribution of wealth. The average wealth holding
is close to the global average for all wealth levels,
and the total wealth of USD 32 trillion gives this
segment considerable economic weight. The
regional composition of this tier most closely cor-
responds to the global pattern, although India and
Africa are underrepresented. The comparison of
China and India is particularly interesting. India is
host to just 3% of the global middle class, and the
share has been relatively stagnant in recent years.
In contrast, China’s share has been growing fast
and now accounts for over one-third of members,
ten times higher than India’s.
High wealth segment of the pyramid
The regional composition changes significantly
when it comes to the 373 million adults worldwide
who make up the “high” segment of the wealth
pyramid – those with a net worth above USD
100,000. North America, Europe and the Asia-
Pacific region together account for 89% of the
global membership of this group, with Europe alone
home to 141 million members (38% of the total).
This compares with about 2.4 million adult mem-
bers in India (0.6% of the global total) and a similar
number in Africa.
The number of people in a given country with
wealth above USD 100,000 depends on three fac-
tors: population size, the average wealth level, and
wealth inequality within the country concerned. In
2012, only 15 countries have more than 1% of the
global membership. The USA leads with 21% of
the total. In this instance, the three factors rein-
force each other: a large population, combined with
high mean wealth and an unequal wealth distribu-
USD 87.5 trn (39.3%)
29 m
(0.6%)
344 m
(7.5%)
1,035 m
(22.5%)
3,184 m
(69.3%)
Number of adults (percent of world population)
Wealth range
Total wealth
(percent of world)
USD 95.9 trn (43.1%)
USD 32.1 trn (14.4%)
USD 7.3 trn (3.3%)
> USD 1 m
USD 100,000 to 1 m
USD 10,000 to 100,000
< USD 10,000
Figure 1
The global wealth pyramid
Source: James Davies, Rodrigo Lluberas and
Anthony Shorrocks, Credit Suisse Global Wealth
Databook 2012
GLOBAL WEALTH REPORT 2012
_18
tion. Japan is a strong second and is currently the
only country that challenges the hegemony of the
USA in the top wealth-holder rankings. Although its
relative position has declined over the past couple
of decades due to the lackluster performance of its
equity and housing markets, Japan has 18% of
individuals with wealth above USD 100,000, a
couple of points more than a year ago.
The most populous EU countries – Italy, the
UK, Germany, and France – each contribute
6%–8% to the high wealth segment, and each
country has experienced a small decline in its
membership share during the year. For many
years, these countries have occupied positions
three to six in the global rankings, but this year
China edged France out of sixth place, a dramatic
improvement from the situation in 2000, when
China’s representation in the top wealth groups
was too small to register. Brazil, Korea and Taiwan
are other emerging market economies with at
least four million residents with a net worth above
USD 100,000. Mexico accounted for more than
1% of the group in 2011, but has dropped below
this benchmark this year.
Top of the pyramid
A different pattern of membership is again evident
among the world’s millionaires at the top of the
pyramid (see Figure 3). Compared to individuals
with wealth above USD 100,000, the proportion of
members from the United States almost doubles to
39%, and the shares of most of the other coun
-
tries move downwards. There are exceptions,
however. France moves up to third place in the
rankings, and Sweden and Switzerland both join
the group of countries with more than 1% of global
millionaires.
Changing membership of the “millionaire
group”
Changes to wealth levels since mid-2011 have
affected the pattern of wealth distribution. The
overall decline in average wealth has raised the
proportion of adults with wealth below USD
10,000 from 67.6% in mid-2011 to 69.3% in
mid-2012, and reduced the number of millionaires
by slightly more than one million (see Table 1).
There were 962,000 new millionaires in the United
States and 460,000 in Japan, but no significant
increase in numbers elsewhere. However, Europe
shed almost 1.8 million US dollar millionaires, most
notably in Italy (–374,000), France (–322,000),
Germany (–290,000), Denmark (–179,000),
Sweden (–142,000) and Spain (–87,000). Austra
-
lia, Canada, Brazil and Taiwan are the other coun-
tries in the group of the top ten losers. The losses
were sufficient to drop Brazil, Denmark and Taiwan
(along with Belgium) from the list of countries with
more than 1% of the total number of millionaires
worldwide.
Figure 3
Dollar millionaires by country of residence
Source: James Davies, Rodrigo Lluberas and Anthony Shorrocks, Credit Suisse Global Wealth Databook 2012
Figure 2
Regional membership of global wealth strata
Source: James Davies, Rodrigo Lluberas and Anthony Shorrocks, Credit Suisse Global Wealth Databook 2012
0 10 20 30 40 50 60 70 80 90 100
Percentage of wealth group in region
> USD 1 million
USD 100,000
to 1 million
USD 10,000
to 100,000
< USD 10,000
All levels
India Africa
China Europe North America$VLD3DFLƟF Latin America
USA 39%
Japan 13%
Netherlands 1%
Spain 1%
Sweden 1%
Switzerland 2%
Canada 3%
Australia 3%
China 3%
Italy 4%
Germany
5%
UK 6%
France 8%
Rest of world 11%
GLOBAL WEALTH REPORT 2012_19
High net worth individuals
To estimate the pattern of wealth holdings above
USD 1 million requires a high degree of ingenuity
because at high wealth levels, the usual sources of
wealth data – official statistics and sample surveys
– become increasingly incomplete and unreliable.
We overcome this deficiency by exploiting well-
known statistical regularities in the upper parts of
the wealth distribution to ensure that the top wealth
tail is consistent with the annual Forbes tally of
global billionaires and similar “rich list” data pub-
lished elsewhere. This produces plausible esti-
mates of the global pattern of asset holdings in the
high net worth (HNW) category from USD 1 million
to USD 50 million, and in the ultra high net worth
(UHNW) range from USD 50 million upwards.
While the base of the wealth pyramid is occu-
pied by people from all countries of the world at
various stages of their life cycles, HNW and UHNW
individuals are heavily concentrated in particular
regions and countries, and tend to share a similar
lifestyle, participating in the same global markets
for high coupon consumption items, even when
they reside on different continents. The wealth
portfolios of individuals are also likely to be similar,
dominated by financial assets and, in particular,
equity holdings in public companies traded in inter-
national markets. For these reasons, using official
exchange rates to value assets is more appropriate
than using local price levels.
We estimate that there were 28.5 million HNW
individuals with wealth between USD 1 million and
USD 50 million in mid-2012, of whom the vast
majority (25.6 million) fall in the USD 1–5 million
range (see Figure 4). One year ago, Europe over-
took North America as the region with the greatest
number of HNW individuals, but tradition has been
Main winners Main losers
Country Adults (thousand) with wealth
above USD 1 m
Country Adults (thousand) with wealth
above USD 1 m
2011 2012 Change 2011 2012 Change
USA 10,061 11,023 962 Italy 1,544 1,170 -374
Japan 3,121 3,581 460 France 2,606 2,284 -322
Peru 4 18 14 Germany 1,753 1,463 -290
Chile 28 42 14 Denmark 296 117 -179
Morocco 1 14 13 Australia 1,079 905 -174
Colombia 37 46 9 Sweden 485 343 -142
Philippines 18 25 7 Canada 940 842 -98
Thailand 17 20 3 Brazil 319 227 -92
UAE 40 43 3 Taiwan 343 253 -90
Hong Kong 89 92 3 Spain 400 313 -87
World 29,674 28,640 -1,034 World 29,674 28,640 -1,034
Table 1
Changes in the number of millionaires by country, 2011–2012
Source: James Davies, Rodrigo Lluberas and Anthony Shorrocks, Credit Suisse Global Wealth Databook 2012
restored this year, with 11.8 million residents (42%
of the total) in North America and 9.2 million (32%)
in Europe. Asia-Pacific countries excluding China
and India have 5.7 million members (20%), and we
estimate that there are currently a fraction under
one million HNW individuals in China (3.4% of the
global total). The remaining 753,000 HNW indi-
viduals (2.6% of the total) reside in India, Africa or
Latin America.
Ultra high net worth individuals
Our estimates suggest that worldwide there are
84,500 UHNW individuals, defined here as those
with net assets exceeding USD 50 million. Of these,
29,300 are worth at least USD 100 million and
2,700 have assets above USD 500 million. North
America dominates the regional rankings, with
40,000 UHNW residents (47%), while Europe has
22,000 individuals (26%), and 12,800 (15%) reside
in Asia-Pacific countries, excluding China and India.
In terms of individual countries, the USA leads
by a huge margin with 37,950 UHNW individuals,
equivalent to 45% of the group (see Figure 5). The
recent fortunes created in China have propelled it
into second place with 4,700 representatives
(5.6% of the global total), followed by Germany
(4,000), Japan (3,400), the United Kingdom
(3,200) and Switzerland (3,050). Numbers in other
BRIC countries are also rising fast, with 1,950
members in Russia, 1,550 in India and 1,500 in
Brazil, and strong showings are evident in Taiwan
(1,200), Hong Kong (1,100) and Turkey (1,000).
Although there is very little comparable data on
the past, it is almost certain that the number of
UHNW individuals is considerably greater than it was
a decade ago. The overall growth in asset values
accounts for part of the increase, together with the
GLOBAL WEALTH REPORT 2012_20
appreciation of currencies against the US dollar over
much of the period. However, it also appears that,
notwithstanding the credit crisis and the more recent
setbacks, the past decade has been especially con
-
ducive to the establishment of large fortunes.
Changing fortunes
Wealth is often seen in terms of a pyramid, with
millionaires on top and poorer people at the base.
Many commentaries on wealth focus exclusively on
the top part of the pyramid, which is unfortunate
because the middle and base segments account
for about USD 40 trillion of global household
wealth, and satisfying the needs of the owners of
these assets is likely to drive new trends in con-
sumption, industry and finance. Wealth mobility
over time also means that many of the future suc-
cessful entrepreneurs and investors are currently
located in the lower wealth strata. China, Taiwan,
Korea, and Brazil are countries that are already ris-
ing quickly through this part of the wealth pyramid,
with Indonesia close behind and India growing fast
from a low starting point.
At the same time, the ultra wealthy top-of-the-
pyramid segment will continue to be the strong
driver of private asset flows and investment trends.
Our figures for mid-2012 indicate that there are
nearly 30 million HNW individuals, with almost one
million located in China and 5.7 million residing in
Asia-Pacific countries other than China and India.
At the top of the pyramid, there are 84,500
UHNW individuals with net worth exceeding USD
50 million. The recent fortunes created in China
lead us to estimate that 4,700 Chinese individuals
(5.6% of the global total) now belong to the UHNW
group, together with a similar number in Russia,
India and Brazil (taken together).
Figure 4
The apex of the pyramid
Source: James Davies, Rodrigo Lluberas and Anthony Shorrocks, Credit Suisse Global Wealth Databook 2012
Figure 5
Ultra high net worth individuals 2012: Selected countries
Source: James Davies, Rodrigo Lluberas and Anthony Shorrocks, Credit Suisse Global Wealth Databook 2012
84,500
928,000
1,921,000
25,613,500
Wealth
range
Number
of adults
> USD 50 m
USD 10 to 50 m
USD 5 to 10 m
USD 1 to 5 m
0 5000 10000 15000 20000 25000 30000 35000 40000
Indonesia
Korea
Hong Kong
Turkey
Taiwan
Brazil
Russia
India
Australia
Italy
Canada
United Kingdom
France
Switzerland
Japan
Germany
China
USA
USD 50 m – 100 m
USD 100 m – 500 m
USD 500 m – 1 bn
> USD 1 bn
GLOBAL WEALTH REPORT 2012_21
Household
debt
The aftermath of the credit crisis and
the ongoing Eurozone crisis have seen
rising levels of government debt, as well
as an intense interest in this by markets.
This chapter brings an important related
element – household debt – into focus.
Using new wealth data, we review past
trends in household debt and combine
household and government debt to
highlight countries that have sustainable
overall debt levels and those with the
greatest sovereign debt problems.
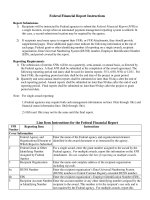
Global trends in household debt
Rising household debt has been one of the most
enduring and widespread economic trends of the
past 30 years. Evidence for G7 countries suggests
that this phenomenon began around 1975. Before
this date, the ratio of household debt to annual dis
-
posable income within countries remained fairly sta-
ble over time and rarely rose above 75%. By the
year 2000, household debt in Canada, Germany, the
UK and the USA was equivalent to at least 12
months’ income, and in Japan it equated to 15
months’ income (see Figure 1). Household debt in
France and Italy started from a much lower base, but
the gap narrowed considerably between 1980 and
2000, with the debt to income ratio approximately
doubling in France and rising even faster in Italy.
In most G7 countries, these trends continued
until the financial crisis, and then moderated or
reversed. When the debt to income ratio peaked, it
was two times higher than the level in the early
1980s in Canada, France and the USA, it was
three times higher than the earlier level in the UK,
and ten times higher in Italy. In contrast, the debt-
income ratio in Japan has been fairly flat since
1990 and around 2000, it even began to decline
slightly in Germany and Japan. While the financial
crisis prompted major debt reductions in the UK
and the USA after 2007, the trend towards greater
indebtedness has carried on regardless in Canada
and Italy. Given its history and reputation for pru-
dent economic policies, it is worth noting that Can-
ada currently has the highest household debt-
income ratio among G7 countries.
Estimates of household debt are available for all
countries since the year 2000. Our calculations
suggest that the recent experience of G7 countries
was widely replicated elsewhere. Adjusted for
exchange rate fluctuations, total global household
debt grew by 8% per annum in 2000–07, and then
flattened out (see Figure 2). For the entire period
2000–12, aggregate debt rose by 81%, equivalent
to 5% growth per annum. A rising global population
accounts for part of the increase: debt per adult
grew just 45% for the entire period. Currency
appreciation against the US dollar has tended to
Debtor’s prison
by Hogarth,
18th century
PHOTO: KEYSTONE/SCIENCE PHOTO LIBRARY SPL
CHEMICAL HERITAGE FOUNDATION
GLOBAL WEALTH REPORT 2012_22
Figure 1
Household debt-income ratio in G7 countries, 1960–2011
Source: James Davies, Rodrigo Lluberas and Anthony Shorrocks, Credit Suisse Global Wealth Databook 2012
operate in the opposite direction. With prevailing
exchange rates, total household debt more than
doubled before the financial crisis, rising from USD
18.8 trillion in 2000 to 38.8 trillion in 2007, before
flattening out. The current level is USD 39.4 trillion.
Regional patterns of household debt
The regional composition of household debt is
dominated by North America, Europe and Asia-
Pacific countries (excluding China and India), which
together account for 94% of the global total. Latin
America and Africa, along with China and India,
have low levels of aggregate debt and rank even
lower in terms of debt per adult. For example, in
2012, the average figure is USD 427 for Africa
and USD 162 for India compared to USD 57,063
2.0
1.5
1.0
0.5
France
0.0
ItalyGermanyCanada
Japan UK USA
1960 1965 1970 1975 1980 1985 1990 1995 2000 2005 2010
Figure 2
Global household debt, 2000–2012, base year 2000
Source: James Davies, Rodrigo Lluberas and Anthony Shorrocks, Credit Suisse Global Wealth Databook 2012
Figure 3
Debt per adult, constant exchange rate, base year 2000
Source: James Davies, Rodrigo Lluberas and Anthony Shorrocks, Credit Suisse Global Wealth Databook 2012
for North America. However, the pattern is slowly
changing. Based on constant exchange rates, debt
per adult grew by 150% in China and Africa
between 2000 and 2012, by 200% in Latin Amer-
ica, and by almost 250% in India, compared to
45% for the world as a whole and just 7% for the
Asia-Pacific region (see Figure 3).
Household debt per adult in developed
economies
Average debt per adult shows even greater varia-
tion across countries than average income or aver-
age wealth. The highest levels of debt per adult are
found in developed countries with well functioning
institutions and sophisticated credit markets.
Based on average USD exchange rates since
2000, Denmark, Norway and Switzerland top the
league table for household debt per adult in 2012,
with values above USD 100,000 (see Figure 4).
This is roughly twice the level seen in Canada,
Sweden, the USA, the UK and Singapore, with Ire
-
land and the Netherlands sitting between the two
groups. By these standards, the average debt per
adult in Spain (USD 31,200), Portugal (USD
25,800), Italy (USD 23,900) and Greece (USD
19,000) looks quite modest.
Figure 4 shows that average debt per adult
increased during 2000–07 in all the high debt coun-
tries apart from Germany, where average debt has
been flat, and Japan, where household debt has
declined – possibly due in part to the ageing popula-
tion, given the negative relationship between debt
and age. Countries with the highest debt per adult
showed little tendency towards debt reduction in the
aftermath of the financial crisis: Ireland, the USA
and Hong Kong are the main exceptions. Apart from
Germany and Japan, only Hong Kong and Singa
-
pore have debt levels in 2012 which are close to the
levels recorded at the start of the millennium.
Debt in proportion to wealth
Expressed as a fraction of net worth, household
GHEWLVW\SLFDOO\ŨRIZHDOWKLQDGYDQFHG
economies, but much higher levels are sometimes
recorded, for example in Ireland (44%), the Neth-
erlands (45%) and Denmark (51%). The reasons
lie with both the numerator and the denominator in
the ratio of debt to assets. Countries that have a
strong welfare state with generous public pensions
provide less of a stimulus for households to accu-
mulate financial assets. Public housing has a simi-
lar effect on the non-financial side, although its
share of the total housing stock has been declining
in most countries in recent decades, which makes
this argument less compelling. Nevertheless, in
Scandinavia and elsewhere, these forces make the
debt to assets ratio higher by depressing the
denominator. Sophisticated financial institutions
and easy access to credit are further reasons why
debt is sometimes high. The impact of government
220
200
180
160
140
120
100
Total debt, current exchange rate
80
Debt per adult, current exchange rate
Total debt, constant exchange rate Debt per adult, constant exchange rate
Debt as percent of net wealth
2000 2001
Index (base year 2000)
2002 2003 2004 2005 2006 2007 2008 2009 2010 2011 2012
350
300
250
200
150
100
50
2000 2001 2002 2003 2004 2005 2006 2007 2008 2009 2010 2011 2012
Latin America
ChinaAfrica
India
$VLD3DFLƟF
Europe North America World
Index (base year 2000)
GLOBAL WEALTH REPORT 2012_24
policies can also be seen, for instance in high levels
of student debt accompanied by a relaxed schedule
for student debt repayment. Taking all of these fac-
tors into consideration, it is not so surprising that
debt can amount to one-third of gross assets – and
hence one half of net assets – in a country like
Denmark.
The burden attached to the rise in household
debt needs to be evaluated in the context of the
substantial increase in personal wealth during the
past decade. Despite the rise in wealth, in most
countries where household debt exceeds USD 1
trillion, the ratio of debt to net worth rose on aver-
age by about 50% during the period 2000–08 (see
Figure 5). Debt in the USA increased from 18.7%
of net worth in 2000 to peak at 30.5% in 2008
before falling back to 21.7% in 2011. The UK
exhibited a very similar pattern, with the debt ratio
climbing from 15.2% to 23.4% between 2000 and
2008, subsequently dropping to 20% in 2012.The
rise in the debt-wealth ratio was even more pre-
cipitous in the Netherlands and Spain, and although
the increase abated slightly to 71% in the Nether-
lands, no reduction is evident in Spain, whose ratio
is now 90% higher than it was in 2000.
Debt growth was also high in Italy, but started
from a much lower base, with the result that the
debt-wealth ratio of 11.1% in 2012 is not just the
lowest among the countries shown in Figure 5, but
also below the average for the world as a whole,
which is 17.7%. France (12.8%), Germany (16.4%)
and Japan (16.6%) have now also fallen below the
global average, with wealth in France growing
robustly enough to reduce the debt ratio by about
10% during the past decade, and Germany manag
-
ing to reduce the ratio by one-third, from 24.3% in
2000 to 16.4% in 2012. Singapore almost matched
Germany’s performance in reducing the debt bur-
den. Our estimates indicate that Malaysia and the
Philippines may have done even better, although the
data for these countries are less reliable.
Household debt in developing and transition
countries
Because personal debt is often a sensitive issue,
collecting data on debt poses special difficulties for
household surveys. This, together with the greater
prevalence of informal debt, may help explain why
measured household debt is typically low in devel-
oping countries – less than 10% of net assets
overall. But immature financial markets (and weak
property rights) also mean that household demand
for credit is often not satisfied. In addition, demand
for credit may be constrained by the fact that even
small amounts of debt can be a considerable bur-
den for the very poor in developing countries, espe-
cially when usurious interest rates are charged.
In the developing world, the absolute level of
debt is seldom more than USD 1,000 per adult, but
exceptionally high levels – above USD 5,000 per
adult – are evident in Brazil, Chile and South Africa
Figure 5
Trends in debt-wealth ratio
Source: James Davies, Rodrigo Lluberas and Anthony Shorrocks, Credit Suisse Global Wealth Databook 2012
Figure 4
Countries with high debt per adult
Source: James Davies, Rodrigo Lluberas and Anthony Shorrocks, Credit Suisse Global Wealth Databook 2012
200
180
160
140
120
100
80
60
2000 2001 2002 2003 2004 2005 2006 2007 2008 2009 2010 2011 2012
Netherlands
AustraliaItaly
Spain
France Japan Germany
Canada United Kingdom
United States
Index (base year 2000)
20000 40000 60000 80000 100000 1200000
Denmark
Norway
Switzerland
Netherlands
Australia
Ireland
United States
Sweden
United Kingdom
Canada
Hong Kong
Singapore
Japan
France
Spain
Germany
Portugal
Italy
Greece
World
Debt per adult in USD using constant country exchange rates
2012
2007
2000
GLOBAL WEALTH REPORT 2012_25