Báo cáo khoa học: Neuropeptide Y expression and function during osteoblast differentiation – insights from transthyretin knockout mice potx
Bạn đang xem bản rút gọn của tài liệu. Xem và tải ngay bản đầy đủ của tài liệu tại đây (813.19 KB, 13 trang )
Neuropeptide Y expression and function during osteoblast
differentiation – insights from transthyretin knockout
mice
Ana F. Nunes
1,2,
*, Ma
´
rcia A. Liz
1
, Filipa Franquinho
1
, Liliana Teixeira
3
, Vera Sousa
1
, Chantal
Chenu
4
, Meriem Lamghari
3,
and Mo
´
nica M. Sousa
1,
1 Nerve Regeneration, IBMC – Instituto de Biologia Molecular e Celular, Universidade do Porto, Portugal
2 ICBAS, Universidade do Porto, Portugal
3 INEB – Instituto de Engenharia Biome
´
dica, Divisa˜o de Biomateriais, Universidade do Porto, Portugal
4 Department of Veterinary Basic Sciences, The Royal Veterinary College, London, UK
Introduction
The regulation of bone remodeling has been conven-
tionally linked to local factors, hormones, and
mechanical loading [1–3]. However, in the last decade,
several reports have provided evidence that bone
homeostasis is also under the influence of central and
peripheral neural control [4–8]. This concept is sup-
ported by a number of histological studies revealing
the existence of neuropeptide fibers and neuropeptide
Keywords
amidated neuropeptide; bone marrow
stromal cells; bone mass; NPY; osteoblastic
differentiation
Correspondence
M. M. Sousa, IBMC, Rua Campo Alegre
823, 4150-180 Porto, Portugal
Fax: +351 22 6099157
Tel: +351 22 6074900
E-mail:
Website: />*Present address
iMed.UL, Faculty of Pharmacy, University of
Lisbon, Portugal
These authors contributed equally to this
work
(Received 12 November 2009, revised
3 November 2009, accepted 5
November 2009)
doi:10.1111/j.1742-4658.2009.07482.x
To better understand the role of neuropeptide Y (NPY) in bone homeosta-
sis, as its function in the regulation of bone mass is unclear, we assessed
its expression in this tissue. By immunohistochemistry, we demonstrated,
both at embryonic stages and in the adult, that NPY is synthesized by
osteoblasts, osteocytes, and chondrocytes. Moreover, peptidylglycine a-am-
idating monooxygenase, the enzyme responsible for NPY activation by
amidation, was also expressed in these cell types. Using transthyretin
(TTR) KO mice as a model of augmented NPY levels, we showed that
this strain has increased NPY content in the bone, further validating the
expression of this neuropeptide by bone cells. Moreover, the higher ami-
dated neuropeptide levels in TTR KO mice were related to increased bone
mineral density and trabecular volume. Additionally, RT-PCR analysis
established that NPY is not only expressed in MC3T3-E1 osteoblastic cells
and bone marrow stromal cells (BMSCs), but is also detectable by RIA in
BMSCs undergoing osteoblastic differentiation. In agreement with our
in vivo observations, in vitro, TTR KO BMSCs differentiated in osteoblasts
had increased NPY levels and exhibited enhanced competence in undergo-
ing osteoblastic differentiation. In summary, this work contributes to a
better understanding of the role of NPY in the regulation of bone forma-
tion by showing that this neuropeptide is expressed in bone cells and that
increased amidated neuropeptide content is related to increased bone
mass.
Abbreviations
ALP, alkaline phosphatase; BMD, bone mineral density; BMSC, bone marrow stromal cell; GAPDH, glyceraldehyde-3-phosphate
dehydrogenase; HPRT, hypoxanthine-guanine phosphoribosyltransferase; KO, knockout; microCT, micro computed tomography; NF200,
neurofilament 200; NPY, neuropeptide Y; PAM, peptidylglycine a-amidating monooxygenase; PGP9.5, protein gene product 9.5; RANK,
receptor activator of nuclear factor-jB; T
4,
thyroxine; TTR, transthyretin.
FEBS Journal 277 (2010) 263–275 ª 2009 The Authors Journal compilation ª 2009 FEBS 263
receptors in bone [9]. Neuropeptide Y (NPY)-immuno-
reactive fibers have been found to be mostly distri-
buted in association with blood vessels and in the
periosteum [10–12]. NPY immunoreactivity was dra-
matically reduced in sympathectomized animals, indi-
cating the sympathetic origin of these nerves [11].
Despite the fact that NPY-containing nerve fibers have
been described in the bone, no data exist concerning
the expression of this neuropeptide in bone cells. How-
ever, NPY has been detected in the periosteum and
bone marrow by RIA [13], particularly in megakaryo-
cytes [14]. Recently, it was additionally reported that
the NPY receptor Y1, but not Y2, Y4, Y5 or Y6, was
expressed in cultured bone marrow stromal cells
(BMSCs) and osteoblasts [15].
Despite the existence of NPY fibers and one of its
receptors in the bone, NPY knockouts (KOs) have
normal bone mass, questioning a role for NPY control
in bone activity [8]. On the other hand, different
mouse models that have in common the fact that they
present increased NPY levels, the Y2 receptor-KO and
the leptin-deficient and leptin receptor-deficient mouse
(ob ⁄ ob and db ⁄ db mice, respectively), display a high
cancellous bone mass phenotype associated with
increased osteoblast activity [5,7,16], supporting a role
for NPY in bone biology. In the case of ob ⁄ ob mice
and db ⁄ db mice, there is increased NPY activity in the
hypothalamus, owing to the lack of leptin-induced
inhibition of NPY expression [16]. Y2 receptor KO
and leptin-deficient mice share key characteristics, with
similar increases in cancellous bone mass and NPY
levels in the hypothalamus, suggesting a commonality
of mechanism. However, it was recently shown that
leptin and Y2 receptor pathways independently modu-
late cancellous bone homeostasis [17]. With regard to
Y2 receptor-deficient mice, both germline and condi-
tional hypothalamic Y2 receptor KO mice share the
same high bone mass phenotype [5], demonstrating
that central hypothalamic Y2 receptors are crucial for
this process. Interestingly, although germline Y1 recep-
tor KO mice also display increased bone formation,
conditional deletion of hypothalamic Y1 receptors did
not alter bone homeostasis, suggesting a nonhypotha-
lamic control of bone mass [6]. The Y1 receptor being
the only NPY receptor identified in the bone, these
results suggest that absence of NPY signaling in the
bone (as occurs in Y1 receptor-deficient mice) results
in increased bone mass.
NPY effects in bone mass have been further inves-
tigated by exogenous administration. Whereas intra-
cerebroventricular infusion of NPY decreased bone
mass [7], vector-mediated overexpression of NPY in
the hypothalamus of wild-type mice resulted in no
alteration in cancellous bone volume, although osteo-
blast activity, estimated using osteoid width, was
markedly reduced following adeno-associated virus
NPY injection [17,18]. These results are not in accor-
dance with the cancellous bone phenotype of the
above-mentioned mouse models of elevated NPY lev-
els. All of these opposing results make necessary a
closer look at the role of NPY in the regulation of
bone mass.
Transthyretin (TTR) KO mice show increased levels
of amidated neuropeptides, owing to overexpression of
peptidylglycine a-amidating monooxygenase (PAM)
[19], the only enzyme that a-amidates peptides, and
which is rate-limiting in the process of neuropeptide
maturation, as its substrates exist in excess [20,21].
Among the neuropeptides that are amidated by PAM,
NPY is the most abundant in both the central and the
peripheral nervous systems. As NPY requires PAM-
mediated a-amidation for biological activity [22], PAM
overexpression in TTR KO mice results in increased
levels of processed amidated NPY, without an increase
in NPY expression [19]. As a consequence of the
increased amidated NPY levels, TTR KO mice show a
significant NPY overexpressor phenotype.
Given the lack of information on the expression of
NPY in the bone, together with the controversy con-
cerning its function in bone homeostasis, we aimed at
gaining a better understanding of the role of this neu-
ropeptide in the control of bone mass by making use
of TTR KO mice, a model of increased NPY.
Results
In bone, NPY is detected in chondrocytes,
osteoblasts, and osteocytes
NPY expression was investigated in wild-type (WT)
and TTR KO bone tissue by immunohistochemistry,
using an antibody specific for the amidated form of
NPY. NPY immunolabeling was observed in bone
marrow cells, including megakaryocytes (Fig. 1Aa), as
already described in the literature [14]. The periosteum
(Fig. 1Ab) also showed NPY immunoreactivity, as
already reported for mice and rats [10–12]. However,
we observed NPY immunostaining in chondrocytes,
osteoblasts, and osteocytes (Fig. 1Ac–f, respectively,
arrows). No NPY immunoreactivity was found in
osteoclasts (data not shown). Similar to our observa-
tions in the adult bone, NPY immunoreactivity was
detected starting at embryonic day 16 in megakaryo-
cytes, osteoblasts, and chondrocytes; this NPY detec-
tion pattern was maintained at embryonic day 18
(Fig. 1B). No immunoreactivity was detected when the
NPY is expressed in osteoblasts A. F. Nunes et al.
264 FEBS Journal 277 (2010) 263–275 ª 2009 The Authors Journal compilation ª 2009 FEBS
A F
CB
D
E
ab c
d
b
a
c
e f
a
b
c
d
e
BM
M
C
C
O
C
C
C
BM
BM
Anti-osteocalcin
Anti-NPY
P
M
Os
Os
O
O
O
AC
BM
M
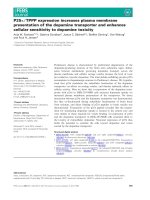
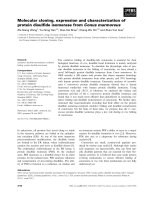
Fig. 1. NPY immunohistochemistry in the bone tissue. BM, bone marrow; C, chondrocytes; O, osteoblasts; AC, articular chondrocytes; Os,
osteocytes; M, megakaryocytes; P, periosteum. Scale bar: 50 lm. (A) NPY immunoreactivity in bone cells, namely bone marrow cells and
megakaryocytes (a), periosteum (b), articular cartilage chondrocytes (c), late proliferating chondrocytes (d), osteoblasts (e), and osteocytes
(f). Arrows indicate labeled cells, and fibers in the case of the periosteum. (B) NPY immunoreactivity in the bone at embryonic day 18, show-
ing NPY staining in megakaryocytes (a), chondrocytes (b), and osteoblasts (c). (C) Immunohistochemistry in bone sections where the anti-
body against NPY was replaced by mouse IgG. (D) NPY immunohistochemistry in NPY KO bone sections. (E) Comparison between NPY
(right) and osteocalcin (left) immunolabeling in the bone tissue. Arrows indicate labeled osteoblasts. (F) Nerve fiber (NF200 and PGP9.5)
immunohistochemistry: articular cartilage chondrocytes (a), proliferating chondrocytes (b), osteoblasts (c), bone marrow cells (d), and perios-
teum (e).
A. F. Nunes et al. NPY is expressed in osteoblasts
FEBS Journal 277 (2010) 263–275 ª 2009 The Authors Journal compilation ª 2009 FEBS 265
NPY antibody was replaced by mouse IgGs (Fig. 1C).
Moreover, in NPY KO mouse bone sections, none of
the different bone cells showed NPY immunostaining
(Fig. 1D), suggesting that the immunoreactivity
observed in WT and TTR KO bone tissue was NPY-
specific. To further demonstrate NPY synthesis in os-
teoblasts, osteoblast-specific staining was performed
with an antibody against osteocalcin (Fig. 1E, left
panel, arrow). The results obtained revealed that the
pattern of staining was comparable to that obtained
for NPY, as shown in the right panel of Fig. 1E, thus
confirming NPY expression in osteoblasts. To further
demonstrate that NPY is synthesized in these bone
cells, additional negative controls were performed.
Using antibody against neurofilament 200 (NF200) or
antibody against protein gene product 9.5 (PGP9.5),
two nerve fiber markers, no staining was observed in
chondrocytes, osteoblasts, or bone marrow cells
(Fig. 1Fa–d, respectively), whereas in the periosteum
typical nerve fiber labeling was detected (Fig. 1Fe).
TTR KO bone tissue has increased amidated NPY
levels
From the comparison between WT and TTR KO NPY
immunoreactivity in bone sections, we observed that
TTR KO bone tissue displayed increased amidated NPY
levels when compared to the wild type (Fig. 2A, arrows),
further demonstrating the expression of this neuropep-
tide by bone cells. NPY immunostaining was increased
in chondrocytes, osteoblasts, osteocytes, bone marrow
cells and megakaryocytes (Fig. 2a–e, respectively) from
TTR KO mice when compared to the same WT cells.
This result is in accordance with the increased NPY lev-
els reported in the nervous system of TTR KOs [19], sug-
gesting that the increased NPY levels in this strain are
not nervous system-restricted. Given the increased NPY
levels in TTR KO bones, PAM expression was subse-
quently evaluated in this tissue by immunohistochemis-
try; PAM was detected in bone marrow cells, including
megakaryocytes (Fig. 2Ba, arrows), osteoblasts, and
A
a
a
bc
b
c
BM
M
M
BM
d
e
B
C
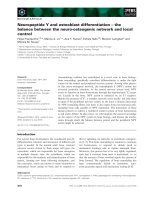
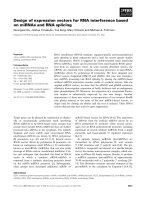
Fig. 2. Analysis of NPY and PAM in WT and
TTR KO bone sections. Scale bar: 50 lm.
(A) Comparison of NPY immunostaining in
WT and TTR KO bone sections. Arrows
indicate the different cell types in evidence
in each panel, namely articular cartilage
chondrocytes (a), proliferating chondrocytes
(b), osteoblasts (c), osteocytes (d), bone
marrow cells (BM) and megakaryocytes (M)
(e). (B) PAM immunostaining in the bone
marrow (a; arrows indicate megakaryo-
cytes), osteocytes (b; arrows), osteoblasts
(b;p arrowheads), and chondrocytes (c).
(C) Quantification of the density of PAM
immunostaining in the bone marrow of WT
and TTR KO mice.
a
P < 0.05.
NPY is expressed in osteoblasts A. F. Nunes et al.
266 FEBS Journal 277 (2010) 263–275 ª 2009 The Authors Journal compilation ª 2009 FEBS
osteocytes (Fig. 2Bb, arrowheads and arrows, respec-
tively), as well as in chondrocytes (Fig. 2Bc). The major
difference in PAM expression among WT and TTR KO
bones was found in the bone marrow, where PAM
immunostaining was approximately two-fold higher in
TTR KO mice (Fig. 2C). Despite the fact that NPY and
PAM expression were not observed in osteoclasts, the
hypothesis that increased NPY levels in the bone of
TTR KO mice may have an indirect effect on osteoclasts
existed. To address this hypothesis, preosteoclasts and
mature osteoclasts in WT and TTR KO bones were
detected by OSCAR staining. Following quantification,
no differences in osteoclast number were detected
between strains (data not shown).
TTR KO mice have increased bone mineral
density (BMD) and trabecular volume
To address whether the increased NPY levels observed
in TTR KO femurs have physiological consequences in
the bone, we started by comparing bone histology in
WT and TTR KO mice. The femur length did not dif-
fer significantly between strains (wild type,
15.6 ± 1.4 mm; TTR KO, 15.9 ± 1.0 mm). To fur-
ther analyze in detail the bone phenotype, micro com-
puted tomography (microCT) scanning analysis of
femurs, including measurement of BMD, was per-
formed. As shown in Fig. 3A (left and middle panels),
two-dimensional trabecular number and thickness were
increased in TTR KO femurs when compared with
WT femurs. Furthermore, three-dimensional trabecular
bone volume in the proximal metaphysis was also
higher in TTR KO animals (Fig. 3A, right panel).
From the statistical analysis of WT (n = 9) and TTR
KO (n = 10) femurs, the results obtained demonstrate
an increased trabecular volume (bone volume ⁄ trabecu-
lar volume) and BMD in TTR KO mice when com-
pared with WT littermates (Fig. 3B). These results
suggest that increased amidated neuropeptide levels are
related to increased bone density and volume. The
increase in bone volume was, however, detected only
in trabeculae, whereas the bone cortex was unaffected.
This result suggested that the process of endochondral
ossification might be specifically affected. To assess
this hypothesis, the growth plates of WT and TTR
KO mice were analyzed. As can be seen in Fig. 3C, no
differences were detectable by histological analysis of
growth plates from WT and TTR KO mice.
NPY is expressed in osteoblasts
To further address NPY expression in bone cells,
namely in the osteoblastic cell line MC3T3-E1, and in
primary cultures of BMSCs throughout osteoblastic
differentiation, we performed RT-PCR analysis of
NPY expression. Using brain as the positive control of
NPY expression, we detected NPY in MC3T3-E1 cells
and in both WT and TTR KO BMSCs (Fig. 4A). Fur-
thermore, both WT and TTR KO BMSCs on days 3,
7 and 14 of culture in osteogenic differentiation media
showed NPY expression; no statistical differences were
observed between WT and TTR KO BMSC cultures
throughout the differentiation period (data not
shown). To determine whether TTR KO mice BMSCs
undergoing osteoblastic differentiation recapitulate our
findings in the nervous system, i.e. show increased
PAM transcription and increased levels of amidated
NPY, without increased NPY mRNA expression, we
quantified PAM expression and the levels of the bio-
logically active neuropeptide in differentiating WT and
TTR KO BMSC cultures. As expected, TTR KO mice
BMSCs displayed increased amidated NPY levels
(approximately 2.4-fold at day 3) when compared to
WT cells (Fig. 4B). Despite the fact that the NPY con-
tent decreased over the 14 days of differentiation, indi-
cating that undifferentiated BMSCs have higher levels
of NPY than differentiated osteoblasts, these still
expressed amidated neuropeptide. One should, how-
ever, note that in WT BMSCs, NPY levels were not
altered throughout the course of BMSC differentiation
(days 3–14; Fig. 4B). Therefore, NPY should not be
regarded as either a marker of osteoblast differentia-
tion or a marker of mature osteoblasts. In agreement
with the increased NPY levels, PAM expression in
TTR KO BMSCs was increased, with a similar fold
change as that observed for the levels of amidated
NPY (Fig. 4C). Y1 expression was detected by
RT-PCR in differentiating WT and TTR KO BMSCs,
with no Y2 or Y5 receptor amplification (data not
shown), in accordance with recently published results
[15]. However, no statistical difference was observed
between the two strains regarding Y1 expression (data
not shown).
TTR KO BMSCs show increased osteoblast
differentiation
To examine whether WT and TTR KO BMSCs differ
in their capability to undergo osteoblast differentia-
tion, as a possible consequence of their differential am-
idated NPY content, isolated BMSCs from WT and
TTR KO mice were cultured under osteoblast differen-
tiation conditions. Osteoblast phenotype markers such
as alkaline phosphatase (ALP) activity and osteocalcin
expression were determined. In both cultures, ALP
activity increased in a time-dependent manner and
A. F. Nunes et al. NPY is expressed in osteoblasts
FEBS Journal 277 (2010) 263–275 ª 2009 The Authors Journal compilation ª 2009 FEBS 267
A
B
C
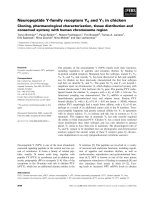
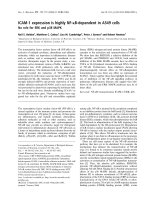
Fig. 3. MicroCT in WT and TTR KO mouse
femurs. (A) Bone microarchitecture in WT
and TTR KO mice. Left and middle panels:
2D microCT images of metaphyseal bone,
showing reconstructed longitudinal sections
(left panel) and transverse sections taken
1 mm from the growth plate (middle
panel). The line crossing the transversal
sections indicates the orientation of the
longitudinal sections. Right panel: 3D mi-
croCT images of metaphyseal trabecular
bone in WT and TTR KO mice. (B) Quantifi-
cation of trabecular volume [bone vol-
ume ⁄ trabecular volume (BV ⁄ TV)] and BMD
in WT and TTR KO mice. Results are pre-
sented as average ± standard error of the
mean.
a
P < 0.05. (C) Hematoxylin ⁄ eosin
staining of the growth plate (femur) of WT
and TTR KO mice (3 months old). Scale
bars: 50 lm.
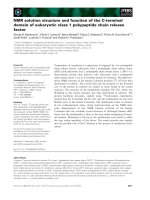
A B
C
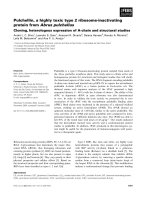
Fig. 4. NPY and PAM expression in bone
cells from WT and TTR KO mice. (A) NPY
RT-PCR analysis in brain, MC3T3-E1 cells,
and BMSCs. (B) NPY quantification in
BMSCs from WT and TTR KO mice at
days 1, 3, 7 and 14 of differentiation into
osteoblasts. (C) Semiquantitative RT-PCR
analysis of PAM expression normalized for
b-actin (left) or HPRT (right) expression in
BMSCs from WT and TTR KO mice at
days 3 and 14 of osteoblast differentiation.
Results are presented as average ± stan-
dard error of the mean;
a
P < 0.05.
NPY is expressed in osteoblasts A. F. Nunes et al.
268 FEBS Journal 277 (2010) 263–275 ª 2009 The Authors Journal compilation ª 2009 FEBS
peaked on day 7, with significantly increased levels
(ranging from two-fold to three-fold) being seen in
TTR KO osteogenic cultures at days 3 and 7 when
compared to WT cultures (Fig. 5A). Regarding osteo-
calcin expression, WT cultures displayed a time-depen-
dent increase in osteocalcin levels, with a peak of
expression on day 14 (Fig. 5B), which is characteristic
of the osteoblastic differentiation process in vitro.In
the case of TTR KO BMSCs, no increase in osteocal-
cin expression was observed from day 3 to day 7 of
differentiation, probably because those cells already
showed high osteocalcin levels at day 3 of differentia-
tion (Fig. 5B). Nonetheless, at day 14, TTR KO cul-
tures showed a significant increase in osteocalcin
expression when compared with the WT cultures
(Fig. 5B). To further confirm these data, RT-PCR was
performed using additional housekeeping genes [those
encoding glyceraldehyde-3-phosphate dehydrogenase
(GAPDH) and hypoxanthine-guanine phosphoribosyl-
transferase (HPRT)] as well as osteopontin, an extra
marker of osteoblastic differentiation. Day 3 of BMSC
differentiation was chosen for performance of the con-
firmation because, at this time point, not only ALP
activity but also osteocalcin expression are increased in
TTR KO BMSCs. The expression levels of both osteo-
calcin (Fig. 5C) and osteopontin (Fig. 5D) were always
increased in TTR KO BMSCs, irrespective of the
housekeeping gene used to perform the normalization.
Taken together, these data suggest that TTR KO
BMSCs show enhanced competence in undergoing
osteoblast differentiation in vitro.
Discussion
The data presented in this study demonstrate that
NPY is expressed in several types of bone cell, with
both in vitro and in vivo evidence. Moreover, we show
that increased NPY levels are related to increased bone
density, as well as to augmented competence in BMSC
differentiation into osteoblasts. In agreement with our
findings, a recent r eport further supports the contribution
18
16
14
12
10
8
ALP activity (nmolPNP·mg·h
–1
)
6
4
2
0
25
20
15
10
10
8
6
4
2
0
0
actin GAPDH HPRT
GAPDH
HPRT
2
4
6
8
10
12
14
b
a
a
5
0
Day 3
Day 3
Day 7
Day 7
c
b
b
TTR KO
TTR KO
WT
Day 14
Day 3 Day 7
Day 14
Day 14
WT
WT
TTR KO
b
b
WT
TTR KO
WT
osteocalcin
osteocalcin/actin
Day 3 osteocalcin/house keeping gene
Day 3 osteopontin/house keeping gene
β-actin
KO WT KO WT KO
B
A
C
D
Fig. 5. Osteoblast differentiation of WT and TTR KO BMSCs as
assessed by ALP, osteocalcin and osteopontin levels. (A) ALP activ-
ity of WT and TTR KO BMSCs under osteoblast differentiation con-
ditions at days 3, 7 and 14. (B–D) Semiquantitative RT-PCR analysis
in WT and TTR KO BMSCs of (B) osteocalcin expression, normal-
ized for the expression of b-actin, at days 3, 7 and 14, (C) osteocal-
cin expression normalized for the expression of GAPDH and HPRT
at day 3, and (D) osteopontin expression, normalized for the
expression of b-actin, GAPDH and HPRT at day 3 under osteoblast
differentiation conditions. Results are presented as average ± stan-
dard error of the mean;
a
P < 0.05;
b
P < 0.005;
c
P < 0.0005.
A. F. Nunes et al. NPY is expressed in osteoblasts
FEBS Journal 277 (2010) 263–275 ª 2009 The Authors Journal compilation ª 2009 FEBS 269
of the NPY pathway in bone homeostasis via a direct
action on osteoblasts [23]. In that report, it was shown
that chronically elevated NPY levels modulate the lev-
els of Y2 receptor expression (according to the stage
of osteoblast differentiation) and that NPY is a nega-
tive regulator of Y1 receptor expression. Moreover,
functional analysis revealed the osteogenic potential of
NPY, with osteoblast phenotype markers being signifi-
cantly enhanced in osteoprogenitor cells stimulated by
NPY, probably owing to downregulation of the Y1
receptor.
Until now, NPY expression has only been detected
in bone marrow cells, including megakaryocytes [14].
Here, we show for the first time that BMSCs also con-
tribute to NPY in the bone marrow, as NPY is
expressed both in BMSCs and in BMSCs undergoing
osteoblastic differentiation. Moreover, this article is
the first to report NPY expression in chondrocytes,
osteoblasts, osteocytes and the osteoblastic cell line
MC3T3-E1. In relation to chondrocytes, no studies
were performed regarding the role of NPY in the dif-
ferentiation of this cell type. This could probably be
the aim of a subsequent study, where possible differ-
ences in articular cartilage or growth plate between
WT and TTR KO bones should be addressed. In the
case of osteoclasts, although NPY expression was not
detected in this cell type, the elevated NPY levels in
TTR KO bones might have some indirect effect on
osteoclasts. In fact, we recently reported that NPY
modulates receptor activator of nuclear factor-jB
(RANK) ligand and osteoprotegerin, two key factors
regulating bone remodeling [23]. The inhibitory effect
of NPY on RANK ligand production by BMSCs was
also investigated by Amano et al. [24], who suggested
that the inhibitory effect of NPY on osteoclastogenesis
was caused by suppression of isoprenaline-induced
RANK ligand production by stromal cells, upstream
of RANK ligand mRNA expression.
It is known that central NPY regulates bone mass, as
conditional ablation of hypothalamic Y2 receptors
results in increased bone formation [5]. Moreover, lep-
tin-deficient mice, in which NPY is increased in the
hypothalamus, show high cancellous bone mass, but
reduced cortical production [25]. Central NPY can also
influence peripheral tissues through alterations in auto-
nomic neuronal activity. This is probably mediated by
NPY projections from the hypothalamus to the brain-
stem areas where sympathetic neuronal activity is mod-
ulated [26]. Thus, to achieve its functions, NPY may act
centrally on hypothalamic receptors and ⁄ or peripher-
ally on its osteoblastic receptor Y1 after being released
from sympathetic nerve terminals supplying the skeletal
tissue. With this work, we have opened a new window
in which NPY may additionally function as an auto-
crine factor, as it is expressed by osteoblasts as well.
We further demonstrate that TTR KO bone tissue
displays increased amidated NPY levels, when com-
pared to WT tissue, further demonstrating the expres-
sion of this neuropeptide in bone cells. In theoretical
terms, the major TTR ligands, thyroxine (T
4
) and reti-
nol, could be responsible, at least in part, for the bone
phenotype observed in TTR KO mice. Retinol defi-
ciency is known to increase BMD [27]; additionally, reti-
noic acid inhibits osteogenic differentiation of BMSCs
[28,29]. Despite the fact that TTR KO mice have retinol
plasma levels below the level of detection [30], symp-
toms of vitamin A deficiency are absent in these ani-
mals. In agreement with this, their total retinol tissue
levels are not significantly different from those of WT
mice [31]. Moreover, retinoic acid plasma levels are two-
fold to three-fold higher in TTR KO mice, probably
compensating for their low retinol levels [31]. Taking
the above into account, it is highly unlikely that, with
normal retinol levels in tissues and increased retinoic
acid levels in the plasma, an impairment in retinol
homeostasis would be responsible for the increased
BMD in TTR KO mice. Regarding thyroid hormones,
it is well known that hyperthyroidism in adult patients
leads to decreased BMD [32]. As expected, both total T
4
and tri-iodothyronine serum levels are decreased in
TTR KO mice [32,33]. However, similar to what is
described above for retinol, this decrease is unrelated to
symptoms of hypothyroidism or thyroid gland abnor-
malities [34]. Again, in terms of tissue content, TTR KO
mice show no differences in T
4
levels from WT mice
[35,36]. This euthyroid status probably arises as a conse-
quence of the high free T
4
serum pool in the TTR KO
mice [34]. Such a euthyroid status is essential for normal
skeletal development and maintenance, and therefore it
is hard to see how the bone phenotype of TTR KO mice
could be related to thyroid hormones.
It is additionally possible that in TTR KO mice, as
a consequence of PAM overexpression, increased levels
of other amidated neuropeptides may produce some
complexity. In this respect, although contradictory
results have been reported for the action in bone of
some amidated neuropeptides, such as substance P,
others, such as pancreatic polypeptide and calcitonin
gene-related peptide, have been described as stimulat-
ing the differentiation of MC3T3-E1 cells [37] or
increasing the number of bone colonies formed from
bone marrow stromal cells (MSC) in vitro [38], simi-
larly to what is reported here in the absence of TTR.
However, although not discarding the possible influ-
ence of the putative increases in the levels of other
amidated neuropeptides in this model, which should be
NPY is expressed in osteoblasts A. F. Nunes et al.
270 FEBS Journal 277 (2010) 263–275 ª 2009 The Authors Journal compilation ª 2009 FEBS
addressed in future experiments, TTR KO mice not
only show increased NPY levels when compared with
other NPY overexpression models, but also present
an accompanying NPY overexpression phenotype. This
phenotype includes decreased energy expenditure,
decreased depressive-like behavior, and increased car-
bohydrate consumption and preference, and most of
these features are not commonly observed in other
NPY overexpression models [19]. It is noteworthy that
the increased NPY levels in TTR KO mice are unre-
lated to increased NPY mRNA expression, and result
from increased processing and amidation by PAM,
which is upregulated in TTR KO animals. In fact,
although TTR is not expressed in BMSCs, PAM
expression is increased in TTR KO BMSCs, suggesting
that TTR KO osteoblasts have intrinsically augmented
PAM expression in relation to WT cells, as a conse-
quence of their physiological TTR-free environment.
A similar finding was reported for TTR KO neurons
(like BMSCs, neurons lack TTR expression), as these
cells were also shown to display intrinsically decreased
neurite outgrowth, as a consequence of their physio-
logical TTR-free environment [39].
NPY control of bone mass is still controversial. On
the one hand, there are two different mouse models
with increased NPY expression that show high cancel-
lous bone mass, the Y2 receptor KO mice [5] and mice
lacking leptin (ob ⁄ ob mice) [7,16]. Although sharing a
similar high cancellous bone phenotype, both models
differ in cortical bone regulation, with increased corti-
cal bone mass in Y2 receptor KO mice and decreased
cortical density in ob ⁄ ob mice [23]. On the other hand,
no NPY signaling in the bone, as is the case in Y1
receptor KO mice, leads to high bone mass [6], and
central NPY overexpression yields decreased osteoblast
activity [18] and bone mass [7], with no alteration in
cancellous bone volume [17,18]. With regard to this
central NPY overexpression, the consequential increase
in leptin levels [40,41] cannot be excluded as the cause
of the effects observed. Furthermore, the apparent dis-
crepancy between Y1 and Y2 receptor KO models
regarding NPY signaling and bone phenotype was
recently clarified by the hypothesis that the increased
central NPY levels observed in the Y2 receptor-defi-
cient mice lead to Y1 receptor downregulation on bone
cells, which would explain their increased bone mass
phenotype [15]. The fact that deletion of both Y1 and
Y2 receptors did not produce additive effects on
increased bone mass further supports this hypothesis,
as it suggests a common pathway from the hypothala-
mus to the bone involving both Y2 and Y1 signaling
[6], with probable central Y2 and peripheral Y1 effects
on bone tissue. The NPY KO mouse is not very help-
ful in this matter, as its bone mass is normal [8]. Here
we show that in TTR KO mice, an additional model
showing increased NPY levels, an increased cancellous
bone mass phenotype is observed, in agreement with
the Y2 receptor KO and ob ⁄ ob mouse phenotypes, fur-
ther suggesting that increased NPY content might be
related to increased cancellous bone mass. Despite all
the concerns discussed above regarding the use of
TTR KO mice as a model of increased NPY levels, the
main advantage of these animals over other NPY over-
expression models is that, in addition to the increase in
NPY levels, the leptin level is not altered [42], exclud-
ing its interference in the bone phenotype observed.
In summary, we provide evidence that NPY is
expressed in bone cells, namely in osteoblasts. Further-
more, we report that in a model of increased amidated
neuropeptide levels, showing an NPY overexpression
phenotype, an increased bone mass phenotype is pres-
ent. Finally, on the basis of these findings, further
work is needed to determine the localization of NPY
and NPY receptors during bone injury, disease, and
aging, and thereby elucidate the possible role of NPY
in the bone regeneration process.
Experimental procedures
Animals
Mice were handled according to the European Communi-
ties Council Directive (86 ⁄ 609 ⁄ EEC) and national rules,
and all studies performed were approved by the Portuguese
General Veterinarian Board. Male WT and TTR KO [33]
littermate offspring of heterozygous breeding pairs, in the
129 ⁄ Sv background, were maintained at 24 ± 1 °C under a
12 h light ⁄ dark cycle and fed regular chow and tap water
ad libitum. Prior to all experimental procedures, animals
were anesthetized with ketamine (1 mgÆg
)1
body weight) ⁄ mede-
tomidine (0.02 lgÆg
)1
body weight). Animals were killed
with an overdose of anesthetic.
Immunohistochemistry
Femurs from 3 month old male WT (n = 6) and TTR KO
(n = 5) littermates were fixed in 4% paraformaldehyde
in NaCl ⁄ P
i
, decalcified in TBD-1 commercial solution
(Thermo Electron Corporation), and embedded in paraffin;
serial 4 lm thick longitudinal sections were then cut. For
studies during embryonic development, 16 day or 18 day
WT pregnant females were killed by cervical dislocation, and
the fetuses were collected by cesarian section. Sections were
then deparaffinized, dehydrated in a modified alcohol series,
and blocked for the endogenous peroxidase activity. NPY
immunohistochemistry was performed with the MOM Kit
(Vector, Peterborough, UK), following the manufacturer’s
A. F. Nunes et al. NPY is expressed in osteoblasts
FEBS Journal 277 (2010) 263–275 ª 2009 The Authors Journal compilation ª 2009 FEBS 271
instructions. Briefly, bone sections from WT and TTR KO
mice, as well as sections from NPY KO mice (prepared simi-
larly to WT and TTR KO mouse samples; a kind gift from
H. Herzog, Garvan Institute, Australia) were incubated in
the MOM kit blocking reagent for 1 h at room temperature,
prior to incubation with the monoclonal NPY antibody
NPY05 (generously provided by E. Grouzmann, University
Hospital, Lausanne, Switzerland; diluted 1 : 2000 in MOM
diluent) for 1 h at room temperature. NPY05 is specific for
the amidated form of NPY [30]. Antigen visualization was
performed with the MOM avidin–biotinylated peroxidase
complex reagent (Vector), using 3-amino-9-ethyl carbazole
(Sigma, Lisbon, Portugal) as substrate. On parallel control
sections, the primary antibody was replaced by mouse IgG
(Sigma). Immunohistochemical investigations for NF200
and PGP9.5, both markers of nerve fibers, osteocalcin (a
positive control for osteoblast staining), PAM and OSCAR
(a marker of preosteoclasts and mature osteoclasts) were
also performed. Briefly, sections were incubated in blocking
buffer (1% BSA and 4% bovine serum in NaCl ⁄ P
i
) for
30 min at 37 °C in a moist chamber, and then incubated with
primary antibodies at the appropriate dilution in blocking
buffer, overnight at 4 °C. The dilutions used were 1 : 2500
for rabbit anti-NF200 IgG (Sigma), 1 : 4000 for rabbit anti-
PGP9.5 IgG (Serotec, Kidlington, UK), 1 : 500 for goat anti-
osteocalcin IgG (Biomedical Technologies Inc., Stoughton,
MA, USA), 1 : 500 for rabbit anti-PAM IgG (a kind gift
from R. Mains, University of Connecticut Health Center),
and 1 : 100 for mouse anti-OSCAR IgG (Santa Cruz Bio-
technology, Heidelberg, Germany). Antigen visualization
was performed with the biotin–extravidin–peroxidase kit
(Sigma), using 3-amino-9-ethylcarbazole (Sigma) as sub-
strate. On parallel control sections, the primary antibody was
replaced with blocking buffer. Immunohistochemical analy-
sis was performed independently by two observers. For
quantification of PAM immunohistochemistry, the number
of labeled cellsÆmm
)2
was scored in three nonoverlapping
micrographs with a magnification of · 40.
Bone histology
Femurs were harvested from 3 month old male WT
(n = 6) and TTR KO (n = 5) mice. After their length had
been measured, bones were fixed in 4% paraformaldehyde
in NaCl ⁄ P
i
, decalcified as described above, and embedded
in paraffin. Serial 10 lm thick longitudinal sections were
cut. Sections were then deparaffinized, dehydrated in a
modified alcohol series, and stained for hematoxylin ⁄ eosin.
MicroCT analysis
Dissected hindlimbs (femur plus tibia from WT and TTR
KO littermates, n = 9 and n = 10, respectively) were
scanned with high resolution (5 lm pixel size) microCT
(Skyscan 1172; Skyscan, Kontich, Belgium). The whole
mouse femur and tibia were reconstructed, and the trabecu-
lar bone in the proximal metaphysis, comprising a region
starting 0.25 mm from the growth plate and extending
1.5 mm (or 300 tomograms) distally, was analyzed. Histo-
morphometric analysis in two and three dimensions was
performed with Skyscan software (ct-analyser v. 1.5.1.3,
Skyscan). For analysis of trabecular bone, cortical bone
including the trabecular compartment was excluded by
operator-drawn regions of interest, and 3D algorithms
were used to determine the bone volume percentage (bone
volume ⁄ trabecular volume).
BMD measurement by microCT
Volumetric BMD values of the trabecular bone compart-
ment within the femural and tibial metaphysis were mea-
sured from the same regions of interest used to derive the
microarchitectural parameters, using the manufacturer’s
instructions. Briefly, two calibration phantoms (Skyscan)
with densities of 0.25 and 0.75 gÆcm
)3
and a sample of water
were scanned and reconstructed using the same settings used
for the femurs and tibiae. The gray scale density values were
converted into Hounsfield units, which were then used to
compute the mean volumetric BMD of each femur and tibia.
Cell cultures
MC3T3-E1 mouse osteoblastic cell line culture
MC3T3-E1 cells, established as an osteoblastic cell line from
normal mouse calvaria, were grown in alpha-MEM (Invitro-
gen, Carlsbad, CA, USA) supplemented with 10% (v ⁄ v) fetal
bovine serum (Invitrogen), 0.5% (v ⁄ v) gentamicin (Invitro-
gen), 1% (v ⁄ v) fungizone (Invitrogen), 50 lgÆmL
)1
vitamin C
(Sigma) and 10 mm b-glycerophosphate (Sigma) in a humidi-
fied 5% CO
2
incubator at 37 °C. The medium was changed
twice weekly. At confluence, the cells were trypsinized and
seeded in 24-well plates at a cell seeding density of
4 · 10
4
cells per well.
BMSC culture
Primary BMSCs were obtained according to the method
developed by Maniatopoulos et al. [43]. Briefly, femurs and
tibias from 1 month old male WT and TTR KO littermates
were aseptically excised from the hindlimbs, the epiphyses
were cut off, and the marrow was flushed with standard
culture medium, which consisted of alpha-MEM supple-
mented with 10% fetal bovine serum, 50 lgÆmL
)1
gentami-
cin sulfate, and 2.5 lgÆmL
)1
amphotericin B (Invitrogen).
Cells were seeded in 75 cm
2
plastic culture flasks, and incu-
bated in a humidified incubator (37 °C and 5% CO
2
). The
medium was changed after the first 24 h to remove nonad-
herent cells. Subsequently, the adherent cells were cultured
for 10 days, the medium being renewed every 3 days.
NPY is expressed in osteoblasts A. F. Nunes et al.
272 FEBS Journal 277 (2010) 263–275 ª 2009 The Authors Journal compilation ª 2009 FEBS
Differentiated BMSCs
BMSCs were cultured as above, trypsinized, and seeded in
24-well plates at a density of 4 · 10
4
cells per well. Cells
were then differentiated into osteoblasts by the addition of
50 lgÆmL
)1
vitamin C (Sigma) and 10 mm b-glycerophos-
phate (Sigma) to the culture medium, and cultured for 3, 7
and 14 days.
RT-PCR
Total RNA from cell culture samples was isolated with the
RNeasy Micro Kit (Qiagen) and subjected to RT-PCR with
the Superscript II kit (Invitrogen). PCR was performed for
the appropriate number of cycles for each cDNA (20–40
cycles) at 95 °C for 1 min, 56 ° C for 2 min, and 72 °C for
3 min. Sense and antisense primers were as follows: for
b-actin, 5¢-GTGGGCCGCTCTAGGCACCAA-3¢ and 5¢-CT
CTTTGATGTCACGCACGATTTC-3¢; for HPRT, 5¢-GT
AATGATCAGTCAACGGGGGAC-3¢ and 5¢-CCAGCA
AGCTTGCAACCTTAACCA-3¢; for GAPDH, 5¢-ACTCC
ACTCACGGCAAATTC-3¢ and 5¢-CCTTCCACAATGC
CAAAGTT-3¢; for NPY, 5¢-TGGACTGACCCTCGCTC
TAT-3¢ and 5¢-GATGAGGGTGGAAACTTGGA-3¢; for
osteocalcin, 5¢-CTCTGTCTCTCTGACCTCACAG-3¢ and
5¢-CAGGTCCTAAATAGTGATACCG-3¢ [44]; for osteo
pontin, 5¢-TCTGATGAGACCGTCACTGC-3¢ and 5¢-TC
TCCTGGCTCTCTTTGGAA-3¢; for PAM, 5¢-CCTGG
GGTCACACCTAAAGA-3¢ and 5¢-TGTAAGGACACAC
CGGAACA-3¢; for Y1 receptor, 5¢-CTCGCTGGTTCTCA
TCGCTGTGGAACGG-3¢ and 5¢-GCGAATGTATATCT
TGAAGTAG-3¢ [15]; for Y2 receptor, 5¢-TCCTGGATTCC
TCATCTGAG-3¢ and 5 ¢-GGTCCAGAGCAATGACTG
TC-3¢ [15]; and for Y5 receptor, 5¢-CGCTTCCATCTCAA
GCAGA-3¢ and 5¢-AAGTCGTCTACGCTGCCTCT-3¢.
Unreferenced primers were designed using primer3 (http://
frodo.wi.mit.edu/cgi-bin/primer3/primer3_www.cgi) and the
sequence from the National Centre for Biotechnology Infor-
mation database. All primers used were located on two dif-
ferent exons to ensure that only properly spliced mRNA,
and not genomic DNA contaminants, was amplified. Ethid-
ium bromide-stained gels were scanned using a Typhoon
8600 (Amersham, Chalfont St Giles, UK), and amplified
bands were quantified using imagequant software (Amer-
sham). The fluorescence density of each PCR-amplified band
was normalized with the corresponding value of b-actin,
HPRT, and ⁄ or GAPDH. Experiments were performed in
triplicate, and a representative amplification is shown.
NPY quantification
NPY (amidated NPY
1–36
) quantification was performed by
RIA with a Bachem kit (Weil am Rhein), as previously
described [19]. Cell pellets from differentiated BMSCs were
reconstituted in 250 lL of RIA buffer, for performance of
the assay with duplicate 100 lL samples. Amidated NPY
1–36
was used as a standard in serial dilutions that ranged from
1 to 128 pg per tube. In brief, test tubes were incubated
sequentially with rabbit primary antibody against NPY and
radiolabeled [
125
I]NPY tracer, for 24 h at 4 °C. Samples
were subsequently incubated with goat anti-(rabbit IgG)
and nonimmune rabbit serum for 90 min at room tempera-
ture. After centrifugation at 2500 g for 10 min, super-
natants were aspirated, and tubes were counted in a gamma
counter (Wizard 1470; Wallac, Waltham, MA, USA). The
standard curve was generated by plotting the specific bind-
ing percentage, i.e. percentage sample specific binding ⁄ total
specific binding of the assay versus the log of concentra-
tions of standards. ‘Best fit’ curves were obtained with
graphpad prism software. On the basis of the standard
curve, the concentration of NPY in each tube was calcu-
lated. NPY contents were normalized for total protein.
Total protein concentration was determined using a Nano-
Drop Spectrophotometer (NanoDrop Technologies Inc.,
Wilmington, DE, USA).
ALP activity
At defined time points, differentiated BMSCs were rinsed
twice with NaCl ⁄ P
i
and lysed in 1% (v ⁄ v) Triton X-100 in
NaCl ⁄ P
i
. ALP activity was then measured by incubation of
cell lysates for 1 h at 37 °Cin0.1m NaHCO
3
⁄ Na
2
CO
3
buffer (pH 10), containing 0.1% Triton X-100, 2 mm
MgSO
4
, and 6 mm 4-nitrophenyl phosphate. The reaction
was stopped by adding 1 m NaOH, and absorbance was
measured at 405 nm. Enzyme activity was normalized for
cell protein content, measured using the bicinchoninic acid
assay (Pierce, Rockford, IL, USA).
Statistical analysis
Statistical analysis was performed using Student’s t-test.
Results are expressed as average ± standard error of the
mean. For all statistical analysis, P < 0.05 was accepted as
being statistically significant.
Acknowledgements
We thank R. Correia (IBMC) for tissue processing,
and P. Brites (IBMC) for thoughtful suggestions. This
work was supported by Association Franc¸ aise contre
les Myopathies, France, and Fundac¸ a
˜
o para Cieˆ ncia e
Tecnologia (FCT), Portugal (PTDC ⁄ BIA-PRO ⁄ 64437 ⁄
2006). A. F. Nunes is the recipient of a fellowship
(SFRH ⁄ BD ⁄ 13062 ⁄ 2003) from FCT, Portugal. M. A.
Liz is the recipient of a fellowship (SFRH ⁄ BPD ⁄
34811 ⁄ 2007) from FCT, Portugal.
A. F. Nunes et al. NPY is expressed in osteoblasts
FEBS Journal 277 (2010) 263–275 ª 2009 The Authors Journal compilation ª 2009 FEBS 273
References
1 McDonald AC, Schuijers JA, Shen PJ, Gundlach AL &
Grills BL (2003) Expression of galanin and galanin
receptor-1 in normal bone and during fracture repair in
the rat. Bone 33, 788–797.
2 Pacifici R (1998) Cytokines, estrogen, and postmeno-
pausal osteoporosis – the second decade. Endocrinology
139, 2659–2661.
3 You L, Temiyasathit S, Lee P, Kim CH, Tummala P,
Yao W, Kingery W, Malone AM, Kwon RY & Jacobs
CR (2008) Osteocytes as mechanosensors in the inhibi-
tion of bone resorption due to mechanical loading. Bone
42, 172–179.
4 Chenu C & Marenzana M (2005) Sympathetic nervous
system and bone remodeling. Joint Bone Spine 72, 481–
483.
5 Baldock PA, Sainsbury A, Couzens M, Enriquez RF,
Thomas GP, Gardiner EM & Herzog H (2002) Hypo-
thalamic Y2 receptors regulate bone formation. J Clin
Invest 109, 915–921.
6 Baldock PA, Allison SJ, Lundberg P, Lee NJ, Slack K,
Lin EJ, Enriquez RF, McDonald MM, Zhang L,
During MJ et al. (2007) Novel role of Y1 receptors
in the coordinated regulation of bone and energy
homeostasis. J Biol Chem 282, 19092–19102.
7 Ducy P, Amling M, Takeda S, Priemel M, Schilling
AF, Beil FT, Shen J, Vinson C, Rueger JM & Karsenty
G (2000) Leptin inhibits bone formation through a
hypothalamic relay: a central control of bone mass. Cell
100, 197–207.
8 Elefteriou F, Takeda S, Liu X, Armstrong D & Karsen-
ty G (2003) Monosodium glutamate-sensitive hypotha-
lamic neurons contribute to the control of bone mass.
Endocrinology 144, 3842–3847.
9 Elefteriou F (2005) Neuronal signaling and the regula-
tion of bone remodeling. Cell Mol Life Sci 62, 2339–
2349.
10 Bjurholm A, Kreicbergs A, Terenius L, Goldstein M &
Schultzberg M (1988) Neuropeptide Y-, tyrosine
hydroxylase- and vasoactive intestinal polypeptide-
immunoreactive nerves in bone and surrounding tissues.
J Auton Nerv Syst 25, 119–125.
11 Hill EL & Elde R (1991) Distribution of CGRP-, VIP-,
D beta H-, SP-, and NPY-immunoreactive nerves in the
periosteum of the rat. Cell Tissue Res 264, 469–480.
12 Tabarowski Z, Gibson-Berry K & Felten SY (1996)
Noradrenergic and peptidergic innervation of the mouse
femur bone marrow. Acta Histochem 98, 453–457.
13 Ahmed M, Srinivasan GR, Theodorsson E, Bjurholm A
& Kreicbergs A (1994) Extraction and quantitation of
neuropeptides in bone by radioimmunoassay. Regul
Pept 51, 179–188.
14 Ericsson A, Schalling M, McIntyre KR, Lundberg JM,
Larhammar D, Seroogy K, Hokfelt T & Persson H
(1987) Detection of neuropeptide Y and its mRNA in
megakaryocytes: enhanced levels in certain autoimmune
mice. Proc Natl Acad Sci USA 84, 5585–5589.
15 Lundberg P, Allison SJ, Lee NJ, Baldock PA, Brouard
N, Rost S, Enriquez RF, Sainsbury A, Lamghari M,
Simmons P et al. (2007) Greater bone formation of y2
knockout mice is associated with increased osteoprogen-
itor numbers and altered y1 receptor expression. J Biol
Chem 282, 19082–19091.
16 Stephens TW, Basinski M, Bristow PK, Bue-Valleskey
JM, Burgett SG, Craft L, Hale J, Hoffmann J, Hsiung
HM, Kriauciunas A et al. (1995) The role of neuropep-
tide Y in the antiobesity action of the obese gene prod-
uct. Nature 377 , 530–532.
17 Baldock PA, Sainsbury A, Allison S, Lin EJ, Couzens
M, Boey D, Enriquez R, During M, Herzog H & Gard-
iner EM (2005) Hypothalamic control of bone forma-
tion: distinct actions of leptin and y2 receptor
pathways. J Bone Miner Res 20, 1851–1857.
18 Allison S, Baldock P, Enriquez R, Lin E, During M,
Gardiner E, Eisman J, Sainsbury A & Herzog H (2008)
Critical interplay between neuropeptide Y and sex
steroid pathways in bone and adipose tissue homeo-
stasis. J Bone Miner Res 24, 294–304.
19 Nunes AF, Saraiva MJ & Sousa MM (2006) Transthy-
retin knockouts are a new mouse model for increased
neuropeptide Y. FASEB J 20, 166–168.
20 Mains RE, Cullen EI, May V & Eipper BA (1987) The
role of secretory granules in peptide biosynthesis. Ann
NY Acad Sci 493, 278–291.
21 Prigge ST, Mains RE, Eipper BA & Amzel LM (2000)
New insights into copper monooxygenases and peptide
amidation: structure, mechanism and function. Cell Mol
Life Sci 57, 1236–1259.
22 Eipper BA, Stoffers DA & Mains RE (1992) The bio-
synthesis of neuropeptides: peptide alpha-amidation.
Annu Rev Neurosci 15, 57–85.
23 Teixeira L, Sousa DM, Nunes AF, Sousa MM, Herzog
H & Lamghari M (2009) NPY revealed as a critical
modulator of osteoblast function in vitro: new insights
into the role of Y1 and Y2 receptors. J Cell Biochem
107, 908–916.
24 Amano S, Arai M, Goto S & Togari A (2007) Inhibi-
tory effect of NPY on isoprenaline-induced osteoclasto-
genesis in mouse bone marrow cells. Biochim Biophys
Acta 1770, 966–973.
25 Baldock PA, Allison S, McDonald MM, Sainsbury A,
Enriquez RF, Little DG, Eisman JA, Gardiner EM &
Herzog H (2006) Hypothalamic regulation of corti-
cal bone mass: opposing activity of Y2 receptor
and leptin pathways. J Bone Miner Res 21, 1600–
1607.
26 Saper CB, Loewy AD, Swanson LW & Cowan WM
(1976) Direct hypothalamo-autonomic connections.
Brain Res 117 , 305–312.
NPY is expressed in osteoblasts A. F. Nunes et al.
274 FEBS Journal 277 (2010) 263–275 ª 2009 The Authors Journal compilation ª 2009 FEBS
27 Navia JM & Harris SS (1980) Vitamin A influence on
calcium metabolism and calcification. Ann NY Acad Sci
355, 45–57.
28 Wang A, Ding X, Sheng S & Yao Z (2008) Retinoic
acid inhibits osteogenic differentiation of rat bone mar-
row stromal cells. Biochem Biophys Res Commun 375,
435–439.
29 Takahashi T, Kamiya N, Kawabata N & Takagi M
(2008) The effect of retinoic acid on a zinc finger
transcription factor, AJ18, during differentiation of
a rat clonal preosteoblastic cell line, ROB-C20, into
osteoblasts. Arch Oral Biol 53, 87–94.
30 Grouzmann E, Comoy E, Walker P, Burnier M,
Bohuon C, Waeber B & Brunner H (1992) Production
and characterization of four anti-neuropeptide Y mono-
clonal antibodies. Hybridoma 11, 409–424.
31 Wei S, Episkopou V, Piantedosi R, Maeda S, Shimada
K, Gottesman ME & Blaner WS (1995) Studies on the
metabolism of retinol and retinol-binding protein in
transthyretin-deficient mice produced by homologous
recombination. J Biol Chem 270, 866–870.
32 Karga H, Papapetrou PD, Korakovouni A, Papa-
ndroulaki F, Polymeris A & Pampouras G (2004) Bone
mineral density in hyperthyroidism. Clin Endocrinol 61,
466–472.
33 Episkopou V, Maeda S, Nishiguchi S, Shimada K,
Gaitanaris GA, Gottesman ME & Robertson EJ (1993)
Disruption of the transthyretin gene results in mice with
depressed levels of plasma retinol and thyroid hormone.
Proc Natl Acad Sci USA 90, 2375–2379.
34 Palha JA, Episkopou V, Maeda S, Shimada K, Gottes-
man ME & Saraiva MJ (1994) Thyroid hormone
metabolism in a transthyretin-null mouse strain. J Biol
Chem 269, 33135–33139.
35 Palha JA, Hays MT, Morreale de Escobar G, Episko-
pou V, Gottesman ME & Saraiva MJ (1997) Transthy-
retin is not essential for thyroxine to reach the brain
and other tissues in transthyretin-null mice. Am J
Physiol 272, E485–E493.
36 Palha JA, Fernandes R, de Escobar GM, Episkopou V,
Gottesman M & Saraiva MJ (2000) Transthyretin
regulates thyroid hormone levels in the choroid plexus,
but not in the brain parenchyma: study in a transthyre-
tin-null mouse model. Endocrinology 141 , 3267–3272.
37 Kingery WS, Offley SC, Guo TZ, Davies MF, Clark
JD & Jacobs CR (2003) A substance P receptor (NK1)
antagonist enhances the widespread osteoporotic effects
of sciatic nerve section. Bone 33, 927–936.
38 Hosaka H, Nagata A, Yoshida T, Shibata T, Nagao T,
Tanaka T, Saito Y & Tatsuno I (2008) Pancreatic poly-
peptide is secreted from and controls differentiation
through its specific receptors in osteoblastic MC3T3-E1
cells. Peptides 29, 1390–1395.
39 Fleming CE, Saraiva MJ & Sousa MM (2007) Trans-
thyretin enhances nerve regeneration. J Neurochem 103 ,
831–839.
40 Sainsbury A, Cusin I, Doyle P, Rohner-Jeanrenaud F
& Jeanrenaud B (1996) Intracerebroventricular adminis-
tration of neuropeptide Y to normal rats increases
obese gene expression in white adipose tissue. Diabetolo-
gia 39, 353–356.
41 Sainsbury A & Herzog H (2001) Inhibitory effects of
central neuropeptide Y on the somatotropic and gonad-
otropic axes in male rats are independent of adrenal
hormones. Peptides 22 , 467–471.
42 Marques F, Sousa JC, Oliveira P, Oliveira HC & Palha
JA (2007) The absence of transthyretin does not impair
regulation of lipid and glucose metabolism. Horm
Metab Res 39, 529–533.
43 Maniatopoulos C, Sodek J & Melcher AH (1988) Bone
formation in vitro by stromal cells obtained from bone
marrow of young adult rats. Cell Tissue Res 254, 317–
330.
44 Salingcarnboriboon R, Tsuji K, Komori T, Nakashima
K, Ezura Y & Noda M (2006) Runx2 is a target of
mechanical unloading to alter osteoblastic activity
and bone formation in vivo. Endocrinology 147
, 2296–
2305.
A. F. Nunes et al. NPY is expressed in osteoblasts
FEBS Journal 277 (2010) 263–275 ª 2009 The Authors Journal compilation ª 2009 FEBS 275