Báo cáo khoa học: Functional and genetic characterization of the promoter region of apolipoprotein H (b2-glycoprotein I) ppt
Bạn đang xem bản rút gọn của tài liệu. Xem và tải ngay bản đầy đủ của tài liệu tại đây (1.18 MB, 13 trang )
Functional and genetic characterization of the promoter
region of apolipoprotein H (b
2
-glycoprotein I)
Sangita Suresh
1
, F. Yesim Demirci
1
, Iliya Lefterov
2
, Candace M. Kammerer
1
, Rosalind
Ramsey-Goldman
3
, Susan Manzi
4
and M. Ilyas Kamboh
1
1 Department of Human Genetics, Graduate School of Public Health, University of Pittsburgh, Pittsburgh, PA, USA
2 Department of Environmental and Occupational Health, Graduate School of Public Health, University of Pittsburgh, Pittsburgh, PA, USA
3 Northwestern University, Feinberg School of Medicine, Division of Rheumatology, Chicago, IL, USA
4 Division of Rheumatology and Clinical Immunology, Lupus Center of Excellence, University of Pittsburgh, Pittsburgh, PA, USA
Introduction
Human apolipoprotein H (APOH), also known as
b
2
-glycoprotein I (b
2
GPI) (here we will use APOH to
refer to the gene as used in human genome databases
and b
2
GPI to refer to the protein as commonly used
in rheumatology literature) is a major autoantigen
recognized by predominant anti-phospholipid antibod-
ies found in sera of many autoimmune diseases, such
as primary anti-phospholipid syndrome and systemic
Keywords
APOH; association; polymorphisms;
promoter; b
2
-glycoprotein I
Correspondence
M. I. Kamboh, Department of Human
Genetics, Graduate School of Public Health,
Pittsburgh, PA 15261, USA
Fax: + 1 412 383 7844
Tel: + 1 412 624 3066
E-mail:
(Received 2 September 2009, revised 1
December 2009, accepted 7 December
2009)
doi:10.1111/j.1742-4658.2009.07538.x
This study characterized the human apolipoprotein H [APOH; b
2
-glycopro-
tein I (b
2
GPI)] promoter and its variants by in vitro functional experiments
and investigated their relationship with human plasma b
2
GPI levels. We
examined the individual effects of 12 APOH promoter single nucleotide
polymorphisms in the 5¢ flanking region of APOH ( 1.4 kb) on luciferase
activity in COS-1 cells and HepG2 cells and their impact on plasma b
2
GPI
levels in 799 American White people, the DNA binding properties of the
APOH promoter using an electrophoretic mobility shift assay in HepG2
cells, the effects of serial deletion analysis of the APOH 5¢ flanking region
in COS-1 and HepG2 cells and cross-species conservation of the APOH
promoter sequence. The variant alleles of three single nucleotide poly-
morphisms ()1219G>A, )643T>C and )32C>A) showed significantly
lower luciferase expression (51, 40 and 37%, respectively) as compared with
the wild-type allele. The electrophoretic mobility shift assay demonstrated
that these three variants specifically bind with protein(s) from HepG2 cell
nuclear extracts. Three-site haplotype analysis ()1219G>A, )643T>C
and )32C>A) revealed one haplotype carrying )32A (allele fre-
quency = 0.075) to be significantly associated with decreased plasma
b
2
GPI levels (P < 0.001). Deletion analysis localized the core APOH pro-
moter to 160 bp upstream of ATG codon with the presence of critical
cis-acting elements between )166 and )65. Cross-species conservation anal-
ysis of the APOH promoters of seven species indicated that basic promoter
elements are highly conserved across species. In conclusion, we have char-
acterized the functional promoter of APOH and identified functional vari-
ants that affect the transcriptional activity of the APOH promoter.
Abbreviations
APOH, apolipoprotein H; EMSA, electrophoretic mobility shift assay; LD, linkage disequilibrium; SLE, systemic lupus erythematosus; SNPs,
single-nucleotide polymorphisms; b
2
GPI, b
2
-glycoprotein I.
FEBS Journal 277 (2010) 951–963 ª 2010 The Authors Journal compilation ª 2010 FEBS 951
lupus erythematosus (SLE) [1,2]. APOH spans 18 kb
on chromosome 17q23-24 [3] and encodes for a mature
protein of 326 amino acid residues. b
2
GPI is a 50 kDa
single-chain plasma glycoprotein exhibiting internal
homology comprised of four contiguous homologous
regions of 60 amino acid residues, and an additional
variable fifth C-terminal domain. The variable configu-
ration of the fifth domain is essential for the binding
of b
2
GPI to anionic phospholipids [4–6]. Primer exten-
sions determined alternate transcription start sites at
31 and 21 bp upstream of the APOH translation start
codon [3]. A transcription start site 31 bp upstream
agreed completely with the consensus for an initiator
element (Inr) known to sustain transcription initiation.
Previously [7], an atypical TATA box and HNF-1a
cis-elements have been identified to be critical for
APOH cell type-specific transcriptional regulation lead-
ing to differential expression of APOH in humans.
b
2
GPI is primarily expressed in the liver and sporadi-
cally in intestinal cell lines and tissues [8]. The plasma
concentration of b
2
GPI is 20 mgÆ dL
)1
, of which a
small portion is bound to lipoproteins and the rest exists
in lipid free form [9–11]. There is a wide range of inter-
individual variation in b
2
GPI plasma levels, ranging
from immunologically undetectable to as high as
35 mgÆdL
)1
, with a mean value of 20 mgÆdL
)1
in the
White population and 15 mgÆ dL
)1
in African Ameri-
cans [12], which may have clinical relevance in b
2
GPI-
related pathways. Family and heritability data have
provided strong support for the genetic basis of b
2
GPI
plasma variation, but the exact molecular basis of this
variation remains largely unknown. b
2
GPI is suggested
to regulate thrombin inactivation by heparin cofactor II
[13] and thus variation in plasma b
2
GPI may affect pro-
thrombic tendency in PAP patients. Thus, it is impor-
tant to determine the molecular basis of b
2
GPI plasma
variation. Previously we have shown that two single
nucleotide polymorphisms (SNPs) in coding regions
(Cys306Gly, Trp316Ser) [12,14] and one SNP in the
promoter ()32C>A) [15] region of APOH have a sig-
nificant impact on b
2
GPI plasma variation. Since then
we have characterized the complete DNA sequence vari-
ation in APOH and identified 150 SNPs, including 13
SNPs and one deletion ()742delT) in the 5¢ region [16].
Variations in the promoter DNA sequence may
potentially alter the affinities of existing protein–DNA
interactions or recruit new proteins to bind to the
DNA, altering the specificity and kinetics of the tran-
scriptional process. Given the importance of promoters
in harboring functionally relevant SNPs that regulate
gene expression and phenotypic variation, it is impor-
tant to examine the role of promoter SNPs in relation
to disease, gene expression and corresponding plasma
levels. Recently we have reported associations of
APOH promoter SNPs with SLE risk and carotid pla-
que formation in SLE patients [17].
The objectives of this study were: to characterize a
1.4 kb (1418 bp) genomic fragment in the 5¢ region
of human APOH to identify the functional promoter;
to examine the impact of all 13 reported APOH pro-
moter SNPs in the White population ()1284C>G,
)1219G>A, )1190G>C, )759 A>G, )700C>A,
)643T>C, )38G>A and )32C>A) and African
Americans ()1076G>A, )1055T>G, )627A>C,
)581A>C and )363C>T) on APOH gene expression;
to determine the association of eight promoter SNPs
in a White population on b
2
GPI levels among Ameri-
can White people; and to determine the cross-species
conservation of the APOH promoter sequence.
Results
Identification and characterization of the APOH
promoter region
In order to localize the active promoter region and to
identify regions that are important for the regulation of
human APOH expression, the wild-type 1418 bp 5¢
flanking region of APOH was amplified from genomic
DNA and used as a template to create a series of five
different deletion constructs containing 5¢ truncated
fragments of APOH promoter fused upstream to a pro-
moterless firefly luciferase gene of the pGL3-basic
reporter vector. The sequence of each construct was
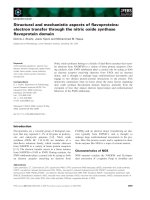
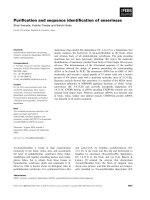
verified by sequencing (data not shown). Figure 1A
shows the expression of deletion mutants in COS-1
cells. 5¢ deletions of the promoter sequence to )815
(Del mutant 1, )815 ⁄ +43) and )575 (Del mutant 2,
)575 ⁄ +43) increased promoter activity slightly com-
pared with the wild-type, but the difference was not sig-
nificant (wild-type versus Del mutant 1; P = 0.260,
wild-type versus Del mutant 2; P = 0.135). Successive
removal of nucleotides from )575 (Del mutant 2,
)575 ⁄ +43) to )325 (Del mutant 3, )325 ⁄ +43)
enhanced promoter activity appreciably (wild-type ver-
sus Del mutant 3; P = 0.019), suggesting the possibil-
ity of negative regulatory elements within the
)575 ⁄ )325 regions. The Del mutant 3 construct
()325 ⁄ +43) conferred maximum luciferase activity in
COS-1 cells. A slight decrease in promoter activity was
observed after further deletion of a sequence from )325
to )166 (Del mutant 4, )166 ⁄ +43; P = 0.04). How-
ever, when the sequence from )166 to )65 was
removed (Del mutant 5, )65 ⁄ +43), promoter activity
dropped significantly (P < 0.001) compared with the
wild-type. This suggests the presence of a critical
Functional characterization of APOH promoter S. Suresh et al.
952 FEBS Journal 277 (2010) 951–963 ª 2010 The Authors Journal compilation ª 2010 FEBS
element in the region extending between )166 and )65.
We replicated the deletion analysis using the human
HepG2 cell line, as liver is a major site of synthesis of
b
2
GPI and found an overall similar trend as seen in
COS-1 cells, with Del mutant 3 ()325 ⁄ +43) showing
the highest and Del mutant 5 ()65 ⁄ +43) showing the
lowest (P < 0.001) promoter activity (Fig. 1B). A
slight difference in trend was observed for the wild-
type, mutant 1 ()815 ⁄ +43) and mutant 2 ()575 ⁄ +43)
constructs, wherein mutant 1 was lower than the wild-
type for HepG2, but not in COS-1 cells. Thus, using
both COS-1 and HepG2 cell lines, we identified the
region 166 bp upstream of the translation start site
as the basal promoter of human APOH containing key
cis-acting elements that regulate APOH expression.
Functional characterization of APOH promoter
SNPs
In order to investigate the differential allele-specific
effect on promoter activity, pGL3-basic–APOH
promoter constructs harboring individual point
mutations for 12 of 14 APOH promoter sequence vari-
ants identified earlier [16] ()1284C>G, )1219G>A,
)1190G>C, )1076G>A, )1055T>G, )759A>G,
)700C>A, )643T>C, )627A>C, )363C>T, )38G>
A and )32C>A) were generated. The relative luciferase
activity assessed in three independent experiments per-
formed in triplicate for all the above APOH promoter
SNPs is listed in Table 1. The insertion ⁄ deletion
polymorphism ()742delT) could not be characterized
A
Luc
Luc
B
0.00 20.00 40.00 60.00 80.00 100.00
Del mutant 5
Del mutant 4
Del mutant 3
Del mutant 2
Del mutant 1
Wild-type
pGL3-B
*
0.00 2.00 4.00 6.00 8.00
Del mutant 5
Del mutant 4
Del mutant 3
Del mutant 2
Del mutant 1
Wild-type
pGL3-B
*
Fig. 1. (A) Dual luciferase reporter gene expression of APOH promoter deletion mutants in COS-1 cells. Left panel, schematic representation
of 5¢ deleted fragments of the APOH promoter in conjunction with the luciferase gene in pGL3-basic vector. The nucleotides are numbered
from the translation start site (ATG). The effect of the wild-type and mutants was measured as the mean of the firefly luciferase levels nor-
malized by the Renilla luciferase activity, which served as the reference for the transfection efficiency. The results presented are from one
of three independent experiments. pGL3-B indicates the promoterless vector. The asterisk indicates that Del mutant 5 had significantly lower
luciferase activity than the wild-type (P < 0.001). (B) Dual luciferase reporter gene expression of APOH promoter deletion mutants in HepG2
cells. Left panel, schematic representation of 5¢ deleted fragments of the APOH promoter in conjunction with the luciferase gene in pGL3-
basic vector. The nucleotides are numbered from the translation start site. The effect of the wild-type and mutants was measured as the
mean of the firefly luciferase levels normalized by the Renilla luciferase activity, which served as the reference for the transfection effi-
ciency. The results presented are from one of two independent experiments. pGL3-B indicates the promoterless vector. The asterisk indi-
cates that Del mutant 5 had significantly lower luciferase activity than the wild-type (P < 0.001).
S. Suresh et al. Functional characterization of APOH promoter
FEBS Journal 277 (2010) 951–963 ª 2010 The Authors Journal compilation ª 2010 FEBS 953
due to repetitive sequences in the surrounding region.
Similarly, the )581A>C mutant construct was not
successful.
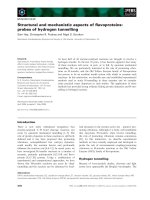
Three SNPs were found to be significantly associated
with differential gene expression (36% or higher differ-
ence at P < 0.001), including two previously reported,
)643T>C [17] and )32C>A [15]. An additional SNP,
)1219G>A, showed a significant difference of 51%
in luciferase gene expression between wild-type and
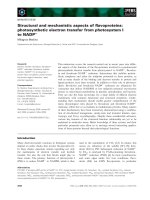
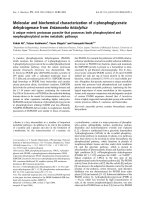
mutant alleles (Fig. 2). An electrophoretic mobility
shift assay (EMSA) was performed in order to deter-
mine whether the APOH promoter )1219G>A SNP
affects the binding activity of nuclear factors. Upon
incubation of radiolabeled oligonucleotides specific for
wild-type ()1219G) and mutant ()1219A) alleles with
HepG2 nuclear extracts, DNA–protein complexes were
observed, indicating the presence of nuclear factor(s)
(Fig. 3). Competition assays using increasing amounts
of unlabeled wild-type oligonucleotides confirmed the
specificity of the binding.
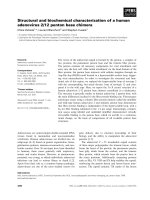
Potential liver-specific transcription factor binding
sites for the three promoter SNPs that showed
differential gene expression ()1219G>A, )643T>C
and )32C>A) were sought by using the matin-
spector program ( />MatInspector/index.html) [18], which matches by
comparing DNA sequences with weighted matrix
descriptions of functional binding sites, based on the
TRANSFAC database (). Fig-
ure 4 shows the locations of these three functional
SNPs relative to potential binding sites, together with
all other SNPs detected in the 5¢ flanking region. The
list of all the predicted transcription factors, including
their consensus sequences and specific binding sites, is
given in Table S1. The program identified binding
sites for the ) 1219G>A and )643T>C SNPs
(Fig. 4). Although the binding site for HNF1 was
observed adjacent to the )1219G>A SNP site, the
)643T>C SNP region showed binding to CLOX and
CLOX homology CCAAT displacement protein fac-
tors. EMSA results previously reported by us [15]
Table 1. Dual luciferase results of each APOH promoter construct
in COS-1 cells.
SNPs
Wildtype
allele
(Mean ± SD)
Variant
allele
(Mean ± SD)
%
decrease P-value
CG
)1284C>G 5.06 ± 0.10 4.16 ± 0.36 17.79 0.014
5.27 ± 0.06 4.56 ± 0.34 13.47 0.023
5.55 ± 0.46 4.64 ± 0.46 16.40 0.075
GA
)1219G>A 2.86 ± 0.05 1.40 ± 0.01 51.05 < 0.001
4.10 ± 0.21 2.06 ± 0.16 49.76 < 0.001
3.70 ± 0.12 1.81 ± 0.08 51.08 < 0.001
GC
)1190G>C 3.01 ± 0.19 2.16 ± 0.03 28.24 < 0.01
2.79 ± 0.19 1.98 ± 0.23 29.03 < 0.01
3.93 ± 0.50 2.84 ± 0.08 27.74 < 0.01
GA
)1076G>A 10.01 ± 0.38 9.13 ± 0.86 8.79 0.178
10.86 ± 0.53 9.98 ± 0.60 8.10 0.129
8.40 ± 0.47 7.74 ± 0.07 7.86 0.075
TG
)1055T>G 4.66 ± 0.18 3.44 ± 0.17 26.18 < 0.01
7.66 ± 0.53 6.13 ± 0.04 19.97 < 0.01
3.49 ± 0.09 2.53 ± 0.14 27.51 < 0.01
AG
)759A>G 5.28 ± 0.29 4.57 ± 0.11 13.45 0.017
4.82 ± 0.27 4.27 ± 0.18 11.41 0.042
4.90 ± 0.12 4.38 ± 0.50 10.61 0.155
CA
)700C>A 4.65 ± 0.05 4.31 ± 0.10 7.31 < 0.01
4.90 ± 0.17 4.58 ± 0.33 6.53 0.214
4.27 ± 1.32 3.99 ± 0.51 6.56 0.745
TC
)643T>C 19.91 ± 1.68 11.94 ± 0.15 40.03 0.001
5.73 ± 0.07 3.20 ± 0.24 44.15 < 0.001
10.79 ± 0.88 6.26 ± 0.39 41.98 0.002
AC
)627A>C 3.09 ± 0.15 2.85 ± 0.11 7.77 0.086
6.72 ± 0.31 6.18 ± 0.12 8.04 0.049
5.75 ± 0.23 5.12 ± 0.01 10.96 0.009
CT
)363 C>T 3.82 ± 0.34 3.34 ± 0.25 12.57 0.117
2.96 ± 0.49 2.42 ± 0.40 18.24 0.212
2.88 ± 0.16 2.44 ± 0.26 15.28 0.065
GA
)38G>A 4.56 ± 0.15 3.62 ± 0.15 20.61 0.002
3.95 ± 0.20 3.21 ± 0.17 18.73 0.009
3.81 ± 0.09 3.16 ± 0.03 17.06 < 0.001
CA
)32C>A 18.91 ± 0.38 11.92 ± 0.39 36.96 < 0.001
15.79 ± 1.03 10.32 ± 0.17 34.64 < 0.001
16.71 ± 0.92 10.56 ± 0.06 36.8 < 0.001
0
0.5
1
1.5
2
2.5
3
3.5
4
4.5
5
Relative luciferase activity
1.00
Experiment I
pGL3-Basic
2.86
1.40
*
1.
Wild-type (–1219G)
.00
4.10
Experiment II
2.06
*
1.00
3
Experiment III
Mutant (–1219A)
3.70
1.81
*
Fig. 2. Dual luciferase reporter gene expression of the APOH
promoter )1219G>A SNP (*P < 0.0001). The results of three
independent experiments are shown.
Functional characterization of APOH promoter S. Suresh et al.
954 FEBS Journal 277 (2010) 951–963 ª 2010 The Authors Journal compilation ª 2010 FEBS
have revealed that the )32C>A SNP disrupts the
binding of crude mouse hepatic nuclear extracts and
purified transcription factor II D, which is part of the
RNA polymerase II preinitiation complex, indicating
its functional role in the transcriptional regulation of
APOH promoter. However, in silico analysis using the
matinspector program for liver-specific factors did
not identify any liver-specific transcription factor to
bind to the region including the )32C>A SNP.
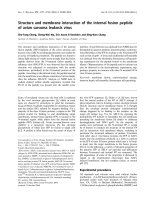
In order to determine the cross-species conservation
of the APOH promoter sequence, we used the ECR
Browser ( to visualize the
conservation profile of the 5¢ region of APOH
(1418 bp; )1375 ⁄ +43 nucleotides from the translation
initiation codon ATG) to identify the evolutionary
conserved regions. Figure 5 shows the graphical dis-
play of the pairwise alignments and comparisons of
sequences from six other species (monkey, dog, cow,
mouse, rat, opossum) with that of human (base gen-
ome). Consistent with our deletion analyses, which
indicated the presence of critical promoter elements
in the region spanning between )166 and )65, the
evolutionary conserved region extending from the 5¢
end of the gene (exon + UTR) to the immediately
upstream region ( 250 bp upstream of the ATG
start codon) was highly conserved across all seven
species.
APOH promoter SNPs and plasma b
2
GPI levels
The distribution of plasma b
2
GPI levels showed only
a modest difference (17.90 ± 4.15 mgÆdL
)1
versus
18.72 ± 4.68; P = 0.054) in mean plasma b
2
GPI lev-
els between cases (n = 241) and controls (n = 206).
Therefore, the association analyses were carried out
using the combined case + control cohort data. Step-
wise regression analysis revealed that age, body mass
index and ever smoking were the significant determi-
nants of plasma b
2
GPI levels. Only the )32C>A SNP
showed significant associations with the adjusted mean
plasma b
2
GPI levels in both single-site (P < 0.001)
and multiple regression (P < 0.001) analyses. Mean
plasma b
2
GPI levels were higher in homozygotes
of the wild-type allele, CC (mean = 18.62 mgÆdL
)1
),
compared with both the heterozygotes, CA (mean =
16.24 mgÆdL
)1
), and homozygotes of the less common
allele, AA (mean = 13.90 mgÆdL
)1
). An eight-site hap-
lotype analysis including six APOH promoter SNPs
(present in White people) and two coding SNPs identi-
fied a total of 11 haplotypes with a frequency of
> 1% (Table 2). Because data for plasma b
2
GPI levels
were only available for the White population, we
excluded the five SNPs present in the Black popula-
tion. Out of the eight SNPs present in White people,
the )1284C>G SNP was excluded due to its rare pres-
ence (MAF < 0.01) and the )700C>A SNP was
excluded because of its high linkage disequilibrium
(LD) to )759A>G as shown previously [17]. Three
haplotypes (H5, H6, H10) showed a significant associa-
tion with plasma b
2
GPI levels (P < 0.001). The haplo-
type H5 harbored minor alleles for the )1190G>C,
)32C>A and Trp316Ser SNPs. The other two signifi-
cant haplotypes were predominantly defined by the
minor alleles of the two coding polymorphisms (H6:
Cys306Gly; H10: Trp316Ser) that are already known
to be major determinants of plasma b
2
GPI levels.
Although the )32C>A SNP was significant in the sin-
gle-site analysis, the other haplotype (H7) defined by
minor alleles only at the )1190G>C and )32C>A
SNPs and not for Trp316Ser did not show significant
association, suggesting that the effect of the
)1190G>C and )32C>A SNPs is dependent upon
Trp316Ser polymorphism. None of the individual hapl-
otypes harboring less common alleles for the
)643T>C (H2 and H9) and )1219G>A SNPs (H4)
that significantly decrease gene expression in vitro
showed significant impact on plasma b
2
GPI levels. A
three-site haplotype analysis (data not shown) with the
functionally relevant (based on dual luciferase and
EMSA data) )1219G>A, )643T>C and )32C>A
SNPs was consistent with the individual SNP results.
–1219 A (Mutant)
–1219 G (Wild–type)
_______________________________________ ______________________________
Lane 1 2 3 4 5 6 7 8 9 10 11 12
Extract– + + + + ++++ + + +
Competitor – – 1x 5x 20x 50x 100x 1x 5x 20x 50x
100x
Fig. 3. EMSA result for )1219G>A polymorphism. Each sample
contained a mixture of 5 l g of nuclear extract derived from human
HepG2 cell nuclear extract and 30xmer [
32
P]-labeled wild-type oligo-
nucleotide containing G allele. The arrow indicates a specific DNA–
protein complex associated with the )1219G>A polymorphic site.
Lane 1, labeled oligonucleotide without nuclear extract from HepG2
cells; lane 2, labeled oligonucleotide with nuclear extracts. Lanes
3–7 had increasing amounts of G oligonucleotide competitor (1, 5,
20, 50, 100·, respectively); lanes 8–12 had increasing amounts of
A oligonucleotide competitor (1, 5, 20, 50, 100·, respectively).
S. Suresh et al. Functional characterization of APOH promoter
FEBS Journal 277 (2010) 951–963 ª 2010 The Authors Journal compilation ª 2010 FEBS 955
Fig. 4. MATINSPECTOR results for the liver-specific transcription factor binding sites of the APOH promoter. The transcription factors are shown in
green together with the exact binding position marked by a dotted line; the APOH promoter SNPs are in red. The ATG start codon is highlighted
in grey. Bases in purple indicate the repeat region, those in green indicate the untranslated region (UTR), and those in dark blue indicate Exon 1.
Functional characterization of APOH promoter S. Suresh et al.
956 FEBS Journal 277 (2010) 951–963 ª 2010 The Authors Journal compilation ª 2010 FEBS
That is, only the haplotype carrying )32A was signifi-
cantly associated with decreased plasma b
2
GPI levels
(P < 0.001).
Discussion
The aims of this study were: (a) to clone and charac-
terize a 1418 bp fragment of the 5¢ region of APOH;
(b) to functionally characterize the APOH promoter
SNPs present in the 1418 bp fragment; (c) to examine
the effect of the APOH promoter SNPs on plasma
b
2
GPI levels; and (d) to determine the cross-species
conservation of the APOH promoter sequence.
To identify regions of the APOH promoter that
affect its basal transcription, several 5¢ promoter dele-
tion mutants were linked to the luciferase reporter gene
and assayed. Promoter constructs containing either
)1375 ⁄ +43 (wild-type) or )166 ⁄ +43 (Del mutant 4)
of the upstream sequence had similar high levels of
basal transcriptional activity when transfected into
either COS-1 or HepG2 cell lines. These results indi-
cate that all of the necessary machinery for driving
basal APOH expression is localized in this )166 ⁄ +43
sequence. Further deletion from )166 to )65 revealed
regions within the APOH promoter that are important
for its function. This deletion resulted in an 60%
decrease in transcriptional activity in COS-1 cells and
an even more pronounced ( 98%) decrease in HepG2
cells, indicating the presence of an activator motif(s)
within this sequence. These results are consistent with
the previous deletion analysis [7] that identified the
proximal promoter region necessary for hepatic-specific
APOH expression. The smallest APOH 5¢ deletion
mutant ()65 ⁄ +43) used in this study differed from the
previous study [7] as it lacked both the critical cis-ele-
ments (TATTA and HNF -1a) identified within this
region, whereas the smallest deletion mutant used in
the previous study [7] lacked only the TATTA element.
Despite this difference, our study replicated the key
findings in which the smallest 5¢ deletion mutant
almost completely abolished luciferase activity by
98% (present study) and 91% [7] in HepG2 cells,
emphasizing the vital role of the TATTA cis-element
in APOH transcription. Our cross-species conservation
analysis of APOH promoters from different species
indicates that basic promoter elements are highly con-
served across the seven species examined.
Approximately one-third of promoter variants exert
a functional effect on gene expression [19]. The func-
tional importance of the APOH promoter SNPs was
predicted by allelic differences in expression of the
luciferase reporter gene. In this study, we ‘functionally’
validated SNPs in the APOH promoter based on two
experimental approaches (reporter assays and EMSA).
For this purpose, we tested 12 of the 14 sequence vari-
ants located within the 1418 bp of the 5¢ flanking
region of APOH for allele-specific regulatory effects on
the expression of the dual luciferase reporter gene and
by EMSA for SNPs within transcription factor binding
sites. Of the 12 SNPs examined, three SNPs at posi-
tions )1219G>A, )643T>C and )32C>A showed a
significant decrease in luciferase expression ( 50%,
Fig. 5. ECR Browser conservation profile of the 5¢ region of APOH (1418 bp; )1375 ⁄ +43 nucleotides from the translation initiation codon
ATG). Sequence elements of significant length (‡ 100 nucleotides) that are conserved above a certain level of sequence identity (‡ 65%)
between the two compared genomes are highlighted as evolutionary conserved regions (pink rectangles at the top of the graphs). The hori-
zontal axis represents positions in the base genome (human) and the vertical axis represents the percentage identity between the base and
aligned genomes (monkey, dog, cow, mouse, rat and opossum). The color-coding used by ECR Browser is: blue for coding exons, yellow
for UTRs, red for intergenic regions, and green for transposable elements and simple repeats.
S. Suresh et al. Functional characterization of APOH promoter
FEBS Journal 277 (2010) 951–963 ª 2010 The Authors Journal compilation ª 2010 FEBS 957
Table 2. Haplotype analysis of APOH SNPs for plasma b
2
GPI levels using R software (HAPLO.STATS package). P-values were calculated from coefficients and standard errors (SE). The
regression model included disease, age, body mass index, ever smoking. Only haplotypes with more than 0.01 total frequencies are shown.
Haplotype
rs8178819
()1219G>A)
rs3760290
()1190G>C)
rs817820
()759A>G)
rs3760292
()643T>C) ()38G>A)
rs8178822
()32C>A)
rs1801689
(Cys306Gly)
rs1801690
(Trp316Ser)
Cases and controls
Frequency Coefficent SE P
Base
haplotype
G G A T G C T G 0.384 – – –
H1 G C G T G C T G 0.156 )0.218 0.408 0.539
H2 G G A C
a
G C T G 0.098 0.791 0.534 0.139
H3 G C A T G C T G 0.081 0.301 0.538 0.576
H4 A
a
C G T G C T G 0.062 )0.046 0.675 0.946
H5 G C A T G A
c
TC
b
0.042 )4.632 0.737 < 0.001
H6 G G A T G C G
b
G 0.038 )5.439 0.739 < 0.001
H7 G C A T G A
c
T G 0.023 )1.271 1.031 0.218
H8 G G A T A C T G 0.017 0.280 1.128 0.804
H9 G G G C
a
G C T G 0.013 )0.097 1.255 0.938
H10 G C A T G C T C
b
0.013 )4.748 1.247 < 0.001
H11 G G G T G C T G 0.011 )0.727 1.453 0.617
Rare
haplotype
– – – – – – – – 0.062 )1.604 – 0.024
a
Alleles found to decrease gene expression in vitro.
b
Alleles found to be significantly associated with low plasma b2GPI levels in univariate analysis.
c
Alleles found to decrease gene expression in vitro and also associated with low plasma b2GPI levels in univariate analysis.
Functional characterization of APOH promoter S. Suresh et al.
958 FEBS Journal 277 (2010) 951–963 ª 2010 The Authors Journal compilation ª 2010 FEBS
40% and 36%, respectively) in COS-1 cells. The
)32C>A SNP is a part of the core APOH promoter
region ()166 bp upstream from ATG) identified in this
study and has been previously shown to play a key
role in the transcription initiation process by serving as
a site for the binding of transcription factor II D [15].
Although 5¢ serial deletion of the APOH promoter
identified the basal transcriptional activity restricted to
the region 160 bp upstream of ATG codon, it does
not eliminate the possibility of the functional roles of
the )643T>C and )1219G>A SNPs as part of the
extended APOH promoter transcriptional machinery.
To further substantiate the functional relevance of the
three APOH promoter SNPs ()1219G>A, )643T>C
and )32C>A), EMSA revealed strong in vitro protein
binding for both wild-type and mutant-type oligo-
nucleotides for each SNP using nuclear extracts of
HepG2 cells. However, no significant differential
binding was observed for the two alleles for all SNPs.
In silico analysis using the matinspector program
for the prediction of liver-specific transcription factor
binding sites revealed potential binding sites for the
)1219G>A and )643T>C SNPs (Fig. 4). Binding of
an important liver-enriched transcription factor, HNF1,
was observed adjacent to the )1219G>A polymorphic
site, which could explain the functional relevance of
this SNP. HNF1 plays a prominent role in regulating
genes that are expressed in hepatocytes [20]. The
)643T>C SNP region binds to CLOX and CLOX
homology CCAAT displacement protein factors, which
have been previously reported as transcriptional repres-
sors [21]. This could probably explain the decrease in
reporter gene expression observed by the mutant allele.
In addition to characterizing the basal APOH pro-
moter and its functional variants, the effect of the
APOH promoter SNPs on plasma b
2
GPI levels was
examined for a subgroup of the Pittsburgh White pop-
ulation (SLE cases, n = 241; controls, n = 206). In
univariate analysis, only the previously reported
)32C>A SNP showed a significant effect after adjust-
ment for covariates. None of the other APOH pro-
moter SNPs used in this study had a significant effect
on plasma b
2
GPI levels. Our previous report [17] sug-
gested a role for the )643T>C polymorphism protect-
ing against carotid plaque formation in autoimmune-
mediated atherosclerosis in SLE patients and the
)1219G>A SNP showed a moderate effect on lupus
nephritis. A functional role for the two SNPs was
established using promoter gene assays and EMSA.
Despite the functional effects of the )1219G>A and
)643T>C SNPs on gene expression, their lack of
association with plasma b
2
GPI levels is interesting.
Although in vitro luciferase assays measuring promoter
activity suggest that the two polymorphisms show an
effect on gene expression, this may not be an entirely
true reflection of the complexity of regulation that
occurs in vivo. The regulation of human gene expres-
sion is a critical, highly coordinated and complex pro-
cess. The core promoter is generally within 50 bp of
the transcription start site, where the preinitiation
complex forms and the general transcription machinery
assembles [22]. The extended promoter can contain
specific regulatory sequences that control spatial and
temporal expression of the downstream gene. The tran-
scription machinery, which consists of interconnected
coregulatory protein complexes in a regulatory net-
work, is responsible for mRNA synthesis from a given
promoter. Control of gene regulation could occur at
various stages, including the level of transcription,
post-transcriptional regulation, alternative splicing,
translation, post-translational modification and secre-
tion of b
2
GPI, all of which may have an effect on the
quantitative measure of plasma b
2
GPI levels. Alterna-
tively, it is also possible that a change in promoter
activity does not necessarily result in a quantitative
change at the protein level. Whether the APOH pro-
moter SNPs ( )643T>C and )1219G>A) could influ-
ence the promoter activity by either the former or
latter methods is beyond the scope of in vitro experi-
ments. Further studies will be needed to explore the
mechanism for these associations.
APOH promoter SNPs explain a small proportion
of the variance in APOH expression. Therefore, the
ability of these SNPs to influence plasma b
2
GPI levels
may be obscured by the strong effects of other factors
(undefined promoter elements that are in strong LD
with the promoter SNPs and other regulatory factors
that affect in vivo gene expression) in aggregate. How-
ever, given the reporter gene expression data on pro-
moter activity and EMSA results indicating possible
binding to transcription factors, there is clearly a func-
tional effect of the two polymorphisms on APOH reg-
ulation that is worthy of further investigation.
However, haplotype analysis including APOH pro-
moter SNPs alone or in conjunction with previously
known coding SNPs affecting plasma b
2
GPI levels
(Cys306Gly and Trp316Ser, Table 1) gave us no new
insights into determining the genetic basis of plasma
b
2
GPI levels. The significant haplotypes were defined
predominantly by the minor alleles at the coding
SNPs, which are already known to have a major effect
on b
2
GPI levels. Consistent with the univariate data,
none of the haplotypes defined by the minor alleles at
the APOH promoter SNPs reached significance.
Although the )32C>A SNP was significant in the
univariate analysis, the individual haplotype (H7)
S. Suresh et al. Functional characterization of APOH promoter
FEBS Journal 277 (2010) 951–963 ª 2010 The Authors Journal compilation ª 2010 FEBS 959
harboring the minor allele )32A was not significant,
indicating that the effect of the )32C>A SNP is
dependent upon the presence of the Trp316Ser coding
SNP, which is in strong LD with the )32C>A SNP,
as shown in haplotype H5. A three-site haplotype anal-
ysis with only the APOH promoter functionally rele-
vant SNPs ()643T>C, )1219G>A and )32C>A)
showed a highly significant effect for the haplotype
defined by the )32A allele and also a moderate effect
for the )1219A allele. Another questionable mecha-
nism for the lack of association of APOH promoter
SNPs on plasma b
2
GPI levels in this study is the modi-
fied capture-ELISA method that was used to determine
the plasma b
2
GPI levels, wherein the analyzed anti-
bodies could have been targeted against only a small
number of the antigenic sites in b
2
GPI. Therefore,
given both the method and also the small sample size,
further studies are warranted in larger cohorts using
improvised methods (antibody titers measured against
other ⁄ additional b
2
GPI sites) that will help to delineate
better the molecular basis of plasma b
2
GPI levels.
Materials and methods
Construction of APOH promoter luciferase
reporter gene vector (wild-type and individual
mutant constructs)
A 1418 bp fragment of the human APOH 5¢ region
()1375 ⁄ +43 nucleotides from the translation initia-
tion codon ATG) containing the promoter and the first
untranslated exon was PCR amplified using for-
ward (5¢-TGGCAGCACACTCTTCTTAT-3¢) and reverse
(5¢-GTTCTCGAGTTTTCTCTGCC-3¢) primers. This
APOH promoter fragment was amplified from an individ-
ual who had wild-type alleles for all 13 SNPs ()1284C>G,
)1219G>A, )1076G>A, )1055T>G, )1190G>C,
)759A>G, )700C>A, )643T>C, )627A>C, )581A>C,
)363C>T, )38G>A, )32C>A) and no deletion at )742
site. The PCR condition consisted of denaturation at 95 °C
for 2 min, followed by 35 cycles of denaturing at 95 °C for
30 s, annealing at 55 °C for 30 s and extension at 72 °C for
1 min, before a final extension at 72 °C for 10 min. The
PCR-generated fragment was cloned into the pCR-2.1-
TOPO vector (Invitrogen Corporation, Carlsbad, CA,
USA) using the supplier’s standard protocol. The size and
orientation of the DNA insert were confirmed by restriction
analysis (HindIII and SacI). The promoter fragment was
then excised out of the TOPO vector using enzymes KpnI
and EcoRV and ligated into the KpnI–SmaI restricted
pGL3-basic firefly luciferase reporter plasmid and trans-
formed into top 10 chemically competent cells (Invitrogen).
Following transformation, the positive clones were con-
firmed by sequencing.
Constructs bearing mutant ⁄ minor alleles for each APOH
promoter SNP were generated by PCR using the wild-type
APOH promoter ⁄ luciferase reporter construct ( 1.4 kb 5¢
region of APOH promoter inserted into the pGL3-basic
luciferase
reporter vector) as a template using the Quick-
Change II Site-directed Mutagenesis kit (Stratagene, La
Jolla, CA, USA) according to the manufacturer’s protocol.
Construction of APOH promoter deletion
mutants
A series of 5¢ deletion mutants of the 1.4 bp APOH
promoter fragment were subcloned into a new luciferase
reporter vector (pGL3-basic). For this purpose, the original
wild-type construct carrying the 1418 bp APOH promoter
fragment served as a parental template for designing PCR
primers to amplify several truncated APOH promoter frag-
ments. We designed five APOH deletion mutant constructs
differing in 200 bp between each fragment: APOH dele-
tion fragment 1 (APOH del FR #1) is the largest (858 bp)
of all five fragments. The position of this region with
respect to the translational start site is +43 to )815.
APOH deletion fragment 2 (APOH del FR #2) contains
618 bp. The location of this deletion mutant from the
translational start site is +43 to )575. APOH deletion
fragment 3 (APOH del FR #3) is the third fragment
(368 bp). The location of this fragment with respect to the
translational start site is +43 to )325. APOH deletion
fragment 4 (APOH del FR #4) is the fourth fragment. It is
further truncated to position )166 and is 209 bp.
APOH deletion fragment 5 (APOH del FR #5) is the
smallest of all five fragments (109 bp). The position of this
region with respect to the translational start site is +43 to
)65.
primer
3 software ( />primer3.cgi) was used to design PCR primers contain-
ing linker sites for the restriction enzymes KpnI and
BamHI at the 5¢ and 3¢ ends of each deleted fragment,
respectively. The PCR products were gel purified
(Qiagen, Valencia, CA, USA) and then digested with
KpnI and BamHI restriction enzymes. The digested
fragments were again gel purified. The promoterless
pGL3-basic vector (Promega Corporation, Madison,
WI, USA) was digested with KpnI and BglII, gel puri-
fied and calf intestinal alkaline phosphatase treated
in order to prevent self-ligation of the empty vector.
The APOH–PCR DNA was then ligated to the gel-
purified and calf intestinal alkaline phosphatase-treated
pGL3-basic vector by T4 DNA ligase to generate
the fusion vector construct carrying the APOH
upstream truncated sequence fused to the inframe
luciferase reporter gene. The ligated product was
then transformed into competent Escherichia coli, fol-
lowed by screening of recombinant plasmids using a
colony PCR technique. The positive clones were
Functional characterization of APOH promoter S. Suresh et al.
960 FEBS Journal 277 (2010) 951–963 ª 2010 The Authors Journal compilation ª 2010 FEBS
further confirmed by restriction digestion and DNA
sequencing.
Cell culture, transient transfection and dual
luciferase reporter gene assay
Dual luciferase reporter gene assays (Promega) were
performed to measure the in vitro promoter activity
between wild-type and mutant constructs carrying a minor
allele at individual SNP sites for each of the APOH pro-
moter SNPs. The wild-type and mutant APOH promoter
constructs, together with the Renilla luciferase control vec-
tor (pRL-TK) (Promega), were used to transiently cotrans-
fect COS-1 cells (African green monkey kidney) from the
American Type Culture Collection (ATCC CRL-1650,
Rockville, MD, USA) and HepG2 cells (human hepatocel-
lular liver carcinoma; ATCC HB-8065). COS-1 cells were
cultured at 37 °C under 5% CO
2
in Dulbecco’s modified
Eagle’s medium (Gibco, Invitrogen) supplemented with
10% fetal bovine serum, 2 mm glutamine, 100 IUÆmL
)1
penicillin and 100 lgÆmL
)1
streptomycin. HepG2 cells were
grown in Eagle’s minimal essential medium (ATCC) sup-
plemented with 10% fetal bovine serum and penicil-
lin ⁄ streptomycin. One day before transfection, 1.6 · 10
5
cells were seeded in each well of a 12-well plate with 1 mL
antibiotic-free Dulbecco’s modified Eagle’s medium ⁄ Eagle’s
minimal essential medium. Transfection was performed by
Lipofectamine 2000 reagent (Invitrogen) as per the manu-
facturer’s instructions. After 48 h, the cells were lysed and
assayed for light output using the dual luciferase reporter
system (Promega). Firefly and Renilla luciferase were mea-
sured with either a TD-20 ⁄ 20 luminometer (Turner
Design, Sunnyvale, CA, USA) or the Tecan Infinite 200
plate reader (Tecan Group Ltd., Ma
¨
nnedorf, Switzerland)
according to the manufacturers’ instructions. The lucifer-
ase data (firefly ⁄ renilla) were normalized to the average
activity of the promoterless empty vector to yield data
reflecting the fold activity increase over baseline levels for
each APOH promoter construct. Triplicate wells for each
transfection condition were assayed (intra-experiment vari-
ation) and three independent transfections were carried
out (inter-experiment variation).
EMSA
EMSA was performed for the APOH promoter SNPs to
analyze the binding of nuclear proteins from HepG2
nuclear extracts. To make double-stranded probes and com-
petitors, equal amounts of complementary oligonucleotides
(Sigma-Genosys, The Woodlands, TX, USA; Operon Bio-
technologies, Huntsville, AL, USA) corresponding to the
wild-type or mutant alleles for each APOH SNP were
heated at 95 °C for 5 min and then annealed for 1 h at
room temperature. The wild-type oligonucleotide was 5¢
end-labeled with [
32
P]ATP[cP] using T4 polynucleotide
kinase (New England Biolabs, Ipswich, MA, USA) and puri-
fied using the QIAquick purification kit (Qiagen). To allow
DNA–protein binding, the mixture of unlabeled and labeled
oligonucleotides were incubated with 1 lL (5.68 lg) human
HepG2 cell nuclear extracts for 20 min at room temperature
in gel shift binding buffer (1 mm MgCl
2
, 0.5 mm EDTA,
0.5 mm dithiothreitol, 50 mm NaCl, 10 mm Tris ⁄ HCl pH
7.5, 20% glycerol). For the competition experiments, unla-
beled competitor DNA was added in 1, 5, 20, 50 and 100·
excess volumes of the labeled probe and incubated with the
HepG2 nuclear extract (Active Motif, Carlsbad, CA, USA)
for 10 min before the addition of the labeled probe. The
DNA–protein complexes were then separated on a 5% poly-
acrylamide gel at 120 V for 2 h. The gels were dried and
exposed overnight for autoradiography on X-ray films. To
set up the EMSA experimental procedures, an earlier pub-
lished positive shift assay for the APOH promoter SNP
)32C>A was reproduced and used as a positive control.
Subjects
For genetic association of APOH promoter SNPs with
plasma b
2
GPI levels, we genotyped 345 White women with
SLE from the Pittsburgh Lupus Registry and 454 healthy
control White women from the Central Blood Bank of
Pittsburgh by Pyrosequencing. Details regarding the pheno-
typic characteristics of this lupus case–control cohort,
together with genetic screening, have been published else-
where [17]. Plasma b
2
GPI levels were determined using the
modified capture ELISA method, as described previously
[12]. Data for plasma b
2
GPI levels were only available for
a subgroup of White SLE cases (n = 241) and controls
(n = 206). This study was approved by the University of
Pittsburgh Institutional Review Board and all participants
provided written informed consent.
Statistical analysis
All computations were performed using the r statistical
software package (version 2.3.1, ).
The haplotype analysis was performed using haploview
programs to check for individual haplotype associations
with plasma b
2
GPI levels. Age, body mass index, ever
smoking and case–control status were used as covariates.
A P-value < 0.05 was considered as suggestive evidence
of association. Student’s t-test was used to determine the
significance of reporter gene expression difference between
the wild-type and mutant constructs.
Acknowledgement
This study was supported by the National Heart, Lung
and Blood Institute grant HL 54900.
S. Suresh et al. Functional characterization of APOH promoter
FEBS Journal 277 (2010) 951–963 ª 2010 The Authors Journal compilation ª 2010 FEBS 961
References
1 Galli M, Comfurius P, Maassen C, Hemker HC, de
Baets MH, van Breda-Vriesman PJ, Barbui T, Zwaal
RF & Bevers EM (1990) Anticardiolipin antibodies
(ACA) directed not to cardiolipin but to a plasma
protein cofactor. Lancet 335, 1544–1547.
2 McNeil HP, Simpson RJ, Chesterman CN & Krilis SA
(1990) Anti-phospholipid antibodies are directed against
a complex antigen that includes a lipid-binding inhibitor
of coagulation: beta 2-glycoprotein I (apolipoprotein
H). Proc Natl Acad Sci USA 87, 4120–4124.
3 Okkels H, Rasmussen TE, Sanghera DK, Kamboh MI
& Kristensen T (1999) Structure of the human beta2-
glycoprotein I (apolipoprotein H) gene. Eur J Biochem
259, 435–440.
4 Sheng Y, Sali A, Herzog H, Lahnstein J & Krilis SA
(1996) Site-directed mutagenesis of recombinant human
beta 2-glycoprotein I identifies a cluster of lysine
residues that are critical for phospholipid binding and
anti-cardiolipin antibody activity. J Immunol 157, 3744–
3751.
5 Sanghera DK, Wagenknecht DR, McIntyre JA &
Kamboh MI (1997) Identification of structural
mutations in the fifth domain of apolipoprotein H (beta
2-glycoprotein I) which affect phospholipid binding.
Hum Mol Genet 6, 311–316.
6 Mehdi H, Naqvi A & Kamboh MI (2000) A hydropho-
bic sequence at position 313-316 (Leu-Ala-Phe-Trp) in
the fifth domain of apolipoprotein H (beta2-glycopro-
tein I) is crucial for cardiolipin binding. Eur J Biochem
267, 1770–1776.
7 Wang HH & Chiang AN (2004) Cloning and character-
ization of the human beta2-glycoprotein I (beta2-GPI)
gene promoter: roles of the atypical TATA box and
hepatic nuclear factor-1alpha in regulating beta2-GPI
promoter activity. Biochem J 380, 455–463.
8 Averna M, Paravizzini G, Marino G, Lanteri E, Cavera
G, Barbagallo CM, Petralia S, Cavallaro S, Magro G,
Grasso S et al. (1997) Liver is not the unique site of
synthesis of beta 2-glycoprotein I (apolipoprotein H):
evidence for an intestinal localization. Int J Clin Lab
Res 27, 207–212.
9 Polz E & Kostner GM (1979) The binding of beta
2-glycoprotein-I to human serum lipoproteins:
distribution among density fractions. FEBS Lett 102,
183–186.
10 Gambino R, Ruiu G, Pagano G & Cassader M (1999)
The binding of apolipoprotein H (beta2-glycoprotein I)
to lipoproteins. Prostaglandins Other Lipid Mediat 57,
351–359.
11 Ag
˘
ar C, de Groot PG, Levels JH, Marquart JA &
Meijers JC (2009) Beta2-glycoprotein I is incorrectly
named apolipoprotein H. J Thromb Haemost 7, 235–
236.
12 Kamboh MI, Manzi S, Mehdi H, Fitzgerald S,
Sanghera DK, Kuller LH & Atson CE (1999) Genetic
variation in apolipoprotein H (beta2-glycoprotein I)
affects the occurrence of antiphospholipid antibodies
and apolipoprotein H concentrations in systemic lupus
erythematosus. Lupus 8, 742–750.
13 Rahgozar S, Giannakopoulos B, Yan X, Wei J, Cheng
Qi J, Gemmell R & Krilis SA (2008) Beta2-glycoprotein
I protects thrombin from inhibition by heparin cofactor
II: potentiation of this effect in the presence of anti-
beta2-glycoprotein I autoantibodies. Arthritis Rheum 58,
1146–1155.
14 Mehdi H, Aston CE, Sanghera DK, Hamman RF &
Kamboh MI (1999) Genetic variation in the apolipo-
protein H (beta2-glycoprotein I) gene affects plasma
apolipoprotein H concentrations. Hum Genet 105,
63–71.
15 Mehdi H, Manzi S, Desai P, Chen Q, Nestlerode C,
Bontempo F, Strom SC, Zarnegar R & Kamboh MI
(2003) A functional polymorphism at the transcriptional
initiation site in beta2-glycoprotein I (apolipoprotein H)
associated with reduced gene expression and lower
plasma levels of beta2-glycoprotein I. Eur J Biochem
270, 230–238.
16 Chen Q & Kamboh MI (2006) Complete DNA
sequence variation in the apolipoprotein H (beta-
glycoprotein I) gene and identification of informative
SNPs. Ann Hum Genet 70, 1–11.
17 Suresh S, Demirci FY, Jacobs E, Kao AH, Rhew
EY, Sanghera DK, Selzer F, Sutton-Tyrrell K, McPh-
erson D, Bontempo FA et al. (2009) Apolipoprotein
H promoter polymorphisms in relation to lupus
and lupus-related phenotypes. J Rheumatol 36, 315–
322.
18 Quandt K, Frech K, Karas H, Wingender E &
Werner T (1995) MatInd and MatInspector: new fast
and versatile tools for detection of consensus matches
in nucleotide sequence data. Nucleic Acids Res 23,
4878–4884.
19 Hoogendoorn B, Coleman SL, Guy CA, Smith K,
Bowen T, Buckland PR & O’Donovan MC (2003)
Functional analysis of human promoter polymorphisms.
Hum Mol Genet 12, 2249–2254.
20 Noda C & Ichihara A (1993) Regulation of liver-specific
gene expression. Cell Struct Funct 18, 189–194.
21 Pattison S, Skalnik DG & Roman A (1997) CCAAT
displacement protein, a regulator of differentiation-
specific gene expression, binds a negative regulatory
element within the 5¢ end of the human papillo-
mavirus type 6 long control region. J Virol 71, 2013–
2022.
22 Cooper SJ, Trinklein ND, Anton ED, Nguyen L &
Myers RM (2006) Comprehensive analysis of transcrip-
tional promoter structure and function in 1% of the
human genome. Genome Res 16, 1–10.
Functional characterization of APOH promoter S. Suresh et al.
962 FEBS Journal 277 (2010) 951–963 ª 2010 The Authors Journal compilation ª 2010 FEBS
Supporting information
The following supplementary material is available:
Table S1. List of liver-specific transcription factors for
APOH promoter (matinspector).
This supplementary material can be found in the
online version of this article.
Please note: As a service to our authors and readers,
this journal provides supporting information supplied
by the authors. Such materials are peer-reviewed and
may be re-organized for online delivery, but are not
copy-edited or typeset. Technical support issues arising
from supporting information (other than missing files)
should be addressed to the authors.
S. Suresh et al. Functional characterization of APOH promoter
FEBS Journal 277 (2010) 951–963 ª 2010 The Authors Journal compilation ª 2010 FEBS 963