Báo cáo khoa học: b-Secretase cleavage is not required for generation of the intracellular C-terminal domain of the amyloid precursor family of proteins pot
Bạn đang xem bản rút gọn của tài liệu. Xem và tải ngay bản đầy đủ của tài liệu tại đây (616.28 KB, 16 trang )
b-Secretase cleavage is not required for generation of the
intracellular C-terminal domain of the amyloid precursor
family of proteins
Carlo Sala Frigerio
1
, Julia V. Fadeeva
2
, Aedı
´
n M. Minogue
1
, Martin Citron
3,
*, Fred Van Leuven
4
,
Matthias Staufenbiel
5
, Paolo Paganetti
5
, Dennis J. Selkoe
2
and Dominic M. Walsh
1
1 Laboratory for Neurodegenerative Research, The Conway Institute for Biomolecular and Biomedical Research, University College Dublin,
Republic of Ireland
2 Department of Neurology, Harvard Medical School and Center for Neurologic Diseases, Brigham and Women’s Hospital, Boston, MA, USA
3 Amgen Inc., Thousand Oaks, CA, USA
4 Department of Human Genetics, Katholieke Universiteit Leuven, Belgium
5 Nervous System Research, Novartis Institutes for Biomedical Research, Basel, Switzerland
Keywords
Alzheimer’s disease; amyloid precursor
protein (APP); amyloid precursor-like protein
1 (APLP1); amyloid precursor-like protein 2
(APLP2); b-site amyloid precursor
protein-cleaving enzyme (BACE1)
Correspondence
Dominic M. Walsh, Laboratory for
Neurodegenerative Research, The Conway
Institute for Biomolecular and Biomedical
Research, University College Dublin,
Belfield, Dublin 4, Republic of Ireland
Fax: +353 1 716 6890
Tel: +353 1 7166751
E-mail:
*Present address
Eli Lilly and Company, Indianapolis, IN
46285, USA
(Received 31 October 2009, revised
6 January 2010, accepted 12
January 2010)
doi:10.1111/j.1742-4658.2010.07579.x
The amyloid precursor family of proteins are of considerable interest, both
because of their role in Alzheimer’s disease pathogenesis and because of
their normal physiological functions. In mammals, the amyloid precursor
protein (APP) has two homologs, amyloid precursor-like protein (APLP) 1
and APLP2. All three proteins undergo ectodomain shedding and regulated
intramembrane proteolysis, and important functions have been attributed
to the full-length proteins, shed ectodomains, C-terminal fragments and
intracellular domains (ICDs). One of the proteases that is known to cleave
APP and that is essential for generation of the amyloid b-protein is the
b-site APP-cleaving enzyme 1 (BACE1). Here, we investigated the effects
of genetic manipulation of BACE1 on the processing of the APP family of
proteins. BACE1 expression regulated the levels and species of full-length
APLP1, APP and APLP2, of their shed ectodomains, and of their mem-
brane-bound C-terminal fragments. In particular, APP processing appears
to be tightly regulated, with changes in b-cleaved APPs (APPsb) being
compensated for by changes in a-cleaved APPs (APPsa). In contrast, the
total levels of soluble cleaved APLP1 and APLP2 species were less tightly
regulated, and fluctuated with BACE1 expression. Importantly, the produc-
tion of ICDs for all three proteins was not decreased by loss of BACE1
activity. These results indicate that BACE1 is involved in regulating ecto-
domain shedding, maturation and trafficking of the APP family of pro-
teins. Consequently, whereas inhibition of BACE1 is unlikely to adversely
affect potential ICD-mediated signaling, it may alter other important facets
of amyloid precursor-like protein ⁄ APP biology.
Abbreviations
Ab, amyloid b-peptide; APLP, amyloid precursor-like protein; APLP1s, soluble C-terminally truncated form of amyloid precursor-like protein 1;
APLP2s, soluble C-terminally truncated form of amyloid precursor-like protein 2; APP, amyloid precursor protein; APP
i
, immature amyloid
precursor protein; APP
m
, mature amyloid precursor protein; APPs, soluble C-terminally truncated form of amyloid precursor protein; APPsa,
soluble C-terminally truncated a-cleaved form of amyloid precursor protein; APPsb, soluble C-terminally truncated b-cleaved form of amyloid
precursor protein; BACE1, b-site amyloid precursor protein-cleaving enzyme; CTF, C-terminal fragment; FLAPLP, full-length amyloid
precursor-like protein; FLAPP, full-length amyloid precursor protein; GAPDH, glyceraldehyde-3-phosphate dehydrogenase; ICD, intracellular
domain; ICDivg, intracellular domain in vitro generation; KO, knockout; Tg, transgenic.
FEBS Journal 277 (2010) 1503–1518 ª 2010 The Authors Journal compilation ª 2010 FEBS 1503
Introduction
Genetic evidence indicates that the amyloid precursor
protein (APP) is centrally involved in Alzheimer’s dis-
ease pathogenesis [1], but it also appears to have
important physiological functions. APP belongs to an
evolutionarily conserved family of type I transmem-
brane glycoproteins [2], which includes the mammalian
homologs amyloid precursor-like protein (APLP) 1 [3]
and APLP2 [4]. These three proteins share a consider-
able degree of sequence and domain similarity [5,6].
Both APP and APLP2 are expressed in a variety of
tissues and cell types [4,7], whereas APLP1 expression
is neuron-specific [8]. The APP family of proteins is
believed to play important roles in both the peripheral
and central nervous systems [6]. In the former, they
are involved in the formation and correct functioning
of the neuromuscular junction [9], and in the latter
they have been implicated in neurite outgrowth [10],
synaptogenesis [11], and neuronal migration during
embryogenesis [12]. Knockout (KO) studies indicate a
high degree of functional redundancy between APP,
APLP1 and APLP2 [13], with only subtle defects being
observed in animals with ablation of one member [14].
In contrast, APP ⁄ APLP2 and APLP1 ⁄ APLP2 double
KO mice die soon after birth [14], and mice lacking all
three proteins die in utero [13]. Surprisingly,
APP ⁄ APLP1 double KO mice are viable and healthy,
indicating that APLP2 possesses some functions that
cannot be compensated for by APP and APLP1 [13].
There is also considerable evidence that the APP
family of proteins have a role in cell–cell and cell–
matrix adhesion, and that they can form both cis and
trans homodimers and heterodimers [15,16]. In addi-
tion, the APP family of proteins can interact with a
variety of cellular proteins that regulate APP, APLP1
and APLP2 processing. The majority of APP mole-
cules are cleaved at the cell ⁄ luminal surface by a-secre-
tase, resulting in the shedding of the ectodomain
(soluble C-terminally truncated a-cleaved form of amy-
loid precursor protein, APPsa) [17,18]. a-Secretase
cleavage is mediated by at least three enzymes, all of
which are members of the ADAM (a disintegrin and
metalloprotease) family [19]. A smaller fraction of
APP molecules are proteolysed by b-secretase in endo-
somes or at the plasma membrane [20]. The b-secretase
activity is attributed to a single protease, b-site APP-
cleaving enzyme BACE1 [21,22]. BACE1 is an aspartyl
protease and an atypical member of the pepsin family
[21], and is also referred to as memapsin-2 [23] or
Asp-2 [24]. The expression and activity of BACE1
are regulated at multiple levels [25], including
mRNA transcription, mRNA stability, glycosylation,
proteolytic maturation, palmitoylation, and cellular
localization.
Initial reports describing BACE1 KO mice failed to
reveal significant defects [22,26]; however, recent stud-
ies have demonstrated that deletion of BACE1 results
in impaired myelination [27,28] and in the development
of behavioral abnormalities reminiscent of schizophre-
nia [29,30]. Both effects have been attributed to the
loss of BACE1 cleavage of the neurotrophic factor
neuregulin-1. In addition to APP and neuregulin-1,
BACE1 has been shown to cleave type II a-2,6-sialyl-
transferase [31], P-selectin glycoprotein ligand-1 [32],
the b2-subunit of sodium channels [33] and interleu-
kin-1 receptor type II [34]. However, loss of BACE1
processing of these latter substrates has not yet been
shown to have significant adverse consequences.
Like APP, both APLP1 and APLP2 undergo ecto-
domain shedding, and their soluble ectodomains have
been detected in the conditioned media of transfected
cell lines and in human cerebrospinal fluid [35–37].
Although substantial data indicate that APLP2 is
cleaved by both a-secretase and b-secretase [38,39], the
enzymes involved in APLP1 ectodomain cleavage are
less well defined [40,41]. Irrespective of the identity of
the enzymes involved, ectodomain shedding of APP,
APLP1 and APLP2 results in the generation of mem-
brane-bound C-terminal fragments (CTFs). These
CTFs are further processed by c-secretase, releasing
intracellular domains (ICDs) [42,43] that are postu-
lated to be involved in transcriptional regulation
[44,45]. Although the transcriptional properties of
ICDs are contentious [45–48], there is consensus that
the APP family of proteins may function as membrane
anchors for a variety of proteins, and when CTFs are
cleaved, ICDs, together with associated proteins, are
released from the membrane [49].
Here we investigated the effects of genetic manipula-
tion of BACE1 on the processing of APP, APLP1 and
APLP2, and on the production of their ICDs. We
report that BACE1 KO and overexpression affect the
steady-state levels of full-length APLP (FLAPLP) 1
and FLAPLP2 similarly to the way in which they
affect the steady-state levels of APP [50]. BACE1
expression also regulates the levels and species of the
shed ectodomains and membrane-bound CTFs. In par-
ticular, APP processing appears to be tightly regulated,
with the total levels of soluble APP remaining constant
irrespective of the presence or absence of BACE1. The
levels of APPsa increased to account for the loss of
APPsb (soluble C-terminally truncated b-cleaved form
of amyloid precursor protein) in BACE1 KO mice,
b-Secretase processing of APLP1 and APLP2 C. S. Frigerio et al.
1504 FEBS Journal 277 (2010) 1503–1518 ª 2010 The Authors Journal compilation ª 2010 FEBS
and decreased when APPsb levels increased because of
BACE1 overexpression. In contrast, the total levels of
soluble cleaved APLP1 and APLP2 species fluctuated
with BACE1 expression. Importantly, we show that
the production of ICDs for all three proteins is not
decreased by a loss of BACE1 activity, indicating that
BACE1 inhibition would not adversely affect ICD pro-
duction.
Results
BACE1 regulates APP, APLP1 and APLP2
ectodomain shedding and secretion of FLAPLP1
Using murine models of BACE1 overexpression
[BACE1 transgenic (Tg)] and deletion (BACE1 KO),
we set out to investigate the role of BACE1 in the pro-
cessing of APLP1 and APLP2. To do this, we
employed an extraction procedure capable of separat-
ing water-soluble and membrane-associated proteins.
First, water-soluble parenchymal and cytosolic proteins
were extracted in NaCl ⁄ Tris, the membrane pellet was
washed with sodium carbonate, and proteins were
extracted using NaCl ⁄ Tris containing 1% Triton
X-100 (NaCl ⁄ Tris-T). Secreted proteins were detected
using ectodomain-specific antibodies, and full-length
proteins and CTFs were detected using antibodies that
specifically recognize the C-termini of the different
proteins. The specificity of antibodies for their cognate
target proteins was confirmed using brains from APP,
APLP1 and APLP2 KO mice (Fig. S1).
In NaCl ⁄ Tris extracts of mouse brains, 22C11,
a monoclonal antibody recognizing an epitope between
amino acids 66 and 81 of APP (Fig. S1), specifically
detected a single band at around 100 kDa in wild-type
(WT), BACE1 KO and BACE1 Tg samples that
roughly comigrated with a strong band detected in
lysates of human APP
695
-expressing cells and that was
absent in the APP KO sample (Fig. 1A). When the
same samples were western blotted with C8, an anti-
body specifically recognizing an epitope at the extreme
C-terminus of APP (Fig. S1), a 100 kDa band was
detected only in the lysate of APP
695
-expressing cells
(Fig. 1E). The fact that the 100 kDa band detected
in the NaCl ⁄ Tris mouse brain extracts was revealed by
the ectodomain-directed antibody 22C11 but not by
the C-terminal specific antibody C8 indicates that this
protein lacks an intact C-terminus and probably repre-
sents secreted forms of APP (APPs). The levels of total
APPs species were not significantly altered by either
A
C
B
D
BACE1 KO WT BACE1 Tg
0
25
50
75
100
125
150
175
BACE1 KO WT BACE1 Tg
APPs total (% of control)
0
25
50
75
100
125
148
98
64
+ – KO WT Tg – +
22C11
148
98
64
Aβ rodent
+ – KO WT Tg – +
E
148
98
64
C8
+ – KO WT Tg – +
F
36
anti-GAPDH
+ – KO WT Tg – +
APPsα total (% of control)
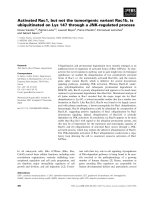
Fig. 1. Levels of total APPs are unaffected
by changes in BACE1 expression, whereas
APPsa levels are dependent on BACE1
activity. NaCl ⁄ Tris homogenates of brains
from WT, BACE1 KO and BACE1 Tg mice
were electrophoresed on 10% Tris ⁄ glycine
polyacrylamide gels and western blotted
with a panel of antibodies that allow detec-
tion of total APPs [22C11 (A)], APPsa [anti-
Ab rodent (C)] and full-length and C-terminal
fragments of APP [C8 (E)]. Western blotting
for GAPDH was included to check for equal
protein loading (F). Lysates of a cell line
overexpressing human WT APP
695
(+) were
included as a positive control, and NaCl ⁄ Tris
homogenates of brains from APP KO mice
()) were included as a negative control. The
levels of total APPs and of APPsa [(B) and
(D), respectively] were quantitated by densi-
tometry, and values normalized versus WT
control are presented as averages
± standard errors of duplicate measure-
ments of three animals of each genotype.
C. S. Frigerio et al. b-Secretase processing of APLP1 and APLP2
FEBS Journal 277 (2010) 1503–1518 ª 2010 The Authors Journal compilation ª 2010 FEBS 1505
KO or overexpression of BACE1 (Fig. 1A,B). When
the same samples were western blotted using a
polyclonal antibody capable of detecting APPsa, but
not APPsb (Fig. S1), a single band of 100 kDa was
detected in WT, BACE1 KO and BACE1 Tg mice, but
was absent in both the APP KO mice and in the cell
lysate sample (Fig. 1C). The lack of detection of full-
length APP (FLAPP) in APP
695
-expressing cells is due
to the fact that the epitope for the antibody against
rodent Ab is not present in human APP (Table 1),
whereas the absence of this band in the APP KO
extract confirms the specificity of this band as a true
APPs species (Fig. 1C). The levels of this APPsa band
were dramatically increased in BACE1 KO mice
(+57.4% ± 3.1%, P < 0.0001) and decreased in
BACE1 Tg mice ()58.9% ± 1.6%, P < 0.0001)
(Fig. 1C,D). Given that the total amounts of protein
loaded for the different extracts were very similar
(Fig. 1F), and that total APPs levels were unchanged
(Fig. 1A,B), these results imply a tight regulation of
APP ectodomain shedding, with overexpression of
BACE1 causing a compensatory decrease in APPsa
levels, and BACE1 ablation causing a compensatory
increase in APPsa levels. These changes are unlikely to
have resulted from a difference in genetic background,
as a nearly identical pattern was seen when other
BACE1 KO and BACE1 Tg mouse lines were exam-
ined (Fig. S3).
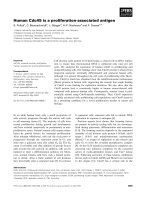
Western blot analysis of NaCl ⁄ Tris homogenates
using W1NT, an antibody directed against the
N-terminal domain of APLP1 (Fig. S1), revealed two
specific bands in BACE1 KO, WT and BACE1 Tg
samples that were not present in the APLP1 KO sam-
ple (Fig. 2A). The band migrating at 94 kDa was
present only in the BACE1 KO samples, and migrated
just below the band from lysates of cells overexpress-
ing human APLP1
650
; an additional band, which
migrated at 83 kDa, was also present in WT and
BACE1 KO samples (Fig. 2A). Moreover, when the
same samples were analyzed by western blotting with
W1CT, a polyclonal antibody raised against the
extreme C-terminus of APLP1 (Fig. S1), or a commer-
cial antibody against the C-terminus of APLP1,
171615 (Calbiochem, EMD Biosciences, Merck KGaA,
Darmstadt, Germany) (not shown), a band migrating
at 94 kDa was detected in all BACE1 KO, WT and
BACE1 Tg samples, but not in APLP1 KO samples
(Fig. 1C). As the band migrating at 94 kDa was rec-
ognized by antibodies directed to both the ectodomain
and the C-terminus, this band appears to be FLAP-
LP1. In contrast, the band migrating at 83 kDa,
which was recognized by W1NT and not by W1CT, is
likely to be a soluble C-terminally truncated form of
APLP1 (APLP1s). It is unusual for a transmembrane
protein to be found in a detergent-free aqueous envi-
ronment. One possible explanation for this behavior
may be that FLAPLP1 is present in membrane frac-
tions, such as exosomes or microvesicles, that are not
readily sedimented by centrifugation. Whatever the
reason, the levels of APLP1s were dramatically
reduced in BACE1 KO samples ()47.1% ± 5.4%,
P < 0.0001) and slightly increased by BACE1
overexpression (+11.4% ± 4.1%, nonsignificant)
(Fig. 2A,B). As W1NT cannot discriminate between
APLP1s produced by a-secretase and that produced by
b-secretase, we can only assess the effects on total
APLP1s production. Accordingly, BACE1 seems to be
required for the production of at least half of the total
amount of APLP1s, as its deletion caused a 50%
decrease in APLP1s level (Fig. 2A). Given that over-
expression of BACE1 did not lead to a significant
increase in the levels of APLP1s (Fig. 2A,B), it would
appear that APLP1s production is tightly regulated by
factors other than BACE1 expression. A feature of
APLP1, which is unique among the members of the
APP family, is its secretion as unprocessed full-length
protein (compare Figs 1E, 2C and 3C). Moreover, this
property appears to be modulated by BACE1, as dele-
tion of BACE1 caused a large increase in the levels of
FLAPLP1 released (+251% ± 4.7%, P < 0.0001),
Table 1. Antibodies recognizing the APP family of proteins. Details about the specific target protein, epitope recognized, host, species
specificities and source are provided for each antibody used. The amino acid numbering is for human sequences of APP
695
, APLP1
650
and APLP2
751
. For antibody against rodent Ab, numbering is for the Ab sequence. H, human; M, mouse.
Antibody Target Antigen, amino acid numbering Host Species reactivity Source
22C11 APP 66–81 Mouse H, M Chemicon
Antibody against rodent Ab APP 3–16 Ab Rabbit M Signet
C8 APP 676–695 Rabbit H, M Selkoe laboratory
W1NT APLP1 75–90 Rabbit H, M Walsh laboratory
W1CT APLP1 640–650 Rabbit H, M Walsh laboratory
D2-II APLP2 Full-length Rabbit H, M Calbiochem
W2CT APLP2 740–751 Rabbit H, M Walsh laboratory
b-Secretase processing of APLP1 and APLP2 C. S. Frigerio et al.
1506 FEBS Journal 277 (2010) 1503–1518 ª 2010 The Authors Journal compilation ª 2010 FEBS
whereas BACE1 overexpression resulted in a sizeable
reduction in FLAPLP1 release ()45.6% ± 2.8%,
P < 0.0001) (Fig. 2C,D). Thus expression of BACE1
regulates the release of FLAPLP1 and strongly influ-
ences the production of APLP1s. As with APP, these
results are independent of genetic background, and
have been replicated in other BACE1 KO and Tg
mouse lines (Fig. S4).
BACE1 KO WT BACE1 Tg
APLP1 FL (% of wild type)
0
50
100
150
200
250
300
350
400
anti-GAPDH
36
+ – KO WT Tg – +
148
98
64
+ – KO WT Tg – +
W1CT
+ – KO WT Tg – +
148
98
64
W1NT
FL APLP1
APLP1s
BACE1 KO WT BACE1 Tg
APLP1s (% of wild type)
0
25
50
75
100
125
A
C
D
B
E
Fig. 2. BACE1 deletion decreases the levels of APLP1s and increases the levels of FLAPLP1. NaCl ⁄ Tris homogenates of brains from WT,
BACE1 KO and BACE1 Tg mice were electrophoresed on 10% Tris ⁄ glycine polyacrylamide gels and western blotted with antibodies recog-
nizing the N-terminus [W1NT (A)] and C-terminus [W1CT (C)] of APLP1. Western blotting for GAPDH was included to check for equal protein
loading (E). Lysates of a cell line overexpressing human APLP1
650
(+) are included as a positive control, and NaCl ⁄ Tris homogenates of
brains from APLP1 KO mice (–) are included as a negative control. FLAPLP1 and APLP1s bands detected by W1NT are indicated by arrows
in (A). The levels of APLP1s and FLAPLP1 [(B) and (D), respectively] were quantitated by densitometry, and values normalized relative to WT
control are presented as averages ± standard errors of duplicate measurements of three animals of each genotype.
A
D
36
anti-GAPDH
+ – KO WT Tg – +
C
148
98
64
+ – KO WT Tg – +
W2CT
B
148
98
64
+ – KO WT Tg – +
D2-II
105 kDa
94 kDa
BACE1 KO WT BACE1 Tg
APLP2s (% of wild type)
0
25
50
75
100
125
150
105 kDa band
94 kDa band
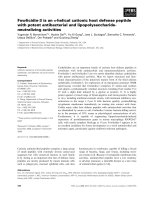
Fig. 3. BACE1 deletion decreases APLP2s levels, whereas BACE1 overexpression increases APLP2s levels. NaCl ⁄ Tris homogenates of
brains from WT, BACE1 KO and BACE1 Tg mice were electrophoresed on 10% Tris ⁄ glycine polyacrylamide gels and western blotted with
antibodies recognizing either FLAPLP2 [D2-II (A)] or the extreme C-terminus of APLP2 [W2CT (C)]. Western blotting for GAPDH was
included to check for equal protein loading (D). Lysates of cell lines overexpressing human WT APLP2
751
(+) are included as a positive con-
trol, and NaCl ⁄ Tris homogenates of brains from APLP2 KO mice ()) are included as a negative control. APLP2s bands [indicated by arrows
(A)] were quantitated by densitometry, and values normalized versus the WT control are presented as averages ± standard errors of dupli-
cate measurements of three animals of each genotype (B).
C. S. Frigerio et al. b-Secretase processing of APLP1 and APLP2
FEBS Journal 277 (2010) 1503–1518 ª 2010 The Authors Journal compilation ª 2010 FEBS 1507
Western blot analysis of NaCl ⁄ Tris homogenates
using D2-II, an antibody raised against FLAPLP2
(Fig. S1), identified two bands migrating at 105 and
94 kDa in the WT, BACE1 KO and BACE1 Tg sam-
ples, but not in APLP2 KO samples (Fig. 3A). Both
bands migrated considerably faster than the band
detected in the lysate of human APLP2
751
-expressing
cells, which migrated at 111 kDa (Fig. 3A). Western
blot analysis with W2CT detected the 111 kDa band
in the lysates of APLP2
751
-expressing cells, but did not
detect any specific bands in NaCl ⁄ Tris extracts of mouse
brain (Fig. 3C). Together, these data indicate that the
94 and 105 kDa bands detected by D2-II but not
by W2CT probably represent soluble APLP2 (APLP2s).
BACE1 deletion caused decreases in the levels of
both APLP2s species (105 kDa, )21.2% ± 4.8%,
P < 0.0001; 94 kDa, )29.8% ± 7.1%, P < 0.0001),
whereas BACE1 overexpression caused increases
(105 kDa, +19.7% ± 2.3%, P < 0.0005; 94 kDa,
+22.8% ± 4.3%, P < 0.005) (Fig. 3A,B). As with
APP and APLP1, these results were independent of
genetic background (Fig. S5), and indicate that BACE1
is responsible for the generation of at least 20% of
APLP2s.
BACE1 manipulation alters the quantity and form
of APP, APLP1 and APLP2 CTFs
To examine the effects of BACE1 expression on full-
length proteins and CTFs, membrane fractions of
mouse brains were analyzed using C-terminus-specific
antibodies. Analysis using the APP-specific C8 anti-
body revealed the presence of two high molecular mass
bands in WT, BACE1 KO and BACE1 Tg mice, but
not in APP KO samples (Fig. 4A). These two bands,
which comigrated with similar bands detected in the
lysate of APP
695
-expressing cells, most probably repre-
sent mature (APP
m
: 96 kDa) and immature (APP
i
:
91 kDa) forms of APP (Fig. 4A) [51,52]. The levels
of both forms were significantly increased by BACE1
deletion (APP
m
, +48.4% ± 3.1%, P < 0.0001; APP
i
,
+35.4% ± 3.3%, P < 0.0001) and significantly
decreased by BACE1 overexpression (APP
m
, )45.5%
± 1.4%, P < 0.0001; APP
i
, )26.7% ± 1.0%,
P <0.0001) (Fig. 4B). These differences did not result
from changes in the expression of APP, as APP
mRNA levels were unchanged in brains of genetically
modified animals (Fig. S6A). Although effects on both
forms of FLAPP followed the same trend, the ratio of
96 to 91 kDa FLAPP was increased in BACE1
KO samples (1.31 ± 0.05 versus 1.19 ± 0.02,
P < 0.01) and decreased in BACE1 Tg samples
(0.89 ± 0.02 versus 1.19 ± 0.02, P < 0.0001). These
results imply that BACE1 expression influences the lev-
els of FLAPP by a mechanism independent of direct
proteolysis.
Analysis with C8 also revealed a series of low molec-
ular mass species of sizes consistent with CTFs
(Fig. 4C). Two CTFs of approximately 13.3 and
12.5 kDa were detected in WT and BACE1 KO sam-
A
105
78
55
+ – KO WT Tg – +
94 kDa
89 kDa
BACE1 KO WT BACE1 T
g
APP CTFs (% of wild type)
0
50
100
150
200
250
14.3 kDa band
13.3 kDa band
12.5 kDa band
D
C
17
16
7
+ – KO WT Tg – +
14.3 kDa
12.5 kDa
13.3 kDa
*
BACE1 KO WT BACE1 T
g
FL APP (% of wild type)
0
25
50
75
100
125
150
175
94 kDa band
89 kDa band
B
Fig. 4. BACE1 expression decreases FLAPP steady-state levels and gives rise to a 14.3 kDa APP CTF. NaCl ⁄ Tris-T homogenates of WT,
BACE1 KO and BACE1 Tg mouse brains were electrophoresed on 10–20% Tris ⁄ Tricine polyacrylamide gels and western blotted with spe-
cific antibody against the APP C-terminus [C8, (A, C)]. Lysates of a cell line overexpressing human WT APP
695
(+) are included as a positive
control, and NaCl ⁄ Tris-T homogenates of brains from APP KO mice ()) are included as a negative control. The asterisk in (C) indicates a spe-
cific band detected in certain WT and Tg samples. Full-length and CTF bands [indicated by arrows in (A) and (C), respectively] were quanti-
fied by densitometry and normalized versus the WT control (B, D). Results are presented as averages ± standard errors of duplicate
measurements of three animals for each condition.
b-Secretase processing of APLP1 and APLP2 C. S. Frigerio et al.
1508 FEBS Journal 277 (2010) 1503–1518 ª 2010 The Authors Journal compilation ª 2010 FEBS
ples (Fig. 4C), and the levels of both were increased in
the latter (13.3 kDa, +45.0% ± 9.3%, P < 0.0001;
12.5 kDa, +50.0% ± 8.7%, P < 0.0001). In contrast,
the levels of both the 13.3 and 12.5 kDa bands
were slightly decreased in BACE1 Tg samples
(13.3 kDa, )12.2% ± 2.2%, nonsignificant; 12.5 kDa,
)19.1% ± 2.3%, P < 0.05), and a third CTF band
migrating at around 14.3 kDa was detected (Fig. 4C).
A faint 14.3 kDa band was also detected in WT
samples (BACE1 Tg +77.3% ± 16.9% versus wild
type, P < 0.0001) but was not present in BACE1 KO
samples. These results indicated that the 14.3 kDa
band is a BACE1 cleavage product (Fig. 4D). An
additional faint band migrating at 15.4 kDa (indi-
cated by an asterisk in Fig. 4C) was occasionally
detected in WT and BACE1 Tg mice only. In other
experiments using different lines of BACE1 KO and
BACE1 Tg mice, the changes in FLAPP and APP
CTFs were very similar to those reported above
(Fig. S3). In all of the mouse lines studied, the total
amounts of CTFs were not altered by BACE1 expres-
sion, a finding in keeping with the fact that the levels
of total APPs is not altered by BACE1 expression, and
which suggests that the change in FLAPP is not the
result of a net change in APP processing or APP
expression (Fig. S6) but is mediated by a BACE1-
regulated change in turnover or trafficking.
Western blot analysis of NaCl ⁄ Tris-T homogenates
with antibody W1CT revealed two discrete bands,
migrating at 88 and 80 kDa in WT, BACE1 KO
and BACE1 Tg mice, that were absent in APLP1 KO
samples (Fig. 5A). As revealed by N-glycosidase F
treatment, the slower-migrating specific band is N-gly-
cosylated APLP1 (Fig. S7); therefore, by analogy with
FLAPP (Fig. 4A), these two bands may represent
mature and immature APLP1 (Fig. 5A) [37]. Following
the trend seen for APP (Fig. 4B), the slower-migra-
ting FLAPLP1 band was dramatically increased
(+92.2% ± 4.6%, P < 0.0001) in the BACE1 KO
samples and decreased in the BACE1 Tg samples
()19.2% ± 2.4%, P < 0.0005) (Fig. 5B). On the
other hand, the 80 kDa APLP1 band was decreased
in the BACE1 KO samples ()65.2% ± 3.0%,
P < 0.0001) and unchanged in the BACE1 Tg samples
()0.5% ± 7.0%, nonsignificant) (Fig. 5B). As was the
case for FLAPP, the differences seen in the levels of
FLAPLP1 are not due to a difference in the levels of
APLP1 mRNA (Fig. S6B). Importantly, the ratio
of mature to immature FLAPLP1 was drastically
shifted towards the mature form in BACE1 KO sam-
ples (15.28 ± 1.04 versus 2.78 ± 0.29, P < 0.0001)
and was unchanged in the BACE1 Tg samples
(2.31 ± 0.33 versus 2.78 ± 0.29), suggesting that
BACE1 may regulate the maturation of APLP1. For
WT, BACE1 KO and BACE1 Tg samples, a single
CTF band was detected, the size of which varied with
BACE1 expression (Fig. 5C). In BACE1-deficient mice,
this band migrated at 8.2 kDa, whereas in samples
from WT and BACE1 Tg mice, it migrated at 7.8
kDa. These data indicate that deletion of BACE1
C
+ – KO WT Tg – +
8.2
7.8
5.9
17
16
7
A
105
78
55
+ – KO WT Tg – +
88
80
BACE1 KO WT BACE1 T
g
APLP1 CTFs (% of wild type)
0
50
100
150
200
8.2 kDa – 7.8 kDa bands
5.9 kDa band
D
BACE1 KO WT BACE1 Tg
FL APLP1 (% of wild type)
0
50
100
150
200
250
88 kDa band
80 kDa band
B
Fig. 5. BACE1 expression decreases FLAPLP1 levels and gives rise to a 7.5 kDa APLP1 CTF. NaCl ⁄ Tris-T homogenates of WT, BACE1 KO
and BACE1 Tg mouse brains were electrophoresed on 10–20% Tris ⁄ Tricine polyacrylamide gels and western blotted with specific antibody
against the APLP1 C-terminus [W1CT (A, C)]. Lysates of a cell line overexpressing human WT APLP1
650
(+) are included as a positive control,
and NaCl ⁄ Tris-T homogenates of brains from APLP1 KO mice ()) are included as a negative control. The full-length and CTF species identified
[indicated by arrows in (A) and (C), respectively] were quantified by densitometry and normalized versus the WT control, and results are
presented as averages ± standard errors of duplicate measurements of three animals for each condition [(B) FLAPLP1; (D) APLP1 CTF].
C. S. Frigerio et al. b-Secretase processing of APLP1 and APLP2
FEBS Journal 277 (2010) 1503–1518 ª 2010 The Authors Journal compilation ª 2010 FEBS 1509
precludes the production of normal APLP1 CTF, lead-
ing to the production of a slightly longer CTF
(Fig. 5C). The effective differences in the molecular
masses of APLP1 CTFs from BACE1 KO mice and
from WT and BACE1 Tg mice were confirmed by
using a 12-cm-long 16% polyacrylamide Tris ⁄ Tricine
gel, and, in these gels, two tightly migrating bands were
detected (not shown). This suggests that two distinct
APLP1s forms can be produced, although the relative
molecular weights would be too close to be effectively
separated on a 10% Tris ⁄ glycine gel (Fig. 2A). Thus it
would appear that BACE1 is the principal sheddase for
APLP1, and that only when BACE1 activity is deleted
can APLP1 be cleaved by another activity. It is also
of note that the amount of APLP1 CTF in BACE1
KO samples tended to be greater than in the wild
type (+35.1% ± 6.4%, P < 0.0005), whereas APLP1
CTF was slightly decreased in BACE1 Tg samples
()17.9% ± 12.0%, nonsignificant) (Fig. 5D). A second
very faint CTF band migrating around 5.9 kDa was
seen in all samples, and its levels were slightly ele-
vated in BACE1 KO samples (+59.0% ± 23.7%,
P < 0.005) and slightly lower in BACE1 Tg samples
()23.6% ± 10.3%, nonsignificant) (Fig. 5D). How-
ever, whether this band represents an authentic CTF or
a membrane-associated ICD is unclear (see below for
more details). As with APP, the effects of BACE1
expression were replicated in a distinct set of mouse
lines (Fig. S4).
Analysis of NaCl ⁄ Tris-T samples with W2CT
(Fig. 6A,C) revealed a broad 92 kDa band (which,
on occasion, appeared as a doublet) in WT, BACE1
KO and BACE1 Tg samples (Fig. 6A). The difference
in molecular mass observed for FLAPLP2 from mouse
brains and from transfected CHO cells probably
reflects the presence of different APLP2 isoforms
and ⁄ or differences in post-translational modifications.
The levels of the 92 kDa FLAPLP2 were increased
in BACE1 KO samples (+39.4% ± 2.3%,
P < 0.0001) and decreased in BACE1 Tg samples
()27.4% ± 0.9%, P < 0.0001) (Fig. 6B). As was the
case also for FLAPP and FLAPLP1, differences in
FLAPLP2 are not the result of differential expression
of APLP2 mRNA (Fig. S6C).
APLP2 processing generates at least four CTFs: three
higher molecular mass bands migrating close together
at 14.8 kDa, 13.4 and 12.6 kDa, respectively,
and a fourth lower molecular mass band migrating at
9.6 kDa (Fig. 6C). Because of the close migration of
APLP2 CTFs, quantitative densitometric analysis of
each species was not possible. However, the 14.8 and
9.6 kDa bands were quantified separately, and the
13.4 and 12.6 kDa bands were considered
together. The 14.8 kDa APLP2 CTF is probably the
product of BACE1 cleavage, as this band was absent in
BACE1 KO samples and was increased in BACE1 Tg
samples (+80.3% ± 11.6%, P < 0.0001) (Fig. 6D).
The 9.6 kDa APLP2 CTF was found in all samples,
A
105
78
55
+ – KO WT Tg – +
C
17
16
7
+ – KO WT Tg – +
14.8
13.4
12.6
9.6
BACE1 KO WT BACE1 Tg
FL APLP2 (% of wild type)
0
20
40
60
80
100
120
140
160
B
BACE1 KO WT BACE1 Tg
APLP2 CTFs (% of wild type)
0
50
100
150
200
250
14.8 kDa band
13.4 & 12.6 kDa bands
9.6 kDa band
D
Fig. 6. BACE1 expression decreases FLAPLP2 protein levels and gives rise to a 14.8 kDa APLP2 CTF. NaCl ⁄ Tris-T homogenates of WT,
BACE1 KO and BACE1 Tg mouse brains were electrophoresed on 10–20% Tris ⁄ Tricine polyacrylamide gels and western blotted with spe-
cific antibody against the APLP2 C-terminus [W2CT (A, C)]. Lysates of a cell line overexpressing human WT APLP2
751
(+) are included as a
positive control, and NaCl ⁄ Tris-T homogenates of hemibrains of APLP2 KO mice ()) are included as a negative control. The full-length and
CTF species identified [indicated by arrows in (A) and (C), respectively] were quantified by densitometry and normalized versus the WT con-
trol. Results are presented as averages ± standard errors of duplicate measurements of three animals for each condition [(B) FLAPLP2; (D)
APLP2 CTF].
b-Secretase processing of APLP1 and APLP2 C. S. Frigerio et al.
1510 FEBS Journal 277 (2010) 1503–1518 ª 2010 The Authors Journal compilation ª 2010 FEBS
being increased by an average of 84.3% ± 17.6%
(P < 0.0001) in BACE1 KO samples and unchanged in
BACE1 Tg samples (Fig. 6D). The 13.4 and 12.6
kDa bands were essentially unchanged in BACE1 Tg
samples and increased in BACE1 KO samples
(Fig. 6D). With regard to total CTF levels, BACE1
deletion led to a minor increase, whereas BACE1 over-
expression caused a significant increase. The increase in
total CTF levels in BACE1 Tg samples are in keeping
with the increase in total APLP2s level (Fig. 3B),
whereas this is not the case for BACE1 KO, where we
observed a substantial decrease in APLP2s level
(Fig. 3A,B) and a minor increase in total APLP2 CTF
level (Fig. 6D). However, there is a good correspon-
dence between the levels of APLP2s and FLAPLP2,
with the level of FLAPLP2 being increased and that of
APLP2s being decreased in BACE1 KO samples. The
same trends for APLP2s, FLAPLP2 and APLP2 CTFs
were confirmed in mice of a different genetic back-
ground (Fig. S5). Taken together, these data suggest
that BACE1 expression largely mediates regulation of
APLP2 by direct proteolysis.
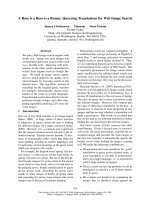
BACE1 deletion does not impair ICD production
As CTFs are the direct precursors of ICD generation,
and as BACE1 expression alters the size of CTFs, we
investigated whether or not BACE1 cleavage was
necessary for ICD production. This was accomplished
by searching for endogenous ICDs in mouse brain and
by the use of an in vitro ICD generation (ICDivg) assay.
For all three proteins, a single band migrating at 5.8
kDa was produced by microsomes from both BACE1
KO and WT mice (Fig. 7A–C). When the ICDivg assay
was performed in the presence of protease inhibitors, we
found an increase in the total amount of ICD produced
(Fig. 7A–C). This finding is in keeping with prior
reports that ICDs produced from the APP family of
proteins are degraded by insulin-degrading enzyme
[43,53], and hence are stabilized in the presence of insu-
lin-degrading enzyme inhibitors. The levels of ICDs
tended to be higher in samples from BACE1 KO brains
than in those from WT brains (Fig. 7A–C). Therefore,
the deletion of BACE1, and consequently the loss of
BACE1 processing of APP, APLP1 and APLP2, had no
detrimental effect on the de novo production of ICDs
(compare lanes 2 and 3 and lanes 1 and 4 in Fig. 7A–C).
In a complementary approach, we also sought to
determine whether the physiological production of
ICDs was altered by BACE1 deletion. As ICDs are
extremely labile [53,54], mouse brains were processed
in a fashion designed to minimize ICD degradation,
and the ICDs present in the homogenates were ana-
lyzed by immunoprecipitation and western blotting
using antibodies C8, W1CT and W2CT. A ladder of
bands was detected migrating until the 7 kDa marker
A
APP
7
17
PI mix
KO WT
–
+
+
–
ICDs
D
APP
4
17
7
WT KO WT KO
Endogenous In vitro
ICDs
B
APLP1
7
17
PI mix
KO WT
– +
+
–
ICDs
E
APLP1
WT KO WT KO
Endogenous In vitro
4
17
7
ICDs
C
APLP2
7
17
PI mix
KO WT
– +
+
–
ICDs
F
APLP2
WT KO WT KO
Endogenous In vitro
4
17
7
ICDs
Fig. 7. BACE1 deletion does not compromise APP, APLP1 and APLP2 ICD generation. Microsomes prepared from BACE1 KO or WT mouse
brains were incubated at 37 °C for 2 h to allow de novo in vitro ICD production (A–C). ICDs were detected by western blot using specific
antibodies against APP [C8 (A)], APLP1 [W1CT (B)] and APLP2 [W2CT (C)]. Western blots shown in (A)–(C) are representative of three differ-
ent experiments. Generation of ICDs was conducted either in the presence (+) or in the absence ()) of protease inhibitors and insulin (PI
mix). Endogenous ICDs were immunoprecipitated from mouse brains with C8, W1CT or W2CT, and immunoprecipitates were analyzed by
western blotting with the same antibodies (D–F). The western blots shown in (D)–(F) are representative of two different experiments. For
comparison, in vitro-generated ICDs were electrophoresed alongside endogenous ICDs (D–F).
C. S. Frigerio et al. b-Secretase processing of APLP1 and APLP2
FEBS Journal 277 (2010) 1503–1518 ª 2010 The Authors Journal compilation ª 2010 FEBS 1511
in all immunoprecipitates (Fig. 7D–F). These bands
probably represent various CTFs, consistent with pre-
vious reports [54], and nonspecific bands due to the
use of the same polyclonal antibody for both immuno-
precipitation and western blotting. In addition, less
abundant lower molecular mass bands were detected.
For APP, two closely migrating bands with estimated
molecular masses of 5.8 and 6.4 kDa were
detected (Fig. 7D). The lower of the two bands per-
fectly comigrated with in vitro-generated APP ICDs,
with the upper band migrating in a manner consistent
for phosphorylated APP ICD [55]. Moreover, as with
the brain microsome-generated APP ICDs, these two
bands were slightly more abundant in the BACE1 KO
samples (Fig. 7D), a result that we observed in two
separate experiments using a total of two BACE1 KO
and two WT mouse brains. For APLP1, a similar lad-
der of bands was detected, together with a single puta-
tive ICD band that comigrated with in vitro-generated
APLP1 ICD (Fig. 7E). Again, the levels of the endoge-
nous APLP1 ICD were slightly higher in extracts of
BACE1 KO brains. For APLP2, the pattern was simi-
lar to that for APP, i.e. a putative ICD band that co-
migrated with in vitro-generated APLP2 ICD at
5.8 kDa, together with a slightly slower-migrating
band at 6.4 kDa (Fig. 7F).
Discussion
By analogy with APP, both APLP1 and APLP2 have
been proposed to be substrates of BACE1 [41]. More-
over, a previous study found evidence that APLP2 is
cleaved by BACE1 in vivo [38], but the processing of
APLP1 and APLP2 by BACE1 has so far been mainly
studied in transfected cell lines [40,41]. As trafficking
and interaction with other cellular partners are likely
to be altered when a single member of the APP family
of proteins is overexpressed [56], we set out to investi-
gate the effects of BACE1 on APLP1 and APLP2 in
mouse models where the only variable parameter was
expression of BACE1.
All three APP family proteins underwent ectodo-
main shedding, and their soluble ectodomains were
detected in the NaCl ⁄ Tris fraction of brain homogen-
ates (for a summary of results, see Table S2). Shedding
of the APP ectodomain appears to be tightly regulated,
as BACE1 levels altered the ratio of APPsa to APPsb,
but did not substantially modify the total levels of
APPs or of APP CTFs. This suggests that there is a
discrete pool of FLAPP that is directed towards
processing, and that a-secretases and b-secretases have
access to the same cellular pool. For APLP1, ablation
of BACE1 resulted in a near complete loss of APLP1s,
suggesting that BACE1 is centrally involved in APLP1
ectodomain cleavage, a notion supported by the find-
ing that the FLAPLP1 level is increased by deletion of
BACE1 and slightly decreased by BACE1 overexpres-
sion. However, the current data cannot discriminate
between cleavage of APLP1 by BACE1 and cleavage of
APLP1 by another enzyme regulated by BACE1.
Indeed, prior studies using cell culture systems have
found APLP1 to be cleaved by an a-secretase-like activ-
ity [40,57]. Importantly, BACE1 overexpression did not
dramatically alter APLP1 processing (as assessed by
APLP1s and APLP1 CTF levels), suggesting that the
ectodomain shedding of APLP1, although not as tightly
regulated as APP, is nonetheless closely regulated.
Interestingly, FLAPLP1 was detected in the NaCl ⁄
Tris brain homogenates, an observation consistent with
the detection of FLAPLP1 in conditioned media from
transfected cells [43]. Moreover, the levels of secreted
FLAPLP1 were influenced by BACE1 expression,
mirroring the modifications of the levels of FLAPLP1
in the NaCl ⁄ Tris-T fraction. An attractive explanation
for the presence of FLAPLP1 in NaCl ⁄ Tris homogen-
ates is its secretion via vesicles, e.g. exosomes [58].
Indeed, it is interesting to note that the prion protein,
which is known to interact with APLP1 [59] and to be
a regulator of BACE1 activity [60], can be secreted via
exosomes [59]. Whatever the mechanism for secretion
of FLAPLP1, the net outcome of these results suggests
that BACE1 has a key role in the regulation of APLP1
maturation, trafficking and secretion.
BACE1 expression also regulates the steady-state
levels of FLAPLP2, in a manner analogous to what
has been shown for APP [50] and to what has been
presented here for APLP1. As BACE1 did not alter the
levels of APP, APLP1 and APLP2 mRNA, it would
appear that BACE1 is an important post-transcriptional
regulator of the APP family of proteins. In agreement
with previous reports [38,50], we detected b-cleavage-
specific products for both APP and APLP2. In addition,
we detected a slightly longer APLP1 CTF when BACE1
was deleted, but we did not see an effect of BACE1 over-
expression on the size of this CTF. We also found that
the total amounts of APP and APLP2 CTFs were not
altered by BACE1 expression, meaning that competing
or complementary pathways intervene to balance the
loss of BACE1 cleavage. In direct NaCl ⁄ Tris-T extracts,
we could not detect ICDs of either APP or APLP2, but
we did detect a band consistent with APLP1 ICD, possi-
bly because APLP1 ICDs are more stable than either
APP or APLP2 ICDs [43,53,54].
This characterization of BACE1 effects on APP,
APLP1 and APLP2 has highlighted the fact that APP
and APLP2 share many similarities, whereas APLP1
b-Secretase processing of APLP1 and APLP2 C. S. Frigerio et al.
1512 FEBS Journal 277 (2010) 1503–1518 ª 2010 The Authors Journal compilation ª 2010 FEBS
has some unique characteristics. APLP1 is an atypical
member of the APP family: it is neuron-specific,
whereas APP and APLP2 are ubiquitously expressed,
and its subcellular localization and dimerization prop-
erties are different from those of APP and APLP2 [16].
Given the similarities between processing of Notch and
of the APP family of proteins, it seems plausible that
APP, APLP1 and APLP2 ICDs could play a role in
transcriptional regulation [42,43]. The APP ICD has
been shown to form a complex with the adaptor pro-
tein Fe65 and the histone acetyltransferase Tip60 that
is capable of inducing transcription of reporter genes
[44]. The ability to form transcriptionally active com-
plexes with Fe65 has also been demonstrated for APLP
ICDs [42,43]; however, definite physiological relevance
of these complexes has yet to be demonstrated.
As we found that BACE1 activity regulates the
maturation and the processing of the three APP family
members, we were interested determining whether abol-
ishing BACE1 activity had a detrimental effect on APP,
APLP1 and APLP2 ICD production, to better charac-
terize the impact of BACE1 inhibition as a putative
therapy for the treatment of AD. We found that the
de novo production and the endogenous levels of ICDs
were not reduced by deletion of BACE1. In fact, in most
cases, deletion of BACE1 resulted in an increase in the
levels of ICDs. Indeed, treatment of cultured cells with
a potent b-secretase inhibitor (Fig. S8) consistently
resulted in a slight elevation of ICD production. How-
ever, how genetic or chemical ablation of BACE1 leads
to a modest increase in ICD levels is unclear. One
potential explanation is that, owing to spatial differ-
ences, a-secretase-derived CTFs are more prone to
c-secretase cleavage than b-secretase-derived CTFs. The
fact that BACE1 deletion does not dramatically alter
ICD production opens two possible scenarios: one
where ICDs produced by c-secretase cleavage of a-sec-
retase-derived and b-secretase-derived CTFs serve the
same function and their levels are tightly regulated by
compensatory mechanisms, and another where only
ICDs produced by a-secretase cleavage are physiologi-
cally relevant, and ICDs derived from the amyloido-
genic processing of APP are quickly degraded. This
latter possibility is corroborated by the fact that over-
expression of BACE1, while leading to increased pro-
cessing of APP and APLP2, does not translate into
increased amounts of APP or APLP2 CTFs. Therefore,
it is reasonable to suppose that the levels of CTFs are
regulated, possibly by degradation of excess CTFs.
Together, these results demonstrate that BACE1 is
involved in ectodomain shedding of APP, APLP1 and
APLP2. BACE1 expression levels appear to regulate
the trafficking and maturation of the APP family of
proteins, but BACE1 ablation did not prevent genera-
tion of APP, APLP1 and APLP2 ICDs. This suggests
that inhibition of BACE1 will not adversely affect the
potentially important signaling role of the ICDs
released by the APP family of proteins, but may
impact on other functions of this family of proteins.
Experimental procedures
Reagents
Unless otherwise specified, chemicals were from Sigma-
Aldrich (Sigma-Aldrich Ireland Ltd, Dublin, Ireland).
Antibodies
Novel rabbit polyclonal antibodies W1NT, W1CT and
W2CT were raised against peptide immunogens conjugated
to keyhole limpet hemocyanin via an N-terminal cysteine
(Table 1). W1NT was raised against residues EPDPQR
SRRCLRDPQR of the human APLP1 ectodomain, and
W1CT and W2CT were raised against peptides NPTYR-
FLEERP and NPTYKYLEQMQI, corresponding to the
extreme C-termini of human APLP1 and human APLP2,
respectively (Fig. S1A). The sequences against which W1CT
and W2CT were raised are identical in both human and
mouse proteins. The sequence against which W1NT was
raised differs in one of the 16 amino acids from the corre-
sponding murine region (R12K, antigen numbering); as
expected, W1NT recognizes both murine and human
APLP1 (Table 1). The specificity of antibodies W1NT,
W1CT and W2CT was confirmed by western blotting of
brain material from mice null for APP, APLP1 or APLP2
(Fig. S1B). The monoclonal antibody 22C11 (Chemicon,
Millipore, Billerica, MA, USA), which recognizes the
N-terminus of APP, the polyclonal antiserum C8, which
recognizes the C-terminus of APP, and the polyclonal
antiserum D2-II, which recognizes the ectodomain of
APLP2 (Calbiochem, EMD Chemicals Inc., Gibbstown,
NJ, USA), have been described previously [43] (Table 1).
The polyclonal antibody against the BACE1 N-terminus
was from Sigma (Dublin, Ireland), and the polyclonal
antibody against rodent amyloid b-peptide (Ab) was from
Signet (Signet Covance, Dedham, MA, USA). The monoclo-
nal antibody against glyceraldehyde-3-phosphate dehydroge-
nase (GAPDH) was from Abcam (Cambridge, UK).
Animals
All genetically manipulated mouse lines have been
described previously [26,38,50,61]. Black Swiss BACE1 KO
and littermate control WT mouse brains and C57 ⁄ BL6
BACE1 Tg mouse brains were from 4-month-old mice.
Additional mouse brains from C57 ⁄ BL6-OLA129 BACE2
C. S. Frigerio et al. b-Secretase processing of APLP1 and APLP2
FEBS Journal 277 (2010) 1503–1518 ª 2010 The Authors Journal compilation ª 2010 FEBS 1513
KO mice, C57 ⁄ B6Jx129SVola BACE1 KO mice, C57 ⁄ BL6
WT mice and C57 ⁄ BL6 BACE1 Tg mice were from
4-month-old mice. Immediately after explant, the cerebel-
lum and olfactory bulb were removed, and the remaining
brain was cut in half along the midline, snap frozen in
liquid nitrogen, and stored at )80 °C until analysis. Levels
of BACE1 protein in all of the brain tissues analyzed were
assessed by western blotting (Fig. S2). Brains from APP,
APLP1 and APLP2 KO mice were provided by U. Mu
¨
ller
(University of Heidelberg, Heidelberg, Germany) [14].
Animal care and handling were performed according to
the Declaration of Helsinki and approved by local ethical
committees.
Preparation of mouse brain extracts
Hemibrains were homogenized in five volumes of NaCl ⁄ Tris
(20 mm Tris, pH 7.4, 150 mm NaCl) containing protease
inhibitors (5 mm EDTA, 1 mm EGTA, 5 l gÆmL
)1
leupeptin,
5 lgÆmL
)1
aprotinin, 2 lgÆ mL
)1
pepstatin, 120 lgÆmL
)1
Pefabloc, 2 mm 1,10-phenanthroline) with 40 strokes of a
Dounce homogenizer at 5000 r.p.m. The resulting suspen-
sion was then centrifuged at 175 000 g and 4 °C for 30 min,
and the upper 75% of the supernatant was collected. Protein
content was assessed using a bicinchoninic acid protein assay
kit (Pierce, Rockford, IL, USA), and samples were then ali-
quoted and stored at )80 °C until use. The membrane-con-
taining pellet was resuspended by pipetting in five volumes of
100 mm sodium bicarbonate (pH 11.4), and incubated on a
rocking platform for 15 min at 4 °C. The washed pellet was
harvested by centrifugation, as described above and washed
in five volumes of NaCl ⁄ Tris. The membrane fraction was
again pelleted by centrifugation as described above, and then
resuspended by pipetting in five volumes of NaCl ⁄ Tris-T
plus protease inhibitors. In order to ensure effective
extraction of integral membrane proteins, this suspension
was incubated on a rocking platform at room temperature
for 15 min, homogenized with 40 strokes of a Dounce
homogenizer, and sonicated with a microtip attached to an
XL-2000 sonicator (Misonix Inc., Farmingdale, NY, USA)
at power setting 4 ( 12 W) for 30 s. The detergent extract
was centrifuged as described above, and the upper 75% of
the supernatant was collected. Protein content was assessed
using a bicinchoninic acid protein assay kit (Pierce), and
samples were then aliquoted and stored at )80 °C until use.
Quantitative real-time PCR analysis
Total RNA was isolated using TRI Reagent (Ambion, Austin,
TX, USA) according to the manufacturer’s instructions, and
quantified using a Nanodrop spectrophotometer (Thermo
Scientific, Wilmington, DE, USA). One-microgram aliquots
of total RNA were treated with deoxyribonuclease I
(Invitrogen, Carlsbad, CA, USA) and used to synthesize
first-strand cDNA with 200 U of SuperScript II Reverse
Transcriptase (Invitrogen) in a final reaction volume of
11 lL, containing 50 ng of random hexamers. One microli-
ter of the first-strand cDNA PCR reaction was used as
template for quantitative real-time PCR amplification with
primers specific for APP, APLP1 and APLP2 (Sigma-
Genosys, Hamburg, Germany) (Table S1). Primers specific
for the 18S rRNA were used as an internal control. Primer
pairs for the APP family of proteins contained one intron-
spanning region to avoid amplification of genomic DNA.
Quantitative real-time PCR reactions were run in duplicate.
One microliter of Taq DNA polymerase and the appropri-
ate primer pair, each at a concentration of 0.5 lm, together
with the Power SYBR Green PCR Master Mix (Invitro-
gen), were brought to a final volume of 10 lL and ana-
lyzed on an ABI Prism 7000 Sequence Detection System
(Applied Biosystems, Darmstadt, Germany). An initial step
of 15 min at 95°C for polymerase activation was followed
by 40 cycles of a standard PCR protocol (15 s at 95 °C,
30 s at 60 °C, 30 s at 72 °C) as described in the supplier’s
protocol (Applied Biosystems). APP, APLP1 and APLP2
expression was normalized to 18S rRNA levels by the com-
parative cycle threshold (Ct) method.
ICDivg assay with mouse brain-derived
microsomes
This method was adapted from an ICD in vitro generation
assay previously used with microsomes prepared from
cultured cells [62]. Hemibrains were homogenized on ice
in eight volumes of hypotonic lysis buffer (10 mm Mops,
pH 7, containing 10 mm KCl, 5 mm EDTA, 1 mm EGTA,
120 lgÆmL
)1
Pefabloc, and 2 mm 1,10-phenanthroline) with
30 passes of a Dounce homogenizer at 6000 r.p.m. The
resulting homogenate was divided into 1 mL aliquots, and
centrifuged at 1000 g and 4 °C for 15 min, the supernatant
was then transferred to a new tube, and microsomes were
harvested by centrifugation at 16 000 g and 4 °C for 40 min.
Each pellet derived from 1 mL of homogenate was resus-
pended in 100 lL of assay buffer (150 mm sodium citrate,
pH 6.8) either containing or devoid of a cocktail of protease
inhibitors (5 mm EDTA, 1 mm EGTA, 2 mm 1,10-phenan-
throline, 250 lgÆmL
)1
human recombinant insulin). Micro-
somes were then incubated in a water bath at 37 °C for 2 h,
after which they were placed on ice for 10 min to stop the
reaction, and centrifuged at 150 000 g and 4 °C for 75 min
in an Optima centrifuge, using a TLA55 rotor (Beckman
Coulter, Fullerton, CA, USA). The upper 90 l L of the super-
natant was collected for analysis by western blotting.
Immunoprecipitation of endogenous ICDs from
mouse brains
Hemibrains were homogenized on ice in nine volumes of
homogenization buffer (50 mm Tris ⁄ HCl, pH 7.4, containing
b-Secretase processing of APLP1 and APLP2 C. S. Frigerio et al.
1514 FEBS Journal 277 (2010) 1503–1518 ª 2010 The Authors Journal compilation ª 2010 FEBS
1% SDS, 150 mm NaCl, 5 mm EDTA, 5 lgÆmL
)1
leupeptin, 5 lgÆmL
)1
aprotinin, 2 lgÆmL
)1
pepstatin,
120 lgÆmL
)1
Pefabloc, 2 mm 1,10-phenanthroline) with 30
passes of a Dounce homogenizer at 6000 r.p.m. The homo-
genates were then boiled at 100 °C for 10 min, and divided
into 1 mL aliquots prior to sonication for 30 s at power
setting 4 ( 12 W), using a XL-2000 sonicator connected
to a microtip (Misonix Inc.). Following sonication, aliquots
were pooled, boiled for a further 10 min, and then centri-
fuged at 16 000 g for 20 min. The supernatant was col-
lected, transferred to a fresh tube, and diluted 1 : 10 with
lysis buffer (50 mm Tris base, pH 7.6, containing 150 mm
NaCl, 5 mm EDTA, 2% NP-40, 5 lgÆmL
)1
leupeptin,
5 lgÆmL
)1
aprotinin, 2 lgÆmL
)1
pepstatin, 120 lgÆmL
)1
Pefabloc, and 2 mm 1,10-phenanthroline). To immunopre-
cipitate APP, APLP1 and APLP2 ICDs, 1 mL aliquots of
brain extracts were incubated overnight on a rocking plat-
form at 4 °C with either antibody C8, W1CT or W2CT,
respectively (at a dilution of 1 : 40), together with 40 lLof
protein A–Sepharose. Beads were collected by centrifuga-
tion at 6000 g for 5 min, and washed in subsequent steps
of incubation for 20 min on a rocking platform at 4 °C
with 0.5 m STEN buffer (50 mm Tris base, pH 7.6,
500 mm NaCl, 2 mm EDTA, 2% NP-40), SDS ⁄ STEN buf-
fer (50 mm Tris base, pH 7.6, 150 mm NaCl, 2 mm EDTA,
2% NP-40, 0.1% SDS) and STEN buffer (50 mm Tris
base, pH 7.6, 150 mm NaCl, 2 mm EDTA, 2% NP-40).
Captured proteins were eluted with 2· Tris ⁄ Tricine electro-
phoresis sample buffer containing 10% b-mercaptoethanol
(20 lL per sample) [63].
Western blot analysis
NaCl ⁄ Tris homogenates of mouse brains were diluted with
4· Tris ⁄ glycine sample buffer (·1 concentrations: 62.5 mm
Tris ⁄ HCl, pH 6.8, 10% glycerol, 2% SDS) and electro-
phoresed on 10% polyacrylamide Tris ⁄ glycine gels [64],
and NaCl ⁄ Tris-T homogenates of mouse brains and
ICDivg samples were diluted with 4· Tris ⁄ Tricine sample
buffer (·1 concentrations: 450 mm Tris, pH 8.45, 10%
glycerol, 4% SDS) and electrophoresed on precast Novex
10–20% polyacrylamide Tris ⁄ Tricine gels (Invitrogen).
Immunoprecipitated endogenous ICDs from mouse brains
were also electrophoresed on precast Novex 10–20% poly-
acrylamide Tris ⁄ Tricine gels (Invitrogen). Proteins were
transferred onto nitrocellulose (0.2 lm pore size; Sigma-
Aldrich Ltd) at 400 mA and 4 °C for 2 h. Membranes
were subsequently blocked for 1 h at room temperature
with 5% skimmed milk (Fluka, Sigma-Aldrich Ireland
Ltd) in NaCl ⁄ Tris-Tw, washed twice for 10 min with
NaCl ⁄ Tris-Tw to remove traces of blocker, and incubated
overnight with primary antibodies diluted in NaCl ⁄ Tris-
Tw containing 5% skimmed milk. On the following day,
blots were washed four times for 15 min with NaCl ⁄ Tris-
Tw, incubated with appropriate horseradish peroxidase-
linked secondary antibodies (Amersham, GE Healthcare,
Chalfont St Giles, UK) for 1 h at room temperature,
washed as above, and visualized using an enhanced chemi-
luminescence kit (Pierce) and Hyperfilm MP (Amersham,
GE Healthcare).
Data analysis
Band intensities were quantified using scion image (Scion
Corporation, Frederick, MD,. USA), and data were ana-
lyzed using one-way ANOVA (sigmastat; Systat Software
Inc., Chicago, IL, USA).
Acknowledgements
The authors thank U. Mu
¨
ller (University of Heidel-
berg, Heidelberg, Germany) for APP, APLP1 and
APLP2 KO mouse brains, J. Tang (Protein Studies
Program, Oklahoma Medical Research Foundation,
University of Oklahoma Health Science Center, Okla-
homa City, OK 73104, USA) for the b-secretase inhibi-
tor GRL-8234, B. Boland (UCD, Dublin, Ireland) for
help with the midi Tris ⁄ Tricine PAGE gels, and
T. Young-Pearse (CND, Harvard Medical School,
Boston, USA) for constructive discussions and critical
reading of the manuscript. This work was supported
by Wellcome Trust grant 067660 (D. M. Walsh), NIH
grant AG027443 (D. M. Walsh and D. J. Selkoe), and
the Foundation for Neurologic Diseases (D. M.
Walsh).
References
1 Selkoe DJ (2001) Alzheimer’s disease: genes, proteins,
and therapy. Physiol Rev 81, 741–766.
2 Coulson EJ, Paliga K, Beyreuther K & Masters CL
(2000) What the evolution of the amyloid protein pre-
cursor supergene family tells us about its function.
Neurochem Int 36, 175–184.
3 Wasco W, Bupp K, Magendantz M, Gusella JF, Tanzi
RE & Solomon F (1992) Identification of a mouse brain
cDNA that encodes a protein related to the Alzheimer
disease-associated amyloid beta protein precursor. Proc
Natl Acad Sci USA 89, 10758–10762.
4 Wasco W, Gurubhagavatula S, Paradis MD, Romano
DM, Sisodia SS, Hyman BT, Neve RL & Tanzi RE
(1993) Isolation and characterization of APLP2 encod-
ing a homologue of the Alzheimer’s associated amyloid
beta protein precursor. Nat Genet 5, 95–100.
5 Bayer TA, Wirths O, Majtenyi K, Hartmann T,
Multhaup G, Beyreuther K & Czech C (2001) Key
factors in Alzheimer’s disease: beta-amyloid precursor
protein processing, metabolism and intraneuronal
transport. Brain Pathol 11, 1–11.
C. S. Frigerio et al. b-Secretase processing of APLP1 and APLP2
FEBS Journal 277 (2010) 1503–1518 ª 2010 The Authors Journal compilation ª 2010 FEBS 1515
6 Walsh DM, Minogue AM, Sala Frigerio C, Fadeeva
JV, Wasco W & Selkoe DJ (2007) The APP family of
proteins: similarities and differences. Biochem Soc Trans
35, 416–420.
7 Schmechel DE, Goldgaber D, Burkhart DS, Gilbert JR,
Gajdusek DC & Roses AD (1988) Cellular localization
of messenger RNA encoding amyloid-beta-protein in
normal tissue and in Alzheimer disease. Alzheimer Dis
Assoc Disord 2 , 96–111.
8 Kim TW, Wu K, Xu JL, McAuliffe G, Tanzi RE, Wasco
W & Black IB (1995) Selective localization of amyloid
precursor-like protein 1 in the cerebral cortex postsynap-
tic density. Brain Res Mol Brain Res 32, 36–44.
9 Wang P, Yang G, Mosier DR, Chang P, Zaidi T, Gong
YD, Zhao NM, Dominguez B, Lee KF, Gan WB et al.
(2005) Defective neuromuscular synapses in mice lack-
ing amyloid precursor protein (APP) and APP-like
protein 2. J Neurosci 25, 1219–1225.
10 Small DH, Nurcombe V, Reed G, Clarris H, Moir R,
Beyreuther K & Masters CL (1994) A heparin-binding
domain in the amyloid protein precursor of Alzheimer’s
disease is involved in the regulation of neurite
outgrowth. J Neurosci 14, 2117–2127.
11 Priller C, Bauer T, Mitteregger G, Krebs B, Kretzsch-
mar HA & Herms J (2006) Synapse formation and
function is modulated by the amyloid precursor protein.
J Neurosci 26, 7212–7221.
12 Young-Pearse TL, Bai J, Chang R, Zheng JB, LoTurco
JJ & Selkoe DJ (2007) A critical function for beta-
amyloid precursor protein in neuronal migration
revealed by in utero RNA interference. J Neurosci 27,
14459–14469.
13 Herms J, Anliker B, Heber S, Ring S, Fuhrmann M,
Kretzschmar H, Sisodia S & Muller U (2004) Cortical
dysplasia resembling human type 2 lissencephaly in mice
lacking all three APP family members. EMBO J 23,
4106–4115.
14 Heber S, Herms J, Gajic V, Hainfellner J, Aguzzi A,
Rulicke T, von Kretzschmar H, von Koch C, Sisodia S,
Tremml P et al. (2000) Mice with combined gene
knock-outs reveal essential and partially redundant
functions of amyloid precursor protein family members.
J Neurosci 20, 7951–7963.
15 Soba P, Eggert S, Wagner K, Zentgraf H, Siehl K,
Kreger S, Lower A, Langer A, Merdes G, Paro R et al.
(2005) Homo- and heterodimerization of APP family
members promotes intercellular adhesion. EMBO J 24,
3624–3634.
16 Kaden D, Voigt P, Munter LM, Bobowski KD,
Schaefer M & Multhaup G (2009) Subcellular
localization and dimerization of APLP1 are strikingly
different from APP and APLP2. J Cell Sci 122, 368–
377.
17 Esch FS, Keim PS, Beattie EC, Blacher RW, Culwell
AR, Oltersdorf T, McClure D & Ward PJ (1990) Cleav-
age of amyloid beta peptide during constitutive process-
ing of its precursor. Science 248, 1122–1124.
18 Sisodia SS (1992) Beta-amyloid precursor protein cleav-
age by a membrane-bound protease. Proc Natl Acad Sci
USA 89, 6075–6079.
19 Allinson TM, Parkin ET, Turner AJ & Hooper NM
(2003) ADAMs family members as amyloid precur-
sor protein alpha-secretases. J Neurosci Res 74, 342–
352.
20 Koo EH & Squazzo SL (1994) Evidence that produc-
tion and release of amyloid beta-protein involves the
endocytic pathway. J Biol Chem 269, 17386–17389.
21 Vassar R, Bennett BD, Babu-Khan S, Kahn S, Mendiaz
EA, Denis P, Teplow DB, Ross S, Amarante P, Loeloff
R et al. (1999) Beta-secretase cleavage of Alzheimer’s
amyloid precursor protein by the transmembrane aspar-
tic protease BACE. Science 286, 735–741.
22 Cai H, Wang Y, McCarthy D, Wen H, Borchelt DR,
Price DL & Wong PC (2001) BACE1 is the major beta-
secretase for generation of Abeta peptides by neurons.
Nat Neurosci 4, 233–234.
23 Lin X, Koelsch G, Wu S, Downs D, Dashti A & Tang
J (2000) Human aspartic protease memapsin 2 cleaves
the beta-secretase site of beta-amyloid precursor pro-
tein. Proc Natl Acad Sci USA 97, 1456–1460.
24 Hussain I, Powell D, Howlett DR, Tew DG, Meek TD,
Chapman C, Gloger IS, Murphy KE, Southan CD,
Ryan DM et al. (1999) Identification of a novel aspartic
protease (Asp 2) as beta-secretase. Mol Cell Neurosci
14, 419–427.
25 Willem M, Lammich S & Haass C (2009) Function, reg-
ulation and therapeutic properties of beta-secretase
(BACE1). Semin Cell Dev Biol 20, 175–182.
26 Luo Y, Bolon B, Kahn S, Bennett BD, Babu-Khan S,
Denis P, Fan W, Kha H, Zhang J, Gong Y et al. (2001)
Mice deficient in BACE1, the Alzheimer’s beta-secre-
tase, have normal phenotype and abolished beta-amy-
loid generation. Nat Neurosci 4, 231–232.
27 Willem M, Garratt AN, Novak B, Citron M, Kauf-
mann S, Rittger A, DeStrooper B, Saftig P, Birchmeier
C & Haass C (2006) Control of peripheral nerve myeli-
nation by the beta-secretase BACE1. Science 314, 664–
666.
28 Hu X, Hicks CW, He W, Wong P, Macklin WB, Trapp
BD & Yan R (2006) Bace1 modulates myelination in
the central and peripheral nervous system. Nat Neurosci
9, 1520–1525.
29 Harrison SM, Harper AJ, Hawkins J, Duddy G, Grau
E, Pugh PL, Winter PH, Shilliam CS, Hughes ZA,
Dawson LA et al. (2003) BACE1 (beta-secretase) trans-
genic and knockout mice: identification of neurochemi-
cal deficits and behavioral changes. Mol Cell Neurosci
24, 646–655.
30 Savonenko AV, Melnikova T, Laird FM, Stewart KA,
Price DL & Wong PC (2008) Alteration of BACE1-
b-Secretase processing of APLP1 and APLP2 C. S. Frigerio et al.
1516 FEBS Journal 277 (2010) 1503–1518 ª 2010 The Authors Journal compilation ª 2010 FEBS
dependent NRG1 ⁄ ErbB4 signaling and schizophrenia-
like phenotypes in BACE1-null mice. Proc Natl Acad
Sci USA 105, 5585–5590.
31 Kitazume S, Tachida Y, Oka R, Shirotani K, Saido TC
& Hashimoto Y (2001) Alzheimer’s beta-secretase, beta-
site amyloid precursor protein-cleaving enzyme, is
responsible for cleavage secretion of a Golgi-resident
sialyltransferase. Proc Natl Acad Sci USA 98, 13554–
13559.
32 Lichtenthaler SF, Dominguez DI, Westmeyer GG,
Reiss K, Haass C, Saftig P, De Strooper B & Seed B
(2003) The cell adhesion protein P-selectin glycoprotein
ligand-1 is a substrate for the aspartyl protease BACE1.
J Biol Chem 278, 48713–48719.
33 Kim DY, Carey BW, Wang H, Ingano LA, Binshtok
AM, Wertz MH, Pettingell WH, He P, Lee VM, Woolf
CJ et al. (2007) BACE1 regulates voltage-gated sodium
channels and neuronal activity. Nat Cell Biol 9, 755–
764.
34 Kuhn PH, Marjaux E, Imhof A, De Strooper B, Haass
C & Lichtenthaler SF (2007) Regulated intramembrane
proteolysis of the interleukin-1 receptor II by alpha-,
beta-, and gamma-secretase. J Biol Chem 282, 11982–
11995.
35 Slunt HH, Thinakaran G, Von Koch C, Lo AC, Tanzi
RE & Sisodia SS (1994) Expression of a ubiquitous,
cross-reactive homologue of the mouse beta-amyloid
precursor protein (APP). J Biol Chem 269, 2637–2644.
36 Webster MT, Groome N, Francis PT, Pearce BR,
Sherriff FE, Thinakaran G, Felsenstein KM, Wasco W,
Tanzi RE & Bowen DM (1995) A novel protein, amy-
loid precursor-like protein 2, is present in human brain,
cerebrospinal fluid and conditioned media. Biochem J
310, 95–99.
37 Paliga K, Peraus G, Kreger S, Durrwang U, Hesse L,
Multhaup G, Masters CL, Beyreuther K & Weidemann
A (1997) Human amyloid precursor-like protein 1 –
cDNA cloning, ectopic expression in COS-7 cells and
identification of soluble forms in the cerebrospinal fluid.
Eur J Biochem 250, 354–363.
38 Pastorino L, Ikin AF, Lamprianou S, Vacaresse N,
Revelli JP, Platt K, Paganetti P, Mathews PM, Harroch
S & Buxbaum JD (2004) BACE (beta-secretase) modu-
lates the processing of APLP2 in vivo. Mol Cell Neuro-
sci 25, 642–649.
39 Endres K, Postina R, Schroeder A, Mueller U &
Fahrenholz F (2005) Shedding of the amyloid precursor
protein-like protein APLP2 by disintegrin-metallopro-
teinases. FEBS J 272, 5808–5820.
40 Eggert S, Paliga K, Soba P, Evin G, Masters CL,
Weidemann A & Beyreuther K (2004) The proteolytic
processing of the amyloid precursor protein gene family
members APLP-1 and APLP-2 involves alpha-, beta-,
gamma-, and epsilon-like cleavages: modulation of
APLP-1 processing by n-glycosylation. J Biol Chem
279, 18146–18156.
41 Li Q & Sudhof TC (2004) Cleavage of amyloid-beta
precursor protein and amyloid-beta precursor-like pro-
tein by BACE 1. J Biol Chem 279, 10542–10550.
42 Scheinfeld MH, Ghersi E, Laky K, Fowlkes BJ &
D’Adamio L (2002) Processing of beta-amyloid precur-
sor-like protein-1 and -2 by gamma-secretase regulates
transcription. J Biol Chem 277, 44195–44201.
43 Walsh DM, Fadeeva JV, LaVoie MJ, Paliga K, Eggert
S, Kimberly WT, Wasco W & Selkoe DJ (2003)
gamma-Secretase cleavage and binding to FE65 regulate
the nuclear translocation of the intracellular C-terminal
domain (ICD) of the APP family of proteins. Biochem-
istry 42, 6664–6673.
44 Cao X & Sudhof TC (2001) A transcriptionally [correction
of transcriptively] active complex of APP with Fe65 and
histone acetyltransferase Tip60. Science 293, 115–120.
45 Scheinfeld MH, Matsuda S & D’Adamio L (2003)
JNK-interacting protein-1 promotes transcription of A
beta protein precursor but not A beta precursor-like
proteins, mechanistically different than Fe65. Proc Natl
Acad Sci USA 100, 1729–1734.
46 Pardossi-Piquard R, Petit A, Kawarai T, Sunyach C,
Alves da Costa C, Vincent B, Ring S, D’Adamio L,
Shen J, Muller U et al. (2005) Presenilin-dependent
transcriptional control of the Abeta-degrading enzyme
neprilysin by intracellular domains of betaAPP and
APLP. Neuron 46, 541–554.
47 Hebert SS, Serneels L, Tolia A, Craessaerts K, Derks
C, Filippov MA, Muller U & De Strooper B (2006)
Regulated intramembrane proteolysis of amyloid pre-
cursor protein and regulation of expression of putative
target genes. EMBO Rep 7, 739–745.
48 Chen AC & Selkoe DJ (2007) Response to:
Pardossi-Piquard et al., ‘Presenilin-dependent transcrip-
tional control of the Abeta-degrading enzyme neprilysin
by intracellular domains of betaAPP and APLP.’
Neuron 46, 541-554. Neuron 53, 479–483.
49 Bruni P, Minopoli G, Brancaccio T, Napolitano M,
Faraonio R, Zambrano N, Hansen U & Russo T
(2002) Fe65, a ligand of the Alzheimer’s beta-amyloid
precursor protein, blocks cell cycle progression by
down-regulating thymidylate synthase expression. J Biol
Chem 277, 35481–35488.
50 Bodendorf U, Danner S, Fischer F, Stefani M, Sturch-
ler-Pierrat C, Wiederhold KH, Staufenbiel M & Paga-
netti P (2002) Expression of human beta-secretase in the
mouse brain increases the steady-state level of beta-
amyloid. J Neurochem 80, 799–806.
51 Weidemann A, Konig G, Bunke D, Fischer P, Salbaum
JM, Masters CL & Beyreuther K (1989) Identification,
biogenesis, and localization of precursors of Alzheimer’s
disease A4 amyloid protein. Cell 57, 115–126.
C. S. Frigerio et al. b-Secretase processing of APLP1 and APLP2
FEBS Journal 277 (2010) 1503–1518 ª 2010 The Authors Journal compilation ª 2010 FEBS 1517
52 Weidemann A, Eggert S, Reinhard FB, Vogel M, Paliga
K, Baier G, Masters CL, Beyreuther K & Evin G
(2002) A novel epsilon-cleavage within the transmem-
brane domain of the Alzheimer amyloid precursor pro-
tein demonstrates homology with Notch processing.
Biochemistry 41, 2825–2835.
53 Edbauer D, Willem M, Lammich S, Steiner H &
Haass C (2002) Insulin-degrading enzyme rapidly
removes the beta-amyloid precursor protein
intracellular domain (AICD). J Biol Chem 277,
13389–13393.
54 Kimberly WT, Zheng JB, Town T, Flavell RA & Selkoe
DJ (2005) Physiological regulation of the beta-amyloid
precursor protein signaling domain by c-Jun N-terminal
kinase JNK3 during neuronal differentiation. J Neurosci
25, 5533–5543.
55 Suzuki T & Nakaya T (2008) Regulation of APP by
phosphorylation and protein interactions. J Biol Chem
283, 29633–29637.
56 Neumann S, Schobel S, Jager S, Trautwein A, Haass C,
Pietrzik CU & Lichtenthaler SF (2006) Amyloid precur-
sor-like protein 1 influences endocytosis and proteolytic
processing of the amyloid precursor protein. J Biol
Chem 281, 7583–7594.
57 Minogue AM, Stubbs AK, Frigerio CS, Boland B,
Fadeeva JV, Tang J, Selkoe DJ & Walsh DM (2009)
gamma-Secretase processing of APLP1 leads to the
production of a p3-like peptide that does not aggre-
gate and is not toxic to neurons. Brain Res 1262, 89–
99.
58 van Niel G, Porto-Carreiro I, Simoes S & Raposo G
(2006) Exosomes: a common pathway for a specialized
function. J Biochem 140, 13–21.
59 Yehiely F, Bamborough P, Da Costa M, Perry BJ,
Thinakaran G, Cohen FE, Carlson GA & Prusiner SB
(1997) Identification of candidate proteins binding to
prion protein. Neurobiol Dis 3, 339–355.
60 Parkin ET, Watt NT, Hussain I, Eckman EA,
Eckman CB, Manson JC, Baybutt HN, Turner AJ &
Hooper NM (2007) Cellular prion protein regulates
beta-secretase cleavage of the Alzheimer’s amyloid
precursor protein. Proc Natl Acad Sci USA 104,
11062–11067.
61 Willem M, Dewachter I, Smyth N, Van Dooren T,
Borghgraef P, Haass C & Van Leuven F (2004)
beta-Site amyloid precursor protein cleaving enzyme 1
increases amyloid deposition in brain parenchyma but
reduces cerebrovascular amyloid angiopathy in aging
BACE · APP[V717I] double-transgenic mice. Am J
Pathol 165, 1621–1631.
62 Sala Frigerio C, Kukar TL, Fauq A, Engel PC, Golde
TE & Walsh DM (2009) An NSAID-like compound,
FT-9, preferentially inhibits gamma-secretase cleavage
of the amyloid precursor protein compared to its effect
on amyloid precursor-like protein 1. Biochemistry 48,
10894–10904.
63 Kimberly WT, Zheng JB, Guenette SY & Selkoe DJ
(2001) The intracellular domain of the beta-amyloid
precursor protein is stabilized by Fe65 and translocates
to the nucleus in a notch-like manner. J Biol Chem 276,
40288–40292.
64 Laemmli UK (1970) Cleavage of structural proteins
during the assembly of the head of bacteriophage T4.
Nature 227, 680–685.
Supporting information
The following supplementary material is available:
Fig. S1. Antibodies recognizing the APP family of pro-
teins.
Fig. S2. Confirmation of BACE1 overexpression and
KO by immunoblotting using an antibody against
BACE1.
Fig. S3. Effects of BACE1 expression on APP process-
ing are independent of genetic background.
Fig. S4. Effects of BACE1 expression on APLP1 pro-
cessing are independent of genetic background.
Fig. S5. Effect of BACE1 expression on APLP2 pro-
cessing are independent of genetic background.
Fig. S6. APP, APLP1 and APLP2 mRNA levels are
not altered by either deletion or overexpression of
BACE1.
Fig. S7. The 94 kDa APLP1 species present in NaCl ⁄ -
Tris-T mouse brain homogenates is N-glycosylated.
Fig. S8. BACE1 inhibition slightly increases ICD pro-
duction in differentiated N2a cells.
Table S1. Primers used for quanitative real-time analysis.
Table S2. Effects of BACE1 deletion and overexpres-
sion on APP, APLP1 and APLP2.
This supplementary material can be found in the
online version of this article.
Please note: As a service to our authors and readers,
this journal provides supporting information supplied
by the authors. Such materials are peer-reviewed and
may be re-organized for online delivery, but are not
copy-edited or typeset. Technical support issues arising
from supporting information (other than missing files)
should be addressed to the authors.
b-Secretase processing of APLP1 and APLP2 C. S. Frigerio et al.
1518 FEBS Journal 277 (2010) 1503–1518 ª 2010 The Authors Journal compilation ª 2010 FEBS