Báo cáo khoa học: Insulin like growth factor-1-induced phosphorylation and altered distribution of tuberous sclerosis complex (TSC)1⁄TSC2 in C2C12 myotubes pptx
Bạn đang xem bản rút gọn của tài liệu. Xem và tải ngay bản đầy đủ của tài liệu tại đây (743.94 KB, 12 trang )
Insulin like growth factor-1-induced phosphorylation and
altered distribution of tuberous sclerosis complex
(TSC)1
⁄
TSC2 in C2C12 myotubes
Mitsunori Miyazaki, John J. McCarthy and Karyn A. Esser
Center for Muscle Biology, Department of Physiology, College of Medicine, University of Kentucky, Lexington, KY, USA
Keywords
mTOR; rapamycin; TSC1; TSC2; wortmannin
Correspondence
K. A. Esser, Department of Physiology,
College of Medicine, University of Kentucky,
800 Rose Street, UKMC MS508, Lexington,
KY 40536, USA
Fax: +1 859 323 1070
Tel: +1 859 323 8103
E-mail:
(Received 11 January 2010, revised 26
February 2010, accepted 2 March 2010)
doi:10.1111/j.1742-4658.2010.07635.x
Insulin like growth factor-1 (IGF-1) is established as an anabolic factor
that can induce skeletal muscle growth by activating the phosphoinosi-
tide 3-kinase ⁄ Akt ⁄ mammalian target of rapamycin (mTOR) pathway.
Although this signaling pathway has been the subject of much study, the
molecular mechanisms linking IGF-1 binding to mTOR activation remain
poorly defined in muscle. The present study aimed to test the hypothesis
that IGF-1 activation of mTOR in C2C12 myotubes requires a phosphory-
lation-dependent, altered distribution of the tuberous sclerosis complex
(TSC)1 ⁄ TSC2 complex from the membrane to the cytosol. We found that
IGF-1 treatment does not affect complex formation between TSC1 and
TSC2, but rather IGF-1 induces an altered distribution of the TSC1 ⁄ TSC2
complex in C2C12 myotubes. In response to IGF-1 treatment, there was a
relative redistribution of the TSC1 ⁄ TSC2 complex, composed of TSC1 and
phosphorylated TSC2, from the membrane to the cytosol. IGF-1-stimu-
lated TSC1 ⁄ TSC2 phosphorylation and redistribution were completely pre-
vented by the phosphoinositide 3-kinase inhibitor wortmannin, but were
not with the downstream mTOR inhibitor, rapamycin. When a nonphosph-
orylatable form of TSC2 (S939A) was overexpressed, phosphorylation-
dependent binding of the scaffold protein 14-3-3 to TSC2 was diminished
and no redistribution of the TSC1 ⁄ TSC2 complex was observed after
IGF-1 stimulation. These results indicate that TSC2 phosphorylation in
response to IGF-1 treatment is necessary for the altered distribution of the
TSC1 ⁄ TSC2 complex to the cytosol. We suggest that this translocation is
likely critical for mTOR activation by dissociating the interaction between
the GTPase activating protein activity of the TSC1 ⁄ TSC2 complex and its
downstream target, Ras homolog enriched in brain.
Structured digital abstract
l
MINT-7712277, MINT-7712399: Tsc2 (uniprotkb:Q61037), S6K1 (uniprotkb:Q8BSK8) and
Tsc1 (uniprotkb:
Q9EP53) colocalize (MI:0403)bycosedimentation through density gradient
(
MI:0029)
l
MINT-7712211, MINT-7712236, MINT-7712313, MINT-7712323: Tsc1 (uniprotkb:Q9EP53)
physically interacts (
MI:0915)withTsc2 (uniprotkb:Q61037)byanti bait coimmunoprecipitation
(
MI:0006)
Abbreviations
ERK, extracellular signal-regulated kinase; GAP, GTPase activating protein; GST, glutathione S-transferase; IGF-1, insulin like growth factor-1;
MEK, mitogen-activated protein kinase kinase; mTOR, mammalian target of rapamycin; PI3K, phosphoinositide 3-kinase; Rheb, Ras homolog
enriched in brain; S6K1, S6 kinase 1; TSC, tuberous sclerosis complex.
2180 FEBS Journal 277 (2010) 2180–2191 ª 2010 The Authors Journal compilation ª 2010 FEBS
Introduction
Skeletal muscle mass is generally considered to be
determined by the net balance between the rates of pro-
tein synthesis and degradation [1,2]. To date, numerous
studies have shown that the mammalian target of rapa-
mycin (mTOR) plays a critical role in regulating the
rate of protein synthesis and cell hypertrophy in skele-
tal muscle [3–6]. mTOR is a serine ⁄ threonine kinase of
the phosphatidylinositol kinase-related kinase family
and is highly conserved from yeast to mammals [7]. In
skeletal muscle cells, mTOR serves as a central integra-
tor of a wide range of signals that function to either
activate or inhibit protein synthesis and cell growth [2].
The most well defined signaling mechanism regulating
mTOR activity in skeletal muscle is the insulin like
growth factor-1 (IGF-1) ⁄ insulin-dependent pathway
[5,6]. Stimulation of muscle cells with growth factors
such as IGF-1 leads to the activation of phosphoinosi-
tide 3-kinase (PI3K) and its downstream effector Akt,
triggering multiple downstream signaling events, includ-
ing mTOR activation [8].
Studies in both Drosophila and mammalian cells
have indicated that Akt influences mTOR signaling by
regulation of the protein complex of tuberous sclerosis
complex (TSC)1 ⁄ TSC2 [9–12]. The TSC1 ⁄ TSC2 pro-
tein complex is a heterodimer composed of the TSC1
and TSC2 proteins, and TSC2 is a direct target of Akt
phosphorylation. Within the TSC1 ⁄ TSC2 protein com-
plex, TSC2 functions as a GTPase activating protein
(GAP) for Ras homolog enriched in brain (Rheb), a
small G protein. The GTP-bound active form of Rheb
strongly stimulates mTOR and its downstream targets,
such as the ribosomal S6 kinase 1 (S6K1) and the
eukaryotic initiation factor 4E-binding protein [13–16].
It is now generally recognized that the primary func-
tion of the TSC1⁄ TSC2 protein complex is to inhibit
mTOR signaling. Cells or tissues with depleted levels
of TSC1 or TSC2 have higher mTOR activity, result-
ing in a robust cell growth and tumorigenesis
[9,10,17,18]. Although it is clear that growth factor-
induced activation of Akt blocks TSC1 ⁄ TSC2 inhibi-
tion of mTOR signaling [9–11], the molecular mecha-
nism by which Akt inhibits the function of
TSC1 ⁄ TSC2 protein complex as a cell growth suppres-
sor remains undefined. A study using Drosophila cells
provided evidence that the TSC1 ⁄ TSC2 protein com-
plex became dissociated upon insulin stimulation and
was dependent on TSC2 phosphorylation by Akt [9].
Cai et al. [19] reported that phosphorylation of TSC2
by Akt caused the translocation of TSC2 from the
membrane to the cytosolic fraction. The movement of
phosphorylated TSC2 to the cytosol, away from mem-
brane-bound TSC1, relieved TSC1 ⁄ TSC2 protein com-
plex inhibition of Rheb [19]. By contrast, Dong and
Pan [20] found that neither insulin stimulation nor a
nonphosphorylatable TSC2 mutant (S924A ⁄ T1518A)
altered the complex formation of TSC1 ⁄ TSC2 in Dro-
sophila cells. In addition, other studies have also
shown that, in mammalian cells, Akt-mediated phos-
phorylation of TSC2 had no effect on the TSC1 ⁄ TSC2
complex [11,21].
To date, few studies have examined the role of
TSC1 or TSC2 during IGF-1-induced skeletal muscle
hypertrophy. The present study aimed to test the
hypothesis that IGF-1 activation of mTOR in C2C12
myotubes requires an altered distribution of the
TSC1 ⁄ TSC2 complex within the cell. We found that
IGF-1 treatment does not affect the complex forma-
tion between TSC1 and TSC2, but rather IGF-1
induces an altered distribution of the TSC1 ⁄ TSC2 pro-
tein complex from the membrane to the cytosolic frac-
tion in C2C12 myotubes. We suggest that this step is
likely critical for mTOR activation by dissociating the
interaction between GAP activity of the TSC1 ⁄ TSC2
complex and Rheb.
Results and Discussion
IGF-1-induced activation of mTOR signaling is
prevented by PI3K inhibitor wortmannin and
mTOR inhibitor rapamycin
In the present study, the C2C12 cell line from mouse
skeletal muscle was used as a model system because
this cell line has been widely used to investigate the
l
MINT-7712377: 14-3-3 beta (uniprotkb:Q9CQV8) physically interacts (MI:0914) with Tsc1
(uniprotkb:
Q9EP53) and Tsc2 (uniprotkb:Q61037)bypull down (MI:0096)
l
MINT-7712483: Tsc1 (uniprotkb:Q9EP53) and Tsc2 (uniprotkb:Q61037) colocalize (MI:0403)
by cosedimentation through density gradient (
MI:0029)
l
MINT-7712436: TSC2 (uniprotkb:P49815) physically interacts (MI:0915) with TSC1
(uniprotkb:
Q92574)byanti bait coimmunoprecipitation (MI:0006)
l
MINT-7712451: Tsc1 (uniprotkb:Q9EP53), Rheb (uniprotkb:Q921J2) and Tsc2 (uniprotkb:
Q61037) colocalize (MI:0403)bycosedimentation through density gradient (MI:0029)
M. Miyazaki et al. TSC1 ⁄ TSC2 distribution with IGF-1 stimulation
FEBS Journal 277 (2010) 2180–2191 ª 2010 The Authors Journal compilation ª 2010 FEBS 2181
signaling pathways involved in IGF-1 hypertrophic
stimulation [6]. Previous studies have demonstrated
that IGF-1-induced muscle cell growth is mediated by
the PI3K ⁄ Akt ⁄ mTOR-dependent signaling pathway
[5,6]. To confirm these earlier reports, we examined the
phosphorylation states of five different targets of
PI3K ⁄ Akt ⁄ mTOR signaling after IGF-1 stimulation in
C2C12 myotubes. As shown in Fig. 1A, each of the
PI3K ⁄ Akt ⁄ mTOR targets was phosphorylated upon
IGF-1 stimulation. The PI3K inhibitor wortmannin
blocked phosphorylation of each PI3K ⁄ Akt ⁄ mTOR
target, which included Akt (T308 and S473), S6K1
(T389 and T421 ⁄ S424), IRS-1 (S636 ⁄ 639), PRAS40
(T246) and GSK3-a ⁄ b (S21 ⁄ 9). A relatively high con-
centration of wortmannin (10 lm) was required to
inhibit insulin-induced activation of mTOR signaling
in C2C12 myotubes (Fig. S1A) so we cannot rule out
the possibility of the inhibition of other lipid or pro-
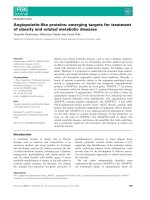
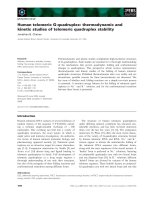
Fig. 1. IGF-1 induced activation of mTOR signaling is prevented by PI3K inhibitor wortmannin and mTOR inhibitor rapamycin. C2C12 myotubes
at 4 days of differentiation were treated with serum ⁄ antibiotic-free DMEM for 120 min and then stimulated for 60 min with recombinant IGF-1
(100 ngÆmL
)1
in serum ⁄ antibiotic-free DMEM), co-incubated with ⁄ without wortmannin (10 lM) or rapamycin (50 nM). Series of the experiments
were repeated at least three times using a different passage of C2C12 myotubes. (A) Phosphorylation states of PI3K-dependent and mTOR-
dependent signaling pathway were determined using phosphospecific antibodies (Akt at T308 and S473 sites, S6K1 at T389 and T421 ⁄ S424
sites, IRS-1 at S636 ⁄ 639 sites, PRAS40 at the T246 site and GSK3-a ⁄ b at S21 ⁄ 9 sites). Each of the PI3K ⁄ Akt ⁄ mTOR targets was phosphory-
lated with IGF-1 stimulation. Co-incubation with the PI3K inhibitor wortmannin blocked all measured phosphorylation in the PI3K ⁄ Akt-dependent
pathway. Treatment with mTOR inhibitor rapamycin did not affect upstream Akt phosphorylation, nor branches of this pathway (PRAS40 and
GSK3), but did block the phosphorylation of downstream mTOR effectors, including S6K1 and IRS1. (B) Total lysates were immunoprecipitated
with either TSC1 or TSC2 antibody. Phosphorylation levels of both S939 and T1462 sites on TSC2 were increased in C2C12 myotubes with IGF-
1 stimulation, and were completely prevented by the PI3K inhibitor wortmannin but not by rapamycin. Co-immunoprecipitation assays showed
that IGF-1 stimulation or the inhibitor treatments (wortmannin or rapamycin) did not affect the physical association between TSC1 and TSC2.
GAPDH was used as a loading control among the experimental conditions. (C) Total lysates were immunoprecipitated with each phosphospeci-
fic antibody (TSC2-S939 and TSC2-T1462). IGF-1 treatment resulted in TSC2 phosphorylation (S939 and T1462 residues) and a concomitant
increase in the relative amount of TSC1 that was co-immunoprecipitated with phosphorylated-TSC2.
TSC1 ⁄ TSC2 distribution with IGF-1 stimulation M. Miyazaki et al.
2182 FEBS Journal 277 (2010) 2180–2191 ª 2010 The Authors Journal compilation ª 2010 FEBS
tein kinases besides class-I PI3K. Treatment of the
IGF-1-stimulated cells with the mTOR inhibitor, rapa-
mycin (50 nm), blocked phosphorylation of S6K1 and
IRS-1, but not phosphorylation of upstream or inde-
pendent signaling molecules such as Akt, PRAS40 and
GSK3.
In addition to the PI3K⁄ Akt-dependent signaling,
IGF-1 also activates the Ras-Raf-mitogen-activated
protein kinase kinase (MEK) ⁄ extracellular signal-regu-
lated kinase (ERK) pathway [22,23]. Recent studies
have reported that a MEK ⁄ ERK-dependent pathway
may contribute to cell growth and tumor progression
by modulating mTOR signaling [24,25]. To determine
whether or not this pathway was operative in muscle
cells, the effects of IGF-1 stimulation on the
MEK ⁄ ERK-dependent signaling cascade were exam-
ined in C2C12 myotubes. IGF-1-induced ERK1 ⁄ 2
phosphorylation was detected rapidly and was tran-
sient; phosphorylation of ERK1 ⁄ 2 was induced within
10 min and phosphorylation was back to basal levels
by 60 min, unlike phosphorylation of Akt and S6K1,
after IGF-1 stimulation (Fig. S1B). The rapid phos-
phorylation of ERK1 ⁄ 2 was completely prevented by
the MEK inhibitor U0126 (10 lm). By contrast, there
were no inhibitory effects of U0126 treatment on IGF-
1-induced phosphorylation of either Akt or S6K1
(Fig. S1C). These results support the hypothesis that
IGF-1-induced activation of mTOR signaling is medi-
ated by the PI3K ⁄ Akt-dependent signaling pathway in
skeletal muscle cells.
IGF-1 induced TSC2 phosphorylation and
subcellular localization of TSC1
⁄
TSC2 are
modulated by a PI3K
⁄
Akt-dependent mechanism
Previous studies have demonstrated that mTOR activity
is modulated via Akt-dependent phosphorylation of the
TSC1 ⁄ TSC2 protein complex [10,11,19], although
the precise molecular mechanism remains undefined.
We examined the protein complex formation of TSC1
and TSC2 as well as the TSC2 phosphorylation status
after IGF-1 stimulation. It was previously demonstrated
that the two conserved phosphorylation sites on TSC2,
S939 and T1462, are directly phosphorylated by Akt
[21]. As shown in Fig. 1B, both the S939 and T1462
sites on TSC2 were phosphorylated in C2C12 myotubes
after IGF-1 stimulation. IGF-1-induced phosphory-
lation of TSC2 was blocked by treatment with wort-
mannin, the PI3K inhibitor, but no effect was observed
using rapamycin, the mTOR inhibitor. Furthermore,
co-immunoprecipitation with either TSC1 or TSC2
revealed that IGF-1 stimulation or inhibitor treatment
did not alter the complex formation between TSC1 and
TSC2, or the amount of either TSC1 or TSC2 protein
levels (Fig. 1B). This finding is contrary to previous
studies reporting that phosphorylation of TSC2 caused
a dissociation of the TSC1 ⁄ TSC2 protein complex and
ubiquitin-mediated degradation of TSC2 protein
[9,10,25,26]. One possible explanation for the difference
between the results obtained in the present study and
those from other studies is that, because the levels of
phosphorylated to total TSC2 are so low, we might
have been unable to detect a selective loss of the phos-
phorylated TSC2 from the TSC1 ⁄ TSC2 protein com-
plex. In C2C12 myotubes, however, we found no effect
of IGF-1 stimulation on the functional interaction
between TSC1 and TSC2, even though the phosphory-
lation level of TSC2 was altered. The stability of the
protein complex between TSC1 and phosphorylated
TSC2 was confirmed by co-immunoprecipitation experi-
ments with each phosphospecific antibody toward
TSC2. IGF-1 treatment resulted in TSC2 phosphoryla-
tion (S939 and T1462 residues) and a concomitant
increase in the relative amount of total TSC1 that was
bound to phosphorylated TSC2 protein (Fig. 1C). The
failure to detect a change in the stability of the
TSC1 ⁄ TSC2 complex was not specific to muscle cells
because complex formation between TSC1 and TSC2
was not changed in response to IGF-1 treatment in
human embryonic kidney 293 cells (Fig. S2). These
observations suggest that the stability of the complex
between TSC1 and TSC2 is not a critical factor in deter-
mining the function of the TSC1 ⁄ TSC2 protein complex
in response to IGF-1 treatment.
To investigate the subcellular localization profile of
TSC1 and TSC2 in C2C12 myotubes, the C2C12
lysates were fractionated to yield the membrane and
the cytosolic fractions using ultracentrifugation tech-
niques. A previous study by Cai et al. (2006) [19] dem-
onstrated that phosphorylation of TSC2 by Akt
caused the translocation of TSC2 protein from the
membrane to the cytosolic fraction. On the basis of
these findings, we examined whether or not IGF-1
stimulation caused a redistribution of TSC1 and ⁄ or
TSC2 from the membrane to the cytosol in skeletal
muscle cells. Under control conditions, TSC1 and
TSC2 proteins were detected in both membrane and
cytosolic fractions (Fig. 2A). After 1 h of stimulation
with IGF-1, there was an increase in the relative
amounts of both TSC1 and TSC2 proteins in the cyto-
solic fraction, which was associated with a concomi-
tant decrease in the relative abundance of TSC1 and
TSC2 proteins in the membrane fraction; compared to
control, IGF-1 stimulation decreased membrane TSC1
and TSC2 by 36% and 51%, respectively, whereas
cytosolic TSC1 and TSC2 increased by 57% and 63%,
M. Miyazaki et al. TSC1 ⁄ TSC2 distribution with IGF-1 stimulation
FEBS Journal 277 (2010) 2180–2191 ª 2010 The Authors Journal compilation ª 2010 FEBS 2183
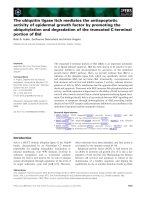
Fig. 2. IGF-1 induced subcellular distributions of TSC1 and TSC2 in the membrane versus the cytosolic fraction. C2C12 myotubes at 4 days
of differentiation (60 mm culture dishes) were treated with serum ⁄ antibiotic-free DMEM for 120 min and then stimulated for 60 min with
recombinant IGF-1 (100 ngÆmL
)1
in serum ⁄ antibiotic-free DMEM), co-incubated with ⁄ without wortmannin (10 lM) or rapamycin (50 nM). (A)
Cleared protein lysates were fractionated by ultracentrifugation at 300 000 g for 30 min at 4 °C. The pellet sample (membrane fraction) was
directly resuspended in 200 lLof1· SDS ⁄ PAGE sample buffer. Protein samples of the supernatant (cytosolic fraction) were concentrated
by acetone precipitation and then resuspended in SDS ⁄ PAGE sample buffer at a concentration of 1.0 lgÆlL
)1
. Ten microliters of each frac-
tionated sample was loaded onto the gel. Pan-cadherin antibody was used for the membrane fraction control, and S6K1 was used as cyto-
solic fraction control. (B–D) Distributions of TSC1 and TSC2 proteins in the membrane fraction and the cytosolic fraction. Alterations in the
relative amounts of both TSC1 and TSC2 proteins were quantified as a percentage of control for each fraction using
IMAGEJ software
(National Institutes of Health, Bethesda MD, USA) (n = 4 plates per condition). Each value is the mean ± SE. *Significant difference versus
control group (P < 0.05); #significant difference versus wortmannin group (P < 0.05). The relative amounts of both TSC1 and TSC2 proteins
in the membrane fraction were significantly decreased (36% and 51% decreases) (B, D), whereas they were significantly increased in the
cytosolic TSC1 and TSC2 (57% and 63% increases) (C, E) with IGF-1 stimulation. IGF-1-induced redistribution of TSC1 ⁄ TSC2 complex was
completely prevented by PI3K inhibitor wortmannin, but was not by mTOR inhibitor rapamycin. (F) Protein samples of the supernatant after
ultracentrifugation (cytosolic fraction) were immunoprecipitated with either TSC1 or TSC2 antibody. Co-immunoprecipitation assays revealed
that there is more TSC1 ⁄ TSC2 protein complex within the cytosolic fraction after IGF-1 stimulation.
TSC1 ⁄ TSC2 distribution with IGF-1 stimulation M. Miyazaki et al.
2184 FEBS Journal 277 (2010) 2180–2191 ª 2010 The Authors Journal compilation ª 2010 FEBS
respectively (Fig. 2B–E). This IGF-1-induced alteration
of the subcellular distribution of TSC1 and TSC2 was
completely blocked by wortmannin but not by rapa-
mycin treatment (Fig. 2B–E). The redistribution of the
TSC1 ⁄ TSC2 protein complex to the cytosol was con-
firmed by co-immunoprecipitation experiments with
either TSC1 or TSC2, which revealed more
TSC1 ⁄ TSC2 protein complex within the cytosolic frac-
tion after IGF-1 stimulation (Fig. 2F). The alteration
of the distribution of TSC1 and TSC2 proteins was
detected within 10 min of IGF-1 stimulation, which is
consistent with the time scale of Akt and S6K1 phos-
phorylation (Fig. 3). These findings suggest that IGF-1
treatment leads to a change in the distribution of the
TSC1 ⁄ TSC2 protein complex from the membrane to
the cytosol that is mediated by a PI3K ⁄ Akt-dependent
phosphorylation of TSC2. The localization of the
downstream target of TSC2, the small G-protein Rheb,
was unaffected by IGF-1 stimulation, remaining local-
ized to the membrane fraction (Fig. 2A). One implica-
tion of these results is that mTOR activity is increased
as the TSC1 ⁄ TSC2 protein complex moves away from
the membrane fraction. In support of this idea, it has
been shown that the phosphorylation state of TSC2
does not affect its GAP activity towards recombinant
Rheb [21,27]. Huang and Manning [21] have indicated
that phosphorylation status of TSC2 on S939 and
T1462 was significantly changed with serum starvation
or growth factor stimulation, although they could not
detect any differences in its GAP activity toward G-
protein Rheb. Cai et al. [19] also reported that the
TSC2 mutant lacking Akt-dependent phosphorylation
sites (S939A and S981A) maintains the same level of
GAP activity toward Rheb compared to the wild-type
TSC2, even after insulin treatment. Collectively, our
findings support a mechanism whereby TSC2 phos-
phorylation leads to its translocation from the mem-
brane to the cytosol and it is this physical separation,
and not changes in GAP activity, that results in the
increased GTP-bound active form of Rheb and higher
mTOR activity. It is interesting to note, however, that
the amount of TSC1 and TSC2 in the membrane frac-
tion is still quite high after IGF-1 stimulation (Fig. 2).
Further studies will be necessary to determine whether
or not the remaining TSC1 ⁄ TSC2 protein complex in
the membrane fraction does act as a GAP for Rheb.
The phosphorylation-dependent 14-3-3
interaction is associated with an increased
cytosolic pool of TSC1
⁄
TSC2
Prior studies have reported that the 14-3-3 protein can
directly bind to phosphorylated TSC2 and modulate
its subcellular localization [19,28–31]. In C2C12 myo-
tubes, 14-3-3 protein is almost exclusively localized in
the cytosol, suggesting that a similar mechanism may
underlie the change in distribution of TSC2 with
IGF-1 stimulation (Fig. 2). To test this idea, we per-
formed co-immunoprecipitation assays to determine
whether or not 14-3-3 and TSC2 interact in C2C12
myotubes and, if so, whether this interaction changes
upon IGF-1 stimulation. As shown in Fig. 4, IGF-1
treatment resulted in a 2.4-fold increase in the amount
of total-TSC2 that was bound to 14-3-3 protein. We
found that the phosphorylation level of TSC2 protein
at the S939 and T1462 sites, which was associated with
14-3-3 protein, was increased after IGF-1 stimulation.
Furthermore, the IGF-1-induced increase in 14-3-
3 ⁄ TSC2 interaction and the phosphorylation of TSC2
were blocked by wortmannin but not by rapamycin
(Fig. 4A). These findings suggest that the interaction
between 14-3-3 and TSC2 is a result of PI3K ⁄ Akt-
dependent phosphorylation.
According to motif scanning analysis (http://scansite.
mit.edu/), TSC2 contains three putative sites that are
both 14-3-3 recognition motifs and Akt phosphoryla-
tion sites (S939, S981 and S1130; Fig S3). To test the
idea that the S939 site in TSC2 is a phosphorylation-
dependent 14-3-3 binding site, we examined the ability
of a nonphosphorylatable form of TSC2 (S939A) to
interact with 14-3-3. As a control, we used a second
TSC2 mutant that eliminated a putative Akt phos-
phorylation site (T1462A) but did not harbor a 14-3-3
binding site. It was confirmed that both mutant forms
of TSC2 were not recognized by the phosphospecific
antibodies (data not shown). As shown in Fig. 5A, the
interaction between TSC2 mutant S939A and 14-3-3
was clearly decreased compared to wild-type TSC2. By
contrast, there was no change in the 14-3-3 interaction
with the T1462A TSC2 mutant from wild-type TSC2.
These results provide evidence indicating that the
phosphorylation of TSC2 at the S939 site comprises
the primary recognition motif of 14-3-3 protein
binding.
Having established the importance of the S939 site
in TSC2 for the phosphorylation-dependent 14-3-3
interaction, we next aimed to determine whether this
site had a role in the increased cytosolic pool of
TSC1 ⁄ TSC2 protein complex upon IGF-1 stimulation.
As shown in Fig. 5B, the protein abundance of myc-
tagged TSC1 and Flag-tagged TSC2 (wild-type) in the
cytosolic fraction was increased by IGF-1 stimulation.
The increased cytosolic pool of TSC2 required an
intact S939 phosphorylation site because alanine sub-
stitution completely eliminated the subcellular redistri-
bution of TSC2 to the cytosolic fraction with IGF-1
M. Miyazaki et al. TSC1 ⁄ TSC2 distribution with IGF-1 stimulation
FEBS Journal 277 (2010) 2180–2191 ª 2010 The Authors Journal compilation ª 2010 FEBS 2185
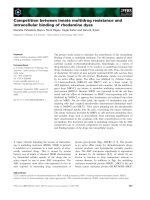
Fig. 3. Time course alterations in PI3K ⁄ Akt-dependent signaling with IGF-1 stimulation. C2C12 myotubes at 4 days of differentiation were
treated with serum ⁄ antibiotic-free DMEM for 120 min and then stimulated with recombinant IGF-1 (100 ngÆmL
)1
in serum ⁄ antibiotic-free
DMEM). Protein samples were collected at 10, 30 and 60 min after the initiation of IGF-1 stimulation. (A) Changes in phosphorylation states
of Akt (T308 and S473 sites) and S6K1 (T389 and T421 ⁄ S424 sites) were determined. (B) Subcellular distributions of TSC1 ⁄ TSC2 proteins
were determined. Membrane and cytosolic protein samples were fractionated by ultracentrifugation. Pan-cadherin antibody was used for the
membrane fraction control and S6K1 was used as cytosolic fraction control. (C–F) Distributions of TSC1 and TSC2 proteins in the membrane
fraction and the cytosolic fraction. Alterations in the relative amounts of both TSC1 and TSC2 proteins were quantified as a percentage value
compared to the control group in each fraction using
IMAGEJ software (n = 3 plates per condition). Each value is the mean ± SE. *Significant
difference versus control group (P < 0.05). Phosphorylation of Akt and S6K1 was induced within 10 min, and was maintained for at least
60 min. Altered distributions of TSC1 and TSC2 proteins were also detected on the same time scale as the Akt and S6K1 phosphorylations.
The relative amounts of both TSC1 and TSC2 proteins in the membrane fraction were significantly decreased, whereas significant increases
were observed in cytosolic TSC1 and TSC2 over the time course after IGF-1 stimulation.
TSC1 ⁄ TSC2 distribution with IGF-1 stimulation M. Miyazaki et al.
2186 FEBS Journal 277 (2010) 2180–2191 ª 2010 The Authors Journal compilation ª 2010 FEBS
stimulation; cytosolic myc-TSC1 and wild-type Flag-
TSC2 increased by 51% and 44%, respectively, after
IGF-1 stimulation, whereas no change was detected
when the mutant Flag-TSC2 (S939A) was used
(Fig. 5B). These observations clearly show that Akt-
dependent phosphorylation and 14-3-3 protein binding
to the TSC2 at the S939 site are required for the
sequestration away from the membrane fraction in
C2C12 myotubes.
Summary
In the present study, we have shown in skeletal muscle
cells that (a) IGF-1 stimulation leads to Akt-dependent
phosphorylation of TSC2 on residue S939; (b) IGF-1
stimulation does not affect complex formation between
TSC1 and TSC2, but results in a redistribution of the
TSC1 ⁄ TSC2 protein complex from the membrane to the
cytosol; and (c) alteration of the subcellular distribution
of the TSC1 ⁄ TSC2 protein complex was mediated by
the phosphorylation-dependent binding of 14-3-3 pro-
teins to the TSC2 S939 site. Collectively, these findings
provide a plausible Akt-dependent mechanism by which
IGF-1 stimulates mTOR activity; Akt phosphorylation
of TSC2 on S939 promotes interaction with the 14-3-3
scaffold protein, which results in the translocation of the
TSC1 ⁄ TSC2 protein complex to the cytosol, thus limit-
ing TSC2:GAP activity toward Rheb. The results
reported in the present study comprise the first evidence
obtained in skeletal muscle cells demonstrating how
growth factor-induced PI3K ⁄ Akt activation regulates
mTOR activity by modulating the interaction between
TSC1 ⁄ TSC2 protein complex and Rheb.
Materials and methods
Materials
C2C12 mouse myoblasts and human embryonic kidney 293
cells were purchased from ATCC (Manassas, VA, USA).
High-glucose DMEM, fetal bovine serum and horse serum
were obtained from Gibco (Grand Island, NY, USA).
FuGENE 6 Transfection Reagent was obtained from
Roche (Indianapolis, IN, USA). Immobilized protein A
plus was obtained from Pierce (Rockford, IL, USA). Long
R
3
IGF-1 (recombinant analog) and protease inhibitor
cocktail for mammalian tissues (P8340) were obtained from
Sigma-Aldrich (St Louis, MO, USA). Wortmannin and
rapamycin were obtained from Calbiochem (San Diego,
CA, USA). U0126 was obtained from LC Laboratories
(Woburn, MA, USA). Protein assay dye reagent concen-
trate was obtained from Bio-Rad Laboratories (Hercules,
CA, USA). Glutathione sepharose 4B, ECL and ECL plus
solutions were obtained from GE Healthcare (Piscataway,
NJ, USA).
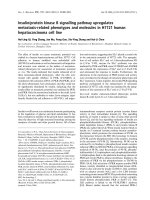
Fig. 4. TSC1 ⁄ TSC2 protein complex interacts with 14-3-3 proteins in
a phosphorylation-dependent manner with respect to TSC2. C2C12
myotubes at 4 days of differentiation were treated with serum ⁄ anti-
biotic-free DMEM for 120 min and then stimulated for 60 min with
recombinant IGF-1 (100 ngÆmL
)1
in serum ⁄ antibiotic-free DMEM),
co-incubated with ⁄ without wortmannin (10 l
M) or rapamycin
(50 n
M). (A) Total lysates were immunoprecipitated with pan-14-3-3
antibody. Immunoprotein complex with pan-14-3-3 antibody precipi-
tates both TSC1 and TSC2. (B) Levels of TSC2 bound to 14-3-3
proteins were quantified using
IMAGEJ software (n = 4 plates per con-
dition). Each value is the mean ± SE. *Significant difference versus
control group (P < 0.05); #significant difference versus wortmannin
group (P < 0.05). IGF-1 treatment resulted in a phosphorylation-
dependent increase (2.4-fold) in the amount of total-TSC2 that was
bound to 14-3-3 protein. TSC2 phosphorylation and an increased
interaction between TSC2 and 14-3-3 were prevented by wortman-
nin but not by rapamycin.
M. Miyazaki et al. TSC1 ⁄ TSC2 distribution with IGF-1 stimulation
FEBS Journal 277 (2010) 2180–2191 ª 2010 The Authors Journal compilation ª 2010 FEBS 2187
Antibodies
Phospho-S6K1 (T389), phospho-S6K1 (T421 ⁄ S424), Akt,
phospho-Akt (T308), phospho-Akt (Ser473), IRS, phospho-
IRS (S636 ⁄ S639), PRAS40, phospho-PRAS40 (T246),
phospho-GSK3a ⁄ b (S21 ⁄ 9), TSC1, phospho-TSC2 (S939),
phospho-TSC2 (T1462), phospho-ERK1 ⁄ 2 (T202 ⁄ T204),
ERK1 ⁄ 2 and Rheb were all obtained from Cell Signaling
Technology (Danvers, MA, USA). GSK3b was obtained
from BD Transduction Laboratories (San Jose, CA, USA).
Tuberin (C-20) and S6K1 (C-18) were obtained from Santa
Cruz Biotechnology (Santa Cruz, CA, USA). 14.3.3, Pan
Ab-4 (CG15) was obtained from Thermo Scientific (Fre-
mont, CA, USA). The ANTI-FLAG polyclonal antibody
was obtained from Sigma-Aldrich. Rabbit polyclonal to
myc tag and mouse monoclonal (CH-19) to pan-cadherin
were obtained from abcam (Cambridge, MA, USA). Gluta-
thione S-transferase (GST) antibody was obtained from
Bethyl Laboratories (Montgomery, TX, USA). Peroxidase
labeled rabbit IgG and mouse IgG secondary antibody
were obtained from Vector Laboratories (Burlingame, CA,
USA).
Plasmids
pcDNA3.1-myc-TSC1 (12133), pcDNA3-Flag-TSC2
(14129), pcDNA3-Flag-TSC2-S939A (14132), pcDNA3-
Flag-TSC2-T1462A (14130) and pGEX-2TK-14-3-3 beta
Fig. 5. Protein interaction between TSC2 and 14-3-3 protein is mediated by phosphorylation of TSC2 at the S939 site. C2C12 myoblasts
were transfected and then differentiated for 4 days. (A) In vitro GST-14-3-3 pull-down assay. Total cell lysates containing myc-TSC1 (wild-
type) and Flag-TSC2 (wild-type, S939A or T1462A) proteins were pulled-down with batch-purified GST-14-3-3-beta. Affinity-purified protein
complex with glutathione sepharose beads were then subjected to SDS ⁄ PAGE. The interaction between TSC2 mutant S939A and 14-3-3
was clearly decreased compared to wild-type TSC2 or mutant TSC2-T1462A. (B) A nonphosphorylatable mutant of TSC2 (S939A) showed no
increase in cytosolic relative adundance after IGF-1 stimulation. Cleared protein lysates were fractionated into the membrane and cytosolic
fractions by ultracentrifugation. Pan-cadherin antibody was used as the membrane fraction control, and S6K1 was used as the cytosolic frac-
tion control.
IMAGEJ software was used for quantification. Protein contents in IGF-1-stimulated sample were quantified as the relative amount
compared to the simultaneously transfected control (n = 4 per condition). Each value is the mean ± SE. Amounts of myc-tagged TSC1 and
Flag-tagged TSC2 (wild-type) in the cytosolic fraction were increased by IGF-1 stimulation compared to control. By contrast, no changes in
the cytosolic pool of myc-TSC1 and Flag-TSC2 (S939A) were observed after IGF-1 stimulation. No significant alterations were found with
respect to the distributions of myc-TSC1 or Flag-TSC2 in the membrane fraction.
TSC1 ⁄ TSC2 distribution with IGF-1 stimulation M. Miyazaki et al.
2188 FEBS Journal 277 (2010) 2180–2191 ª 2010 The Authors Journal compilation ª 2010 FEBS
GST (13276) were purchased from Addgene (Cambridge,
MA, USA).
Cell culture and transfection
All cell culture experiments were performed in a humidified
environment at 37 °Cin5%CO
2
. The skeletal muscle cell
line C2C12 myoblasts were grown in DMEM supplemented
with 10% fetal bovine serum and penicilin–streptomicin at
low confluence. Myoblasts were transfected when the cells
were in suspension [32]. To induce differentiation, culture
medium was switched to 2% horse serum when the cells
were fully confluent.
IGF-1 treatment
C2C12 myotubes at 4 days of differentiation were treated
with serum ⁄ antibiotic-free media for 120 min and then
stimulated for 60 min with recombinant IGF-1
(100 ngÆmL
)1
in serum ⁄ antibiotic-free DMEM), co-incu-
bated with ⁄ without wortmannin (10 lm), rapamycin
(50 nm) or U0126 (10 lm). Series of the experiments were
repeated at least three times using a different passage of
C2C12 myotubes.
Immunoprecipitation assay and western blotting
To study the functional interactions between TSC1, TSC2
and ⁄ or 14-3-3, co-immunoprecipitation assays were per-
formed as described previously [33]. Chaps-based buffer
[0.3% Chaps, 40 mm Hepes (pH 7.5), 120 mm NaCl,
1mm EDTA, 10 mm sodium pyrophosphate, 10 mm
b-glycerophosphate, 50 mm NaF and 10 lLÆmL
)1
protease
inhibitor cocktail] was used to produce total cell lysates.
One milligram of total protein was used from cell lysates
and samples were immunoprecipitated with each antibody
and immobilized protein A. Immunocomplexes were
washed three times with Chaps-based buffer and then
washed once with wash buffer [50 mm Hepes (pH 7.5),
40 mm NaCl and 2 mm EDTA]. Precipitated protein
samples were then subjected to SDS ⁄ PAGE. A western
blotting assay was carried out as described previously
[33].
Subcellular fractionation
The C2C12 myoblasts were plated in a cell culture dish
(diameter 60 mm) and then differentiated to myotubes for
4 days. C2C12 myotubes were washed twice with NaCl ⁄ P
i
and then scraped off in 3 mL of ice-cold buffer [20 mm Tri-
cine (pH 7.8), 250 mm sucrose, 1 mm EDTA (pH 8.0) and
10 lLÆmL
)1
protease inhibitor cocktail]. The samples were
homogenized 20 times using a dounce homogenizer, and then
centrifuged at 1000 g for 10 min at 4 °C. The supernatant
was then separated by ultracentrifugation at 300 000 g for
30 min at 4 °C. After ultracentrifugation, the supernatant
(cytosolic fraction) was removed and the pellet (membrane
fraction) was directly lysed in 200 lLof1· SDS ⁄ PAGE
sample buffer. The supernatant (cytosolic fraction) protein
sample was concentrated by acetone precipitation and then
resuspended in 1 · SDS ⁄ PAGE sample buffer at a concen-
tration of 1.0 lgÆlL
)1
. Ten microliters of each fractionated
sample was loaded onto the gel.
GST-14-3-3 pull-down assay
For the GST-14-3-3 binding experiments, the expression
and purification of GST fusion protein was performed in
accordance with the manufacturer’s instructions (GST
Gene Fusion System Handbook; Amersham Biosciences,
Piscataway, NJ, USA). C2C12 myotubes were washed
twice with NaCl ⁄ P
i
and then lysed in the buffer containing
20 mm Tris (pH 7.6), 150 mm NaCl, 1 mm EDTA, 1 mm
EGTA, 1% Triton-X, 1 mm b-glycerolphosphate, 1 mm
Na
3
VO
4
,1mm phenylmethanesulfonyl fluoride and prote-
ase inhibitor cocktail. Cleared myotube protein lysates
were mixed with the purified GST fusion protein bound to
sepharose beads and then incubated for 3 h at 4 °C. The
sepharose beads–protein complex was washed four times
with lysis buffer and then resuspended in SDS ⁄ PAGE
sample buffer.
Statistical analysis
All results are reported as the mean ± SE. Multi-group
comparisons were performed by one-way analysis of vari-
ance followed by Tukey’s post-hoc test. P < 0.05 was con-
sidered statistically significant for all comparisons.
Acknowledgements
This study was supported by grants provided from the
National Institutes of Health to K.A.E. (AR45617)
and a postdoctoral fellowship provided by the Ameri-
can Heart Association to M.M. (0825668D).
References
1 Kimball SR, Farrell PA & Jefferson LS (2002) Invited
review: role of insulin in translational control of protein
synthesis in skeletal muscle by amino acids or exercise.
J Appl Physiol 93, 1168–1180.
2 Miyazaki M & Esser KA (2009) Cellular mechanisms
regulating protein synthesis and skeletal muscle hyper-
trophy in animals. J Appl Physiol 106 , 1367–1373, doi:
91355.2008 [pii] 10.1152/japplphysiol.91355.2008.
3 Nader GA, McLoughlin TJ & Esser KA (2005) mTOR
function in skeletal muscle hypertrophy: increased ribo-
M. Miyazaki et al. TSC1 ⁄ TSC2 distribution with IGF-1 stimulation
FEBS Journal 277 (2010) 2180–2191 ª 2010 The Authors Journal compilation ª 2010 FEBS 2189
somal RNA via cell cycle regulators. Am J Physiol Cell
Physiol 289, C1457–C1465.
4 Hornberger TA, Stuppard R, Conley KE, Fedele MJ,
Fiorotto ML, Chin ER & Esser KA (2004) Mechanical
stimuli regulate rapamycin-sensitive signalling by a
phosphoinositide 3-kinase-, protein kinase B- and
growth factor-independent mechanism. Biochem J 380,
795–804.
5 Bodine SC, Stitt TN, Gonzalez M, Kline WO, Stover
GL, Bauerlein R, Zlotchenko E, Scrimgeour A,
Lawrence JC, Glass DJ et al. (2001) Akt ⁄ mTOR
pathway is a crucial regulator of skeletal muscle
hypertrophy and can prevent muscle atrophy in vivo.
Nat Cell Biol 3, 1014–1019.
6 Rommel C, Bodine SC, Clarke BA, Rossman R, Nunez
L, Stitt TN, Yancopoulos GD & Glass DJ (2001) Medi-
ation of IGF-1-induced skeletal myotube hypertrophy
by PI(3)K ⁄ Akt ⁄ mTOR and PI(3)K ⁄ Akt ⁄ GSK3 path-
ways. Nat Cell Biol 3, 1009–1013.
7 Jacinto E & Hall MN (2003) Tor signalling in bugs,
brain and brawn. Nat Rev Mol Cell Biol 4 , 117–126.
8 Frost RA & Lang CH (2007) Protein kinase B ⁄ Akt:
a nexus of growth factor and cytokine signaling in
determining muscle mass. J Appl Physiol 103, 378–387.
9 Potter CJ, Pedraza LG & Xu T (2002) Akt regulates
growth by directly phosphorylating Tsc2. Nat Cell Biol
4, 658–665.
10 Inoki K, Li Y, Zhu T, Wu J & Guan KL (2002) TSC2
is phosphorylated and inhibited by Akt and suppresses
mTOR signalling. Nat Cell Biol 4, 648–657.
11 Manning BD, Tee AR, Logsdon MN, Blenis J &
Cantley LC (2002) Identification of the tuberous sclero-
sis complex-2 tumor suppressor gene product tuberin as
a target of the phosphoinositide 3-kinase ⁄ akt pathway.
Mol Cell 10, 151–162.
12 Dan HC, Sun M, Yang L, Feldman RI, Sui XM, Ou
CC, Nellist M, Yeung RS, Halley DJ, Nicosia SV et al.
(2002) Phosphatidylinositol 3-kinase ⁄ Akt pathway regu-
lates tuberous sclerosis tumor suppressor complex by
phosphorylation of tuberin. J Biol Chem 277, 35364–
35370, doi: 10.1074/jbc.M205838200 [doi] M205838200
[pii].
13 Garami A, Zwartkruis FJ, Nobukuni T, Joaquin M,
Roccio M, Stocker H, Kozma SC, Hafen E, Bos JL &
Thomas G (2003) Insulin activation of Rheb, a media-
tor of mTOR ⁄ S6K ⁄ 4E-BP signaling, is inhibited by
TSC1 and 2. Mol Cell 11, 1457–1466.
14 Inoki K, Zhu T & Guan KL (2003) TSC2 mediates cel-
lular energy response to control cell growth and sur-
vival. Cell 115, 577–590.
15 Inoki K, Li Y, Xu T & Guan KL (2003) Rheb GTPase
is a direct target of TSC2 GAP activity and regulates
mTOR signaling. Genes Dev 17, 1829–1834.
16 Tee AR, Manning BD, Roux PP, Cantley LC & Blenis
J (2003) Tuberous sclerosis complex gene products,
Tuberin and Hamartin, control mTOR signaling by act-
ing as a GTPase-activating protein complex toward
Rheb. Curr Biol 13, 1259–1268.
17 Gao X, Zhang Y, Arrazola P, Hino O, Kobayashi T,
Yeung RS, Ru B & Pan D (2002) Tsc tumour suppres-
sor proteins antagonize amino-acid-TOR signalling. Nat
Cell Biol 4, 699–704.
18 Goncharova EA, Goncharov DA, Eszterhas A, Hunter
DS, Glassberg MK, Yeung RS, Walker CL, Noonan D,
Kwiatkowski DJ, Chou MM et al. (2002) Tuberin regu-
lates p70 S6 kinase activation and ribosomal protein S6
phosphorylation. A role for the TSC2 tumor suppressor
gene in pulmonary lymphangioleiomyomatosis (LAM).
J Biol Chem 277, 30958–30967.
19 Cai SL, Tee AR, Short JD, Bergeron JM, Kim J, Shen
J, Guo R, Johnson CL, Kiguchi K & Walker CL (2006)
Activity of TSC2 is inhibited by AKT-mediated phos-
phorylation and membrane partitioning. J Cell Biol
173, 279–289.
20 Dong J & Pan D (2004) Tsc2 is not a critical target of
Akt during normal Drosophila development. Genes Dev
18, 2479–2484.
21 Huang J & Manning BD (2008) The TSC1-TSC2 com-
plex: a molecular switchboard controlling cell growth.
Biochem J 412, 179–190.
22 Cui QL & Almazan G (2007) IGF-I-induced oligoden-
drocyte progenitor proliferation requires PI3K ⁄ Akt,
MEK ⁄ ERK, and Src-like tyrosine kinases. J Neurochem
100, 1480–1493.
23 Bibollet-Bahena O & Almazan G (2009) IGF-1-stimu-
lated protein synthesis in oligodendrocyte progenitors
requires PI3K ⁄ mTOR ⁄ Akt and MEK ⁄ ERK pathways.
J Neurochem 109, 1440–1451.
24 Ma L, Teruya-Feldstein J, Bonner P, Bernardi R, Franz
DN, Witte D, Cordon-Cardo C & Pandolfi PP (2007)
Identification of S664 TSC2 phosphorylation as a mar-
ker for extracellular signal-regulated kinase mediated
mTOR activation in tuberous sclerosis and human can-
cer. Cancer Res 67, 7106–7112.
25 Ma L, Chen Z, Erdjument-Bromage H, Tempst P &
Pandolfi PP (2005) Phosphorylation and functional
inactivation of TSC2 by Erk implications for tuberous
sclerosis and cancer pathogenesis. Cell 121, 179–
193.
26 Chong-Kopera H, Inoki K, Li Y, Zhu T, Garcia-Gonz-
alo FR, Rosa JL & Guan KL (2006) TSC1 stabilizes
TSC2 by inhibiting the interaction between TSC2 and
the HERC1 ubiquitin ligase. J Biol Chem 281, 8313–
8316.
27 Huang J & Manning BD (2009) A complex interplay
between Akt, TSC2 and the two mTOR complexes. Bio-
chem Soc Trans 37, 217–222.
28 Li Y, Inoki K, Vacratsis P & Guan KL (2003) The
p38 and MK2 kinase cascade phosphorylates tuberin,
the tuberous sclerosis 2 gene product, and enhances
TSC1 ⁄ TSC2 distribution with IGF-1 stimulation M. Miyazaki et al.
2190 FEBS Journal 277 (2010) 2180–2191 ª 2010 The Authors Journal compilation ª 2010 FEBS
its interaction with 14-3-3. J Biol Chem 278, 13663–
13671.
29 Liu MY, Cai S, Espejo A, Bedford MT & Walker CL
(2002) 14-3-3 interacts with the tumor suppressor tuber-
in at Akt phosphorylation site(s). Cancer Res 62, 6475–
6480.
30 Nellist M, Goedbloed MA, de Winter C, Verhaaf B,
Jankie A, Reuser AJ, van den Ouweland AM, van der
Sluijs P & Halley DJ (2002) Identification and charac-
terization of the interaction between tuberin and 14-3-
3zeta. J Biol Chem 277, 39417–39424.
31 Shumway SD, Li Y & Xiong Y (2003) 14-3-3beta binds
to and negatively regulates the tuberous sclerosis com-
plex 2 (TSC2) tumor suppressor gene product, tuberin.
J Biol Chem 278, 2089–2092.
32 Escobedo J & Koh TJ (2003) Improved transfection
technique for adherent cells using a commercial lipid
reagent. BioTechniques 35, 936–938.
33 Miyazaki M & Esser KA (2009) REDD2 is enriched in
skeletal muscle and inhibits mTOR signaling in
response to leucine and stretch. Am J Physiol Cell Phys-
iol 296, C583–C592.
Supporting information
The following supplementary material is available:
Fig. S1. Effects of inhibitor treatment (wortmannin
and U0126) on insulin ⁄ IGF-1-induced phosphorylation
of PI3K ⁄ Akt ⁄ mTOR-dependent signaling in C2C12
myotubes.
Fig. S2. Complex formation of TSC1 and TSC2 pro-
teins in non-muscle cells.
Fig. S3. Putative Akt phosphorylaton ⁄ 14-3-3 recogni-
tion motif in human TSC2 polypeptide.
This supplementary material can be found in the
online version of this article.
Please note: As a service to our authors and readers,
this journal provides supporting information supplied
by the authors. Such materials are peer-reviewed and
may be re-organized for online delivery, but are not
copy-edited or typeset. Technical support issues arising
from supporting information (other than missing files)
should be addressed to the authors.
M. Miyazaki et al. TSC1 ⁄ TSC2 distribution with IGF-1 stimulation
FEBS Journal 277 (2010) 2180–2191 ª 2010 The Authors Journal compilation ª 2010 FEBS 2191