Báo cáo khoa học: Protein tandem repeats – the more perfect, the less structured pptx
Bạn đang xem bản rút gọn của tài liệu. Xem và tải ngay bản đầy đủ của tài liệu tại đây (403.54 KB, 10 trang )
Protein tandem repeats – the more perfect, the less
structured
Julien Jorda
1
, Bin Xue
2,3
, Vladimir N. Uversky
2,3,4,5
and Andrey V. Kajava
1
1 Centre de Recherches de Biochimie Macromole
´
culaire, CNRS UMR-5237, University of Montpellier 1 and 2, France
2 Center for Computational Biology and Bioinformatics, Indiana University School of Medicine, Indianapolis, IN, USA
3 Institute for Intrinsically Disordered Protein Research, Indiana University School of Medicine, Indianapolis, IN, USA
4 Institute for Biological Instrumentation, Russian Academy of Sciences, Pushchino, Moscow Region, Russia
5 Department of Biochemistry and Molecular Biology, Indiana University School of Medicine, Indianapolis, IN, USA
Introduction
Genome sequencing projects are producing knowledge
about a large number of protein sequences. Under-
standing the biological role of many of these proteins
requires information about their 3D structure as well
as their evolutionary and functional relationships. At
least 14% of all proteins and more than one-third of
human proteins carrying out fundamental functions
contain arrays of tandem repeats (TRs) [1]. The 3D
structures of many of these proteins have already been
determined by X-ray crystallography and NMR
methods. Fibrous proteins with repeats of two to seven
residues (collagen, silk fibroin, keratin, and tropomyo-
sin) were the first objects studied by structural biology
methods [2]. Proteins with repeat lengths from 5 to 50
residues gained special interest in the 1990s, when sev-
eral unusual structural folds, including b-helices [3],
b-rolls [4], the horseshoe-shaped structure of leucine-
rich-repeat proteins [5], b-propellers [6], and a-helical
solenoids [7], were resolved by X-ray crystallography.
Many proteins with repeats longer than 30 residues
have a ‘beads-on-a-string’ organization, with each
repeat being folded into a globular domain, e.g. zinc
Keywords
bioinformatics; disordered conformation;
evolution; protein structure; sequence
analysis
Correspondence
A. V. Kajava, Centre de Recherches de
Biochimie Macromole
´
culaire, CNRS, 1919
Route de Mende, 34293 Montpellier,
Cedex 5, France
Fax: +33 4 67 521559
Tel: +33 4 67 61 3364
E-mail:
(Received 23 February 2010, revised 7 April
2010, accepted 12 April 2010)
doi:10.1111/j.1742-4658.2010.07684.x
We analysed the structural properties of protein regions containing arrays
of perfect and nearly perfect tandem repeats. Naturally occurring proteins
with perfect repeats are practically absent among the proteins with known
3D structures. The great majority of such regions in the Protein Data Bank
are found in the proteins designed de novo. The abundance of natural
structured proteins with tandem repeats is inversely correlated with the
repeat perfection: the chance of finding natural structured proteins in the
Protein Data Bank increases with a decrease in the level of repeat perfec-
tion. Prediction of intrinsic disorder within the tandem repeats in the Swiss-
Prot proteins supports the conclusion that the level of repeat perfection
correlates with their tendency to be unstructured. This correlation is valid
across the various species and subcellular localizations, although the level
of disordered tandem repeats varies significantly between these datasets.
On average, in prokaryotes, tandem repeats of cytoplasmic proteins were
predicted to be the most structured, whereas in eukaryotes, the most struc-
tured portion of the repeats was found in the membrane proteins. Our
study supports the hypothesis that, in general, the repeat perfection is a
sign of recent evolutionary events rather than of exceptional structural and
(or) functional importance of the repeat residues.
Abbreviations
IDP, intrinsically disordered protein; IDR, intrinsically disordered region; PDB, Protein Data Bank; SCA, spinocerebellar ataxia;
TR, tandem repeat.
FEBS Journal 277 (2010) 2673–2682 ª 2010 The Authors Journal compilation ª 2010 FEBS 2673
finger domains [8], immunoglobulin domains [9], and
human matrix metalloproteinase [10]. It was noticed
that, frequently, proteins with repeats do not have
unique, stable 3D structures [11]. Rough estimates pro-
pose that half of the regions with TRs may be naturally
unfolded [12,13]. Low-complexity regions of eukaryotic
proteins that are enriched in repetitive motifs are rare
among the known 3D structures from the Protein Data
Bank (PDB) [14]. The common structural features,
functions and evolution of proteins with TRs have
been summarized in several reviews [7,11,15–18].
Perfect TRs occupy a special place among protein
repeats, which are usually imperfect because of muta-
tions (substitutions, insertions, and deletions) that have
accumulated during evolution. The high level of perfec-
tion of repeats can indicate substantial structural and
functional importance for each residue in the repeat, as
was observed in collagen molecules and some b-roll
structures [2,19]. It can also indicate recent evolution-
ary events that, for example, in pathogens can allow a
rapid response to environmental changes and can thus
lead to emerging infection threats, and in higher organ-
isms can lead to rapid morphological effects [20].
Perfect and nearly perfect repeats occur in a signifi-
cant portion of proteins. Recently, by using a newly
developed algorithm for ab initio identification of TRs,
we detected this type of repeat in 9% of proteins in
the SwissProt database [21]. To estimate the level of
perfection of the TRs, we used a parameter called P
sim
,
which is based on the calculation of Hamming dis-
tances between the consensus sequence and aligned
repeats of the TR (see Experimental procedures). In
this work, we analysed perfect and nearly perfect TRs
with P
sim
‡ 0.7.
Specific structural and evolutionary properties of the
perfect repeats pose challenges for the annotation of
genomic data. First, unlike with the aperiodic globular
proteins, prediction of structure–function relationships
by sequence similarity cannot be directly applied to the
perfect or nearly perfect repeats, owing to their
different evolutionary mechanisms. Second, although
ab initio structural prediction for proteins with TRs
generally yields reliable results [11], the very high fidel-
ity of sequence periodicity decreases the accuracy and
reliability of the information obtained from the
sequence alignment of the repeats. Each position of
the perfect repeats is conserved, and this makes it diffi-
cult to distinguish between residues that form the inte-
rior of the structure and those that face the solvent.
TRs are often found in proteins associated with
various human diseases. For example, expansion of
homorepeats is the molecular cause of at least
18 human neurological diseases, including myotonic
dystrophy 1, Huntington’s disease, Kennedy disease
(also known as spinal and bulbar muscular atrophy),
dentatorubral–pallidoluysian atrophy, and a number
of spinocerebellar ataxias (SCAs), such as SCA1,
SCA2, Machado–Joseph disease (SCA3), SCA6,
SCA7, and SCA17 [22,23]. A number of clinical disor-
ders, including prostate cancer, benign prostatic hyper-
plasia, male infertility, and rheumatoid arthritis, are
associated with polymorphisms in the length of the
polyglutamine and polyglycine repeats of the androgen
receptor [24].
Thus, proteins with perfect or nearly perfect TRs
play important functional roles, are abundant in
genomes, are related to major health threats, and, at
the same time, represent a challenge for in silico identi-
fication of their structures and functions. The objective
of this work was a systematic bioinformatics analysis
of arrays of perfect or nearly perfect TRs to obtain a
global view of their structural properties.
Results and Discussion
The 3D structures of naturally occurring proteins
with perfect repeats are practically absent in the
PDB
Our analysis shows that, among 20 800 sequences of
the nonredundant PDB (95% identity), only nine natu-
rally occurring proteins (0.04%) have perfect TRs with
P
sim
= 1 (Table 1). Furthermore, these arrays of TRs
are short (less than 19 residues), and they are missing
from the determined structures representing regions
with blurred electron density. A common reason for
missing electron density is that the unobserved atom,
side chain, residue or region fails to scatter X-rays
coherently, because of variation in position from one
protein to the next; for example, the unobserved atoms
can be flexible or disordered. Two proteins are excep-
tions to this: (a) an antibody molecule in which the
Table 1. Number of structured and unstructured regions found for
each range of P
sim
values in the PDB TR dataset. The following
tags were assigned to each analysed region with TRs: Sn and Sd,
fragments containing secondary structures from natural and
designed proteins, respectively; Ln and Ld, fragments connecting
secondary structures from natural and designed proteins, respec-
tively; Un and Ud, fragments whose structure was not determined
from natural and designed proteins, respectively.
P
sim
ranges Sn Ln Un Sd Ld Ud
P
sim
= 1.0 0 2 7 16 4 14
0.9 £ P
sim
< 1.0 1 2 8 20 2 5
0.8 £ P
sim
< 0.9 17 8 31 24 1 12
Structural state of perfect protein repeats J. Jorda et al.
2674 FEBS Journal 277 (2010) 2673–2682 ª 2010 The Authors Journal compilation ª 2010 FEBS
Gly-rich TR represents a crosslink between two
domains (PDB code: 1F3R) [25]; and (b) a substrate
with an (Arg-Ser)
8
tract that was cocrystallized with
protein kinase (PDB code: 3BEG) [26]. This Arg-rich
peptide, being alone in solution, will most probably be
unstructured, owing to the absence of nonpolar resi-
dues and the presence of eight Arg residues carrying a
charge of the same sign. Thus, this analysis suggested
that regions of natural proteins with perfect repeats
have a tendency to be unstructured.
To investigate this tendency, we analysed further the
regions with less perfect TRs. The TRs with
0.9 £ P
sim
< 1.0 are also rare among natural proteins
of the PDB. Furthermore, the conformations of almost
all of them have not been resolved by X-ray crystallog-
raphy, because they are located in regions with missing
electron density. Only one of them, human CD3-e ⁄ d
dimer (PDB: 1XIW) [27], has a short region of two
nine-residue repeats corresponding to a loop followed
by b-strand. We also analysed TRs with
0.8 £ P
sim
< 0.9, and found 17 TRs of natural pro-
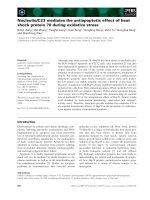
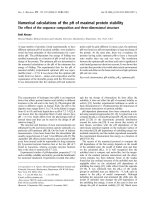
teins with the 3D structures (Table 1). In addition to
relatively short regions of fewer than 20 residues, cor-
responding to the a-helical elements, we also found
longer regions that form an immunoglobulin-like struc-
ture (1D2P) [28], a b-roll (1GO7) [29], an a-solenoid
(2AJA) [30], and an unusual long b-hairpin (1JHN)
[31] (Fig. 1). Three of these four structures are formed
by bacterial proteins.
De novo designed proteins with perfect repeats
fold into stable 3D structures
In the PDB, majority (80%) of the proteins with per-
fect TRs are proteins designed de novo (Table 1). The
TR of a large proportion of these proteins fold into
the well-defined repetitive 3D structures such as colla-
gen triple helices, a-helical coiled coils, and a-helical
solenoids [2,17]. The fact that the designed perfect TRs
can form the stable 3D structures indicates that the
absence of such structures in natural proteins results
from evolution and not from problems with their fold-
ing propensities per se.
Prediction of intrinsically disordered regions in
SwissProt supports the tendency of TRs to be
unfolded
The ability of TRs to be structured or disordered was
further tested by using a larger dataset extracted from
SwissProt. The analysed dataset of TRs from the
Protein Repeat DataBase ( />?r=repeatDB) was filled in by the t-reks program
[21]. The TRs with P
sim
values ranging from 0.7 to 1
consist of 51 685 repeats found in 33 151 proteins,
which represent 9.1% of all proteins in the SwissProt
release of January 2009 (364 403 sequences). The level
of intrinsic disorder in these repeats and repeat-
containing proteins was evaluated by using several
computational tools.
Compositional profiling
Intrinsically disordered proteins (IDPs) and intrinsi-
cally disordered regions (IDRs) are known to be differ-
ent from structured globular proteins and domains
with regard to many attributes, including amino acid
composition, sequence complexity, hydrophobicity,
charge, flexibility, and type and rate of amino acid
substitutions over evolutionary time. For example,
IDPs ⁄ IDRs are significantly depleted in a number of
so-called order-promoting residues, including bulky
hydrophobic (Ile, Leu, and Val) and aromatic (Trp,
Tyr, and Phe) residues, which would normally form
the hydrophobic core of a folded globular protein, and
also possess low contents of Cys and Asn residues. On
the other hand, IDPs ⁄ IDRs were shown to be sub-
stantially enriched in so-called disorder-promoting
residues: Ala, Arg, Gly, Gln, Ser, Pro, Glu, and Lys
[32–36]. These biases in the amino acid composition of
1GO7
1D2P
2AJA
1JHN
Fig. 1. The 3D structures of proteins with almost perfect TRs.
Repeat regions are shown in colour.
J. Jorda et al. Structural state of perfect protein repeats
FEBS Journal 277 (2010) 2673–2682 ª 2010 The Authors Journal compilation ª 2010 FEBS 2675
IDPs and IDRs can be visualized using a normaliza-
tion procedure known as compositional profiling
[32,33,37]. In brief, compositional profiling is based on
the evaluation of the (C
s1
) C
s2
) ⁄ C
s2
values, where C
s1
is the content of a given residue in a set of interest
(regions and proteins with TRs), and C
s2
is the corre-
sponding value for the reference dataset (set of ordered
proteins or set of well-characterized IDPs). Negative
values of the profiling correspond to residues that are
depleted in a given dataset in comparison with a refer-
ence dataset, and the positive values correspond to res-
idues that are overrepresented in the set of interest.
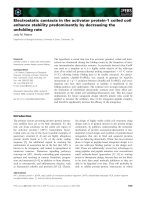
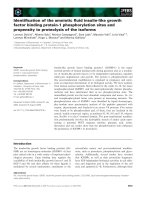
Figure 2 compares the amino acid compositions of
(a) all TRs analysed in this study, (b) proteins contain-
ing these TRs and (c) a dataset of IDPs with the com-
positions of ordered proteins. The datasets of IDPs
and fully structured proteins were taken from our pre-
vious analysis [38,39]. This shows that the composi-
tions of proteins containing TRs and of TRs
themselves are different from the compositions of
ordered proteins. They follow the trend for IDPs,
being generally depleted in major order-promoting res-
idues. This tendency for disorder is stronger for the
TRs, indicating that they contribute to this trend. At
the same time, the amino acid compositions of the
TRs have a bias when compared with the compositions
of ‘typical’ disordered proteins (Fig. 2). TRs have an
especially low occurrence of order-promoting Met and
the disorder-promoting charged residues Asp, Glu, and
Lys. On the other hand, TRs are highly enriched in
Cys and the disorder-promoting Pro, Gly, Ser, and
His.
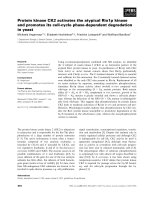
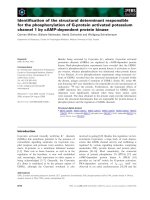
To test the tendency of TRs to be disordered as a
function of their level of perfection, the TRs were sub-
divided into four subsets according to their P
sim
values
[0.7 < P
sim
£ 0.8 (32691 TRs), 0.8 < P
sim
£ 0.9 (8322
TRs), 0.9 < P
sim
£ 1.0 (1471 TRs), and homorepeats
with P
sim
= 1.0 (5259 TRs). Homorepeats were analy-
sed separately from the other TRs, because they signif-
icantly outnumber the other types of repeats, and
having them in the same group would obscure the
effect related to the other repeats. The amino acid
compositions of these subsets were compared with the
compositions of fully structured proteins. Figure 3 rep-
resents the results of compositional profiling for TRs
with different level of perfection. Both homorepeats
and the other TRs show the same trend. With the
increase in the perfection of the repeated segment, the
amount of order-promoting residues is gradually
reduced, whereas the relative contents of disorder-
promoting polar residues are gradually increased.
1.0
1.5
TRs
Entire sequences
Typical IDPs
–0.5
0.0
0.5
WFY I MLVNCTAG DRHQSKP
(C
AA
Dataset
–C
AA
Struct
)/C
AA
Struct
–1.0
E
Fig. 2. Compositional profiling of TRs, entire sequences of proteins
containing these TRs, and a set of fully disordered proteins from
DisProt in comparison with the composition of fully structured pro-
teins from the PDB. C
Struct
AA
is the content of a given amino acid in
the set of structured proteins; C
Dataset
AA
is the content of this amino
acid in the dataset of interest. Amino acids are arranged in order of
decreasing structure-promoting ability as suggested by the TopIDP
scale [37].
Nonpolar G Polar P
20
10
0
–10
–20
40
20
0
–20
–40
0.7–0.8
0.8–0.9
0.9–1
A
B
C
hr
–C
AA
struct
AA
C
tr
–C
AA
struct
AA
Fig. 3. (A) Differences in amino acid compositions between TRs,
subdivided into groups with different levels of repeat perfection
and fully structured proteins. The homorepeats are analysed sepa-
rately (B), owing to their unusually high occurrence in comparison
to the other TRs. For this purpose, a dataset of perfect and cryptic
homorepeats was created and subdivided into three groups
depending on the P
sim
values. C
tr
AA
and C
hr
AA
are the contents of a
given amino acid in the set of TRs (excluding homorepeats) and
only homorepeats, respectively. Amino acids are arranged in four
sets: order-promoting aromatic and aliphatic amino acids (Trp, Phe,
Tyr, Ile, Met, Leu, Val, and Ala) which are denoted as nonpolar;
order-neutral Gly, disorder-promoting polar residues (Asn, Cys, Thr,
Gln, Ser, Arg, Asp, His, Glu, and Lys) and disorder-promoting
nonpolar Pro.
Structural state of perfect protein repeats J. Jorda et al.
2676 FEBS Journal 277 (2010) 2673–2682 ª 2010 The Authors Journal compilation ª 2010 FEBS
The contents of Gly and Pro residues do not change
significantly.
Prediction of intrinsic disorder
As the compositional profiling showed that TRs and
repeat-containing proteins have a noticeable increase
in the number of disorder-promoting residues, we fur-
ther analysed the abundance of predicted intrinsic dis-
order in these sequences with several computational
tools, including the pondr
Ò
vlxt [34,40] and vsl2
[41,42] algorithms, as well as predictors such as iupred
[43,44], foldindex [45], and topidp [37]. The results of
this analysis are summarized in Table 2, which clearly
shows that both TRs and repeat-containing proteins
are highly disordered. Furthermore, TRs have higher
percentage of disordered residues than the entire
TR-containing sequences. Prediction of intrinsic disor-
der also confirmed an observation that the amounts of
disorder in both datasets increase with increases in the
repeat perfection (Table 2).
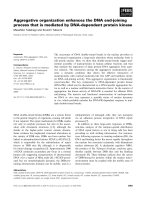
This observation is further illustrated by the distri-
butions of values representing the number of predicted
disorder residues divided by the number of residues in
the considered region (Fig. 4). These distributions are
generated for TR regions of different levels of perfec-
tion (Fig. 4A) and for the corresponding repeat-con-
taining proteins (Fig. 4B). Figure 4A shows that all
analysed TRs are highly disordered, irrespective of the
level of their perfection. At the same time, as the
perfection of TRs increases, the relative content of dis-
order also increases. For example, at least 70% of TRs
with 0.7 < P
sim
£ 0.8 are predicted to have disorder
ratios of more than 0.95. For TRs with 0.8 <
P
sim
£ 0.9, this percentage increases to 85%, for those
with 0.9 < P
sim
£1.0 it is 86%, and for perfect ho-
morepeats it reaches 97% (Fig. 4A). Figure 4B shows
that only 6% of the whole sequences of proteins con-
taining perfect repeats are well structured (disorder
ratio less than 0.2). The rest of these sequences have
widespread disorder ratios, ranging from 0.25 to 1.
Proteins containing the least perfect repeats
(0.7 < P
sim
£0.8), about 5%, are almost evenly distrib-
uted among the various disorder ratios. Thus, perfect
repeats preferentially occur in proteins that have disor-
der ratios of more than 0.2 and are poorly represented
in more structured proteins, whereas less perfect
repeats are equally probable in sequences with differ-
ent disorder ratios.
Intrinsic disorder of tandem repeats across
species and subcellular localizations
The pondr
Ò
vlxt predictor and TopIDP index were
used to establish variation of the disorder level among
TRs of viral, eukaryotic and prokaryotic proteins. The
tested dataset included TRs with P
sim
‡ 0.9 identified
in SwissProt. The homorepeats were excluded and
analysed separately from the other TRs, because their
predominant occurrence in eukaryotic proteins would
obscure the results. Prior to the analysis, the redun-
dancy of the dataset related to the existence of protein
sequences from different strains of the same species
(especially for bacteria and viruses) had been filtered
out by using the species name, consensus motif, and
number and location of repeats. As a result, the data-
set contained 245 repeats from prokaryotic proteins,
1059 repeats from eukaryotic proteins, and 70 repeats
Table 2. Analysis of intrinsic disorder distribution in TRs and TR-containing proteins.
P
sim
= 0.7–0.8 P
sim
= 0.8–0.9 P
sim
= 0.9–1 Homorepeats
TRs
Total no. 34 286 5519 1382 5259
Average length 25.5 41.0 59.1 13.8
Intrinsic disorder ratio (%):
VSL2 80.4 88.6 88.9 98.4
Intrinsic disorder ratio (%):
IUPRED 56.0 62.7 67.2 86.5
Intrinsic disorder ratio (%):
FOLDINDEX 62.4 68.6 70.3 79.9
Intrinsic disorder ratio (%):
TOPIDP 85.6 88.8 91.1 74.4
Sequences
a
Total no. 25 649 4915 1295 3663
Average length 643.4 752.0 840.2 790.4
Intrinsic disorder ratio (%):
VSL2 49.3 58.6 57.0 61.6
Intrinsic disorder ratio (%):
IUPRED 32.1 41.7 41.7 45.4
Intrinsic disorder ratio (%):
FOLDINDEX 46.6 52.3 52.3 52.7
Intrinsic disorder ratio (%):
TOPIDP 71.2 75.3 72.2 74.9
a
Whole proteins containing these TRs.
J. Jorda et al. Structural state of perfect protein repeats
FEBS Journal 277 (2010) 2673–2682 ª 2010 The Authors Journal compilation ª 2010 FEBS 2677
from viral proteins. Our analysis shows that TRs from
all species have a tendency to be unstructured
(Table 3). At the same time, TRs from eukaryotic pro-
teins have ratios of disordered proteins that are slightly
higher than those of TRs from viral or prokaryotic
proteins.
The ratio of disordered repeats was also investigated
as a function of the subcellular localization of corre-
sponding repeat-containing proteins. We performed
this analysis separately for homorepeats and the other
TRs of SwissProt with P
sim
‡ 0.8. The obtained distri-
butions among cellular compartments were similar in
these two datasets; therefore, Table 4 represents the
combined results for both types of repeat. The lowest
proportion of disordered repeats (54.3%) was found in
the cytoplasmic proteins of prokaryotes (Table 4). The
ratio increases from the cytoplasm to the cellular exte-
rior, being equal to 72.3% and 83.6% in membrane
and secreted proteins, respectively. A survey of amino
acid sequences of the bacterial cytoplasmic repeats
that were predicted to be structured revealed a large
number (90 TRs) of (GGM)
n
repeats. These repeats
are located at the C-terminal extremity of the GroEL
chaperone and play important roles in the refolding of
proteins [46]. In the crystal structure of the GroEL
complex, these C-terminal tails have blurred electron
density inside the complex chamber. This suggests
that, inside the GroEL complex, they are disordered.
Such repeats are also found in mitochondria of
eukaryotes in HSP60, a eukaryotic homolog of
GroEL. The cytoplasmic TRs of prokaryotes with
excluded GGM repeats still have the highest percent-
age of predicted structured regions among the cellular
compartments.
In eukaryotes, the ratio of disorder varies with cellu-
lar localization. The lowest level of TR disorder is
found in membrane proteins, followed by secreted and
nuclear proteins. The cytoplasmic TRs are the most
disordered in eukaryotes (82%). The high percentage
of ordered TRs in membrane proteins suggests that
they may form part of transmembrane regions. How-
ever, our analysis revealed that only 12% of them were
predicted to be within the transmembrane regions.
Conclusions
TRs of proteins with known 3D structures are generally
imperfect. They have consensus sequences with both
conserved and variable residues. Analysis of these 3D
structures reveals that each sequence repeat corre-
sponds to a repetitive structural unit and that their tan-
dem arrangement yields elongated regular structures
[11]. The conserved residues of repeats are frequently
located inside the structure, because they are important
for its stability, whereas variable residues are exposed
on the protein surface. This might lead one to expect
that all residues of highly perfect TRs would be con-
served, because of their important structural roles.
However, our present study shows that this rule does
A
B
Fig. 4. Length distribution of predicted disordered segments. (A)
Length distribution of predicted disorder for four groups of TRs. (B)
Length distribution of predicted disorder for whole protein
sequences containing the TRs in four groups.
Table 3. Variation in the disorder level among TRs of viral, eukary-
otic and prokaryotic proteins.
Prokaryotes (%) Viruses (%) Eukaryotes (%)
PONDR
Ò
VLXT
a
84 85.0 88.4
TopIDP
b
71.4 72.4 77.8
a
Protein regions with VLXT cumulative distribution function dis-
tances of less than 0 are identified as disordered. The P
sim
range
for this dataset is 0.9–1. Disorder level is estimated as percentage
of residues predicted to be disordered.
b
Protein regions with
TopIDP values of less than 0 are identified as disordered. The P
sim
range for this dataset is 0.9–1. The disorder level is estimated as
the percentage of TRs with negative TopIDP values.
Structural state of perfect protein repeats J. Jorda et al.
2678 FEBS Journal 277 (2010) 2673–2682 ª 2010 The Authors Journal compilation ª 2010 FEBS
not apply for perfect or almost perfect repeats. We
have shown that increasing repeat perfection correlates
with a stronger tendency to be unstructured. This result
is in agreement with the previous conclusion about a
strong association between homorepeats and unstruc-
tured regions [13]. Coding for protein disorder is more
permissive, and does not require exact sequence motifs,
in contrast to the coding for the 3D structures. It
allows higher variability in amino acid sequences.
Therefore, TR perfection cannot be explained by the
need to encode disordered conformations. The other
reason for high conservation of residues may be their
functional importance, such as the involvement of all
or almost all residues of the repeat in interactions with
the other molecule. This scenario is also unlikely,
because only some residues of the repeat motif can be
in contact with the other molecule and will therefore be
conserved owing to the specific functional interactions.
Thus, the structural role and functional interactions of
TRs, even when they are considered together, cannot
explain repeat perfection. This consideration favours
explanations based on evolutionary reasons. For exam-
ple, the perfection of TRs may reflect their recent
appearance during evolution. It is known that the
repetitive regions, such as microsatellites, evolve more
rapidly (mutational rate is 10
6
-fold higher) than the
unique parts of genes [47,48]. This generic instability
of TRs, together with the structurally permissive nat-
ure of their disordered state, may increase the proba-
bility of newly emerged repeats being fixed during
evolution, and allow a rapid response to environmen-
tal changes [12,49,50]. The evolutionary explanation
for repeat perfection is in line with the previously
suggested hypothesis that intrinsically disordered pro-
teins may evolve by repeat extension [12]. Functional
constraints, such as the ability of TRs to bind to the
repetitive surfaces of other molecules or to provide a
spacer that can vary in length in rapid response to
environmental threats, may play a role in their selec-
tion during evolution.
Our results suggest that, up to a certain level of
repeat perfection, there are structural reasons for con-
servation of residues and that these types of residue
may stabilize the unique 3D structure. However, when
a certain threshold of the conserved residues in the
repeat is exceeded, the repetitive regions of proteins
are predominantly disordered, and the main reason for
residue conservation in TRs may change from a struc-
tural to an evolutionary one. This hypothesis can be
tested by further evolutionary analysis. The results of
our analysis also lead to a practical recommendation
for prediction of the structures and functions of pro-
teins. If one sees a perfect TR in a protein of interest,
this region is most probably unstructured by itself but
still may adopt 3D structures upon binding to the
other molecular partners.
Methods
Detection of protein tandem repeats
The program t-reks was used for ab initio identification of
the TRs in protein sequences ( />?r=t-reks) [21]. This method is based on clustering of
lengths between identical short strings by use of a K-means
algorithm. Benchmarks on several sequence datasets
showed that t-reks detects the TRs in protein sequences
better than the other tested software. Several parameters of
the program can be defined by users. Among them are the
allowed percentage of length variability, Dl (the default
value of Dl used in this analysis is equal to 20% of the
repeat length). It was chosen on the basis of analysis of
known repeats of biological importance. The program also
evaluates the level of sequence similarity between the identi-
fied repeats of each run by using the following approach.
On the basis of multiple sequence alignment of the repeats
constituting a given tandem array, t-reks deduces a con-
sensus sequence and uses it as a reference for similarity cal-
culation. In this alignment, an indel is considered as an
additional 21st type of residue. We calculate a Hamming
distance, D
i
[51], between the consensus sequence and a
repeat, R
i
, with 1 £ i £m, where m is the number of repeats
in one run. Then, we define a similarity coefficient for the
whole alignment as P
sim
¼ðN À
P
m
i¼1
D
i
Þ=N, with N=ml
(l is the repeat length). The P
sim
value can be used to esti-
mate the level of perfection of the TR. The maximal value,
P
sim
= 1, corresponds to the run of the perfect repeats. In
Table 4. Abundance of disordered repeats as a function of the subcellular localization of corresponding repeat-containing proteins. Mem-
brane localization for eukaryotes combines ‘membrane’ and ‘cell membrane’ terms from SwissProt.
Prokaryotes Eukaryotes
Cytoplasm Membrane Secreted Nucleus Cytoplasm Membrane Secreted
Ratio of TopIDP (%) 54.3 72.3 83.6 74 81.2 60.2 72.7
Number of TRs 459 264 140 3650 (among them
1898 homorepeats)
1181 (476
homorepeats)
1436 (637
homorepeats)
782 (178
homorepeats)
J. Jorda et al. Structural state of perfect protein repeats
FEBS Journal 277 (2010) 2673–2682 ª 2010 The Authors Journal compilation ª 2010 FEBS 2679
this work, we analysed TRs with P
sim
‡ 0.70. The minimal
length of TR regions was determined by estimation of the
expected number of perfect TRs found by chance in a ran-
dom sequence dataset (of the SwissProt size), which follows
a binomial distribution approximated by a Poisson distribu-
tion [21]. The lengths for which the expected number of
perfect TRs is equal or close to zero correspond, respec-
tively, to nine residues for homorepeat regions and 14 resi-
dues for the other repeats.
Two databases were analysed: (a) a nonredundant data-
bank of sequences (with less than 95% identity) from the
July 2008 release of the PDB [52]; and (b) SwissProt,
release of January 2009 [53]. During analysis of the PDB,
artificial His-tags attached to proteins were not taken into
consideration. Short peptides of fewer than 20 residues that
represent ligands bound to proteins were also not taken
into consideration. Several errors in PDB sequence annota-
tions were found and excluded from the analysis. The 3D
structures of the remaining 164 repeats, divided into three
groups by the level of perfection (P
sim
=1,1>P
sim
‡ 0.9,
and 0.9 > P
sim
‡ 0.8), were analysed manually (Table 1).
The identified TRs were stored in the Protein Repeat Data-
Base ( />Compositional profiling
Biases in the amino acid compositions of IDPs and IDRs
can be visualized by using a normalization procedure
known as compositional profiling [32,33,37]. Compositional
profiling is based on the evaluation of the (C
s1
) C
s2
) ⁄ C
s2
values, where C
s1
is the content of a given residue in a set
of interest (regions and proteins with TRs), and C
s2
is the
corresponding value for the reference dataset (set of
ordered proteins or set of well-characterized IDPs). Data-
sets of fully disordered and structured proteins were taken
from the DisProt and PDB databases [38,39].
Prediction of disordered regions
Two disorder predictors from the pondr
Ò
family, vlxt
[34,40] and vls2 [41,42], as well as a set of orthogonal pre-
dictors such as iupred [43,44], foldindex [45], and
TopIDP [37], were used to analyse the differences between
the above-described datasets. pondr
Ò
vlxt is an integra-
tion of three artificial neural networks that were designed
for each of the termini and the internal part of the
sequences, respectively. Each individual predictor was
trained in a dataset containing only the corresponding part
of sequences. The inputs of the neural networks were amino
acid composition, hydropathy, net charge, flexibility, and
coordination number. The final prediction result was an
average over the overlapping regions of three independent
predictors [34,40].
pondr
Ò
vsl2 utilized support vector machines to train
on long sequences with length ‡ 30 and on short
sequences of length £ 30, separately. The inputs included
hydropathy, net charge, flexibility, coordination number,
the position-specific score matrix from psi-blast [54], and
predicted secondary structures from phdsec [55] and psi-
pred [56]. The final output was a weighted average with
the weights determined by a metapredictor [41,42]. vsl2is
accurate in detecting both short and long disordered
sequences.
iupred assumes that globular proteins have larger inter-
residue interactions than disordered proteins [43,44]. Hence,
it is possible to derive a sequence-based pairwise interaction
matrix from globular proteins of known structures. The
averaged energy based on this pairwise interaction matrix
for globular proteins should be different from that of disor-
dered proteins.
foldindex was developed from the charge–hydrophobic-
ity plot [35] by adding the technique of sliding windows
[45]. The charge–hydrophobicity plot was designed to deter-
mine whether a protein is disordered or not as a whole [35].
By application of a sliding window of 21 amino acids cen-
tred at a specific residue, the position of this segment on
the charge–hydrophobicity plot can be calculated, and the
distance of this position from the boundary line is taken as
an indication of whether the central residue is disordered or
not [45].
The TopIDP index is an amino acid scale that discrimi-
nates between order and disorder [37]. It is based on a set
of general intrinsic properties of amino acids that are
responsible for the absence of ordered structure in IDPs.
The corresponding TopIDP score for each amino acid
along the sequence is an average over a sliding window of
21 residues. It reflects the conditional possibility of
disordered status for the central amino acid in the sliding
window [37].
All of these predictors calculate a prediction score for
each residue in the sequence. When the threshold value of
the prediction score was set up, all of the residues whose
prediction scores were higher than the threshold value were
assigned as disordered, and the lower-score residues were
assigned as structured.
Acknowledgements
This work was supported in part by grants
R01 LM007688-01A1 (to V. N. Uversky) and GM071-
714-01A2 (to V. N. Uversky) from the National Insti-
tute of Health, grant EF 0849803 (to V. N. Uversky)
from the National Science Foundation and the Pro-
gram of the Russian Academy of Sciences for ‘Molecu-
lar and Cellular Biology’ (to V. N. Uversky). We
gratefully acknowledge the support of the IUPUI
Signature Centres Initiative. This work was also
supported by Ministe
`
re de l’Education Nationale, de la
Recherche et de la Technologie (MENRT) grant to
Structural state of perfect protein repeats J. Jorda et al.
2680 FEBS Journal 277 (2010) 2673–2682 ª 2010 The Authors Journal compilation ª 2010 FEBS
J. Jorda. We thank A. Ahmed for critical reading of
the manuscript and suggestions.
References
1 Pellegrini M, Marcotte EM & Yeates TO (1999) A fast
algorithm for genome-wide analysis of proteins with
repeated sequences. Proteins 35, 440–446.
2 Fraser RDB & MacRae TP (1973) Conformation in
Fibrous Proteins and Related Synthetic Polypeptides.
Academic Press, London.
3 Yoder MD, Lietzke SE & Jurnak F (1993) Unusual
structural features in the parallel beta-helix in pectate
lyases. Structure 1, 241–251.
4 Baumann U, Wu S, Flaherty KM & McKay DB (1993)
Three-dimensional structure of the alkaline protease of
Pseudomonas aeruginosa: a two-domain protein with a
calcium binding parallel beta roll motif. EMBO J 12,
3357–3364.
5 Kobe B & Kajava AV (2001) The leucine-rich repeat as
a protein recognition motif. Curr Opin Struct Biol 11,
725–732.
6 Fulop V & Jones DT (1999) Beta propellers: structural
rigidity and functional diversity. Curr Opin Struct Biol
9, 715–721.
7 Groves MR & Barford D (1999) Topological character-
istics of helical repeat proteins. Curr Opin Struct Biol 9 ,
383–389.
8 Lee MS, Gippert GP, Soman KV, Case DA & Wright
PE (1989) Three-dimensional solution structure of a sin-
gle zinc finger DNA-binding domain. Science 245,
635–637.
9 Sawaya MR, Wojtowicz WM, Andre I, Qian B, Wu W,
Baker D, Eisenberg D & Zipursky SL (2008) A double
S shape provides the structural basis for the extraordi-
nary binding specificity of Dscam isoforms. Cell 134 ,
1007–1018.
10 Elkins PA, Ho YS, Smith WW, Janson CA, D’Alessio
KJ, McQueney MS, Cummings MD & Romanic AM
(2002) Structure of the C-terminally truncated human
ProMMP9, a gelatin-binding matrix metalloproteinase.
Acta Crystallogr D Biol Crystallogr 58, 1182–1192.
11 Kajava AV (2001) Review: proteins with repeated
sequence – structural prediction and modeling. J Struct
Biol 134, 132–144.
12 Tompa P (2003) Intrinsically unstructured proteins
evolve by repeat expansion. Bioessays 25, 847–855.
13 Simon M & Hancock JM (2009) Tandem and cryptic
amino acid repeats accumulate in disordered regions of
proteins. Genome Biol 10, R59.1–R59.16.
14 Huntley MA & Golding GB (2002) Simple sequences
are rare in the Protein Data Bank. Proteins 48, 134–
140.
15 Andrade MA & Bork P (1995) HEAT repeats in the
Huntington’s disease protein. Nat Genet 11, 115–116.
16 Heringa J (1998) Detection of internal repeats: how
common are they? Curr Opin Struct Biol 8, 338–345.
17 Kobe B & Kajava AV (2000) When protein folding is
simplified to protein coiling: the continuum of solenoid
protein structures. Trends Biochem Sci 25, 509–515.
18 Matsushima N, Yoshida H, Kumaki Y, Kamiya M,
Tanaka T, Izumi Y & Kretsinger RH (2008) Flexible
structures and ligand interactions of tandem repeats
consisting of proline, glycine, asparagine, serine, and ⁄ or
threonine rich oligopeptides in proteins. Curr Protein
Pept Sci 9, 591–610.
19 Aachmann FL, Svanem BI, Guntert P, Petersen SB,
Valla S & Wimmer R (2006) NMR structure of the
R-module: a parallel beta-roll subunit from an Azoto-
bacter vinelandii mannuronan C-5 epimerase. J Biol
Chem 281, 7350–7356.
20 Fondon JW III & Garner HR (2004) Molecular origins
of rapid and continuous morphological evolution. Proc
Natl Acad Sci USA 101, 18058–18063.
21 Jorda J & Kajava AV (2009) T-REKS: identification of
Tandem REpeats in sequences with a K-meanS based
algorithm. Bioinformatics 25, 2632–2638.
22 Cummings CJ & Zoghbi HY (2000) Trinucleotide
repeats: mechanisms and pathophysiology. Annu Rev
Genomics Hum Genet 1, 281–328.
23 Cummings CJ & Zoghbi HY (2000) Fourteen and
counting: unraveling trinucleotide repeat diseases. Hum
Mol Genet 9, 909–916.
24 McEwan IJ (2001) Structural and functional alterations
in the androgen receptor in spinal bulbar muscular
atrophy. Biochem Soc Trans 29, 222–227.
25 Kleinjung J, Petit MC, Orlewski P, Mamalaki A,
Tzartos SJ, Tsikaris V, Sakarellos-Daitsiotis M, Saka-
rellos C, Marraud M & Cung MT (2000) The third-
dimensional structure of the complex between an Fv
antibody fragment and an analogue of the main immu-
nogenic region of the acetylcholine receptor: a com-
bined two-dimensional NMR, homology, and molecular
modeling approach. Biopolymers 53, 113–128.
26 Ngo JC, Giang K, Chakrabarti S, Ma CT, Huynh N,
Hagopian JC, Dorrestein PC, Fu XD, Adams JA &
Ghosh G (2008) A sliding docking interaction is essen-
tial for sequential and processive phosphorylation of an
SR protein by SRPK1. Mol Cell 29, 563–576.
27 Arnett KL, Harrison SC & Wiley DC (2004) Crystal
structure of a human CD3-epsilon ⁄ delta dimer in com-
plex with a UCHT1 single-chain antibody fragment.
Proc Natl Acad Sci USA 101, 16268–16273.
28 Deivanayagam CC, Rich RL, Carson M, Owens RT,
Danthuluri S, Bice T, Hook M & Narayana SV (2000)
Novel fold and assembly of the repetitive B region of
the Staphylococcus aureus collagen-binding surface pro-
tein. Structure 8, 67–78.
29 Hege T, Feltzer RE, Gray RD & Baumann U (2001)
Crystal structure of a complex between Pseudomonas
J. Jorda et al. Structural state of perfect protein repeats
FEBS Journal 277 (2010) 2673–2682 ª 2010 The Authors Journal compilation ª 2010 FEBS 2681
aeruginosa alkaline protease and its cognate inhibitor:
inhibition by a zinc-NH2 coordinative bond. J Biol
Chem 276, 35087–35092.
30 Kuzin AP, Chen Y, Acton T, Xiao R, Conover KMC,
Kellie R, Montelione GT, Tong L & Hunt JF (2010)
X-Ray structure of an ankyrin repeat family protein
Q5ZSV0 from Legionella pneumophila., doi:10.2210/
pdb2aja/pdb.
31 Schrag JD, Bergeron JJ, Li Y, Borisova S, Hahn M,
Thomas DY & Cygler M (2001) The structure of caln-
exin, an ER chaperone involved in quality control of
protein folding. Mol Cell 8, 633–644.
32 Vacic V, Uversky VN, Dunker AK & Lonardi S (2007)
Composition Profiler: a tool for discovery and visualiza-
tion of amino acid composition differences. BMC
Bioinformatics 8, 211.1–211.7.
33 Dunker AK, Lawson JD, Brown CJ, Williams RM,
Romero P, Oh JS, Oldfield CJ, Campen AM, Ratliff
CM, Hipps KW et al. (2001) Intrinsically disordered
protein. J Mol Graph Model 19, 26–59.
34 Romero P, Obradovic Z, Li X, Garner EC, Brown CJ
& Dunker AK (2001) Sequence complexity of disor-
dered protein. Proteins 42, 38–48.
35 Uversky VN, Gillespie JR & Fink AL (2000) Why are
‘natively unfolded’ proteins unstructured under physio-
logic conditions? Proteins 41, 415–427.
36 Radivojac P, Iakoucheva LM, Oldfield CJ, Obradovic
Z, Uversky VN & Dunker AK (2007) Intrinsic disorder
and functional proteomics. Biophys J 92, 1439–1456.
37 Campen A, Williams RM, Brown CJ, Meng J, Uversky
VN & Dunker AK (2008) TOP-IDP-scale: a new amino
acid scale measuring propensity for intrinsic disorder.
Protein Pept Lett 15, 956–963.
38 Xue B, Li L, Meroueh SO, Uversky VN & Dunker AK
(2009) Analysis of structured and intrinsically disor-
dered regions of transmembrane proteins. Mol Biosyst
5, 1688–1702.
39 Xue B, Oldfield CJ, Dunker AK & Uversky VN (2009)
CDF it all: consensus prediction of intrinsically disor-
dered proteins based on various cumulative distribution
functions. FEBS Lett 583, 1469–1474.
40 Romero P, Obradovic Z, Kissinger C, Villafranca J &
Dunker A (1997) Identifying disordered regions in pro-
teins from amino acid sequence. Proc IEEE Int Conf
Neural Networks 1, 90–95.
41 Peng K, Radivojac P, Vucetic S, Dunker AK &
Obradovic Z (2006) Length-dependent prediction of pro-
tein intrinsic disorder. BMC Bioinformatics 7, 208.1–
208.17.
42 Obradovic Z, Peng K, Vucetic S, Radivojac P &
Dunker AK (2005) Exploiting heterogeneous sequence
properties improves prediction of protein disorder.
Proteins 61(Suppl 7), 176–182.
43 Dosztanyi Z, Csizmok V, Tompa P & Simon I (2005)
IUPred: web server for the prediction of intrinsically
unstructured regions of proteins based on estimated
energy content. Bioinformatics 21, 3433–3434.
44 Dosztanyi Z, Csizmok V, Tompa P & Simon I (2005)
The pairwise energy content estimated from amino acid
composition discriminates between folded and intrinsi-
cally unstructured proteins. J Mol Biol 347, 827–839.
45 Prilusky J, Felder CE, Zeev-Ben-Mordehai T, Rydberg
EH, Man O, Beckmann JS, Silman I & Sussman JL
(2005) FoldIndex: a simple tool to predict whether a
given protein sequence is intrinsically unfolded. Bioin-
formatics 21, 3435–3438.
46 Tang YC, Chang HC, Roeben A, Wischnewski D,
Wischnewski N, Kerner MJ, Hartl FU & Hayer-Hartl
M (2006) Structural features of the GroEL–GroES
nano-cage required for rapid folding of encapsulated
protein. Cell 125, 903–914.
47 Buard J & Vergnaud G (1994) Complex recombination
events at the hypermutable minisatellite CEB1 (D2S90).
EMBO J 13, 3203–3210.
48 Weber JL & Wong C (1993) Mutation of human short
tandem repeats. Hum Mol Genet 2, 1123–1128.
49 Ellegren H (2000) Microsatellite mutations in the germ-
line: implications for evolutionary inference. Trends
Genet 16, 551–558.
50 Williamson MP (1994) The structure and function of
proline-rich regions in proteins. Biochem J 297 (Pt 2),
249–260.
51 Hamming R (1950) Error detecting and error correcting
codes. AT&T Tech J 29, 147–160.
52 Berman HM, Westbrook J, Feng Z, Gilliland G, Bhat
TN, Weissig H, Shindyalov IN & Bourne PE (2000)
The Protein Data Bank. Nucleic Acids Res 28, 235–
242.
53 Bairoch A & Apweiler R (2000) The SWISS-PROT pro-
tein sequence database and its supplement TrEMBL in
2000. Nucleic Acids Res 28, 45–48.
54 Altschul SF, Madden TL, Schaffer AA, Zhang J,
Zhang Z, Miller W & Lipman DJ (1997) Gapped
BLAST and PSI-BLAST: a new generation of protein
database search programs. Nucleic Acids Res 25,
3389–3402.
55 Rost B, Sander C & Schneider R (1994) PHD – an
automatic mail server for protein secondary structure
prediction. Comput Appl Biosci 10, 53–60.
56 McGuffin LJ, Bryson K & Jones DT (2000) The
PSIPRED protein structure prediction server. Bioinfor-
matics 16, 404–405.
Structural state of perfect protein repeats J. Jorda et al.
2682 FEBS Journal 277 (2010) 2673–2682 ª 2010 The Authors Journal compilation ª 2010 FEBS