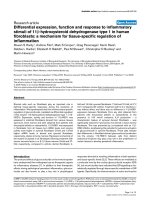
Applying lean tools and principles to reduce cost of waste management an empirical research in vietnam
Bạn đang xem bản rút gọn của tài liệu. Xem và tải ngay bản đầy đủ của tài liệu tại đây (4.46 MB, 13 trang )
Management and Production Engineering Review
Volume 10 • Number 1 • March 2019 • pp. 37–49
DOI: 10.24425/mper.2019.128242
APPLYING LEAN TOOLS AND PRINCIPLES
TO REDUCE COST OF WASTE MANAGEMENT:
AN EMPIRICAL RESEARCH IN VIETNAM
Nguyen Dat Minh1 , Nguyen Danh Nguyen2 , Phan Kien Cuong3
1
2
3
Faculty of Industrial and Energy Management, Electric Power University, Hanoi, Vietnam
School of Economics and Management, Hanoi University of Science and Technology, Hanoi, Vietnam
Toyota Motor Vietnam, Vinh Phuc, Vietnam
Corresponding author:
Nguyen Dat Minh
Electric Power University, Hanoi, Vietnam
Faculty of Industrial and Energy Management
Room No M303, 235 Hoang Quoc Viet Road, Hanoi, Vietnam
phone: (+84) 972 36-00-32
e-mail:
Received: 5 August 2018
Accepted: 7 March 2019
Abstract
Lean is one of the systematic approach to achieve higher value for organizations through
eliminate non-value-added activities. It is an integrated set of tools, techniques, and principles designed to optimize cost, quality and delivery while improving safety. In Vietnam,
industry waste management and treatment has become serious issue. The aim of this research is to present the effective of Lean application for industrial wastes collecting and
delivery improvement. Through a case study, this paper showed the way of Lean tools and
principles applied for wastes management and treatment such as Value Stream Mapping,
Pull system, Visual Control, and Andon to get benefit on both economic and environment.
In addition, the results introduced a good experience for enterprises in Vietnam and other
countries have similar conditions to Vietnam in cost saving and sustainable development in
waste management.
Keywords
Lean, JIT, Pull System, Waste Management, Waste flow Mapping.
Introduction
elimination of work losses, particularly any human
activity that absorbs resources but creates no value [1]. The strength of Lean is reduce manufacturing
cost through elimination all types of waste and guide
a company to become a world-class organization [4].
The ultimate goal of Lean is the reduction of wastes,
inventory, time to market and manufacturing space
by using its tools and principles [5–7]. Waste generation is the closest area to the Lean concept, focused
on the reduction of any type of redundancy [2] and
to minimize the environmental impact from production [1, 8]. Early studies investigated the hypothesis
that Lean reduces the marginal cost of environmental
management and, consequently results in enhanced
environmental performance [9–11]. The overall aim
of Lean and green approaches is to include environmental principles in the LM principles and then derive appropriate tools for the challenges [1]. There-
Background
Today, the efficiency of the production system is
less of resources including material, manpower, machine, energy and lower generation of waste and emissions to air and water [1]. The waste generation and
waste water are very common to any industry [2].
To meet the challenges of improvement and environmental management, various sustainable management norms, visions, directions and business models such as natural capitalism, ecological step have
been introduced by various authors [1]. In this context, where customers have become more demanding and more versatile, Lean has been widely adopted [3]. Today Lean is the paradigm in industrial management in the automotive industry. It focuses on
37
Management and Production Engineering Review
fore, an integrating Lean approaches and environment can improve the environment performance and
it often lowers the marginal cost of pollution reduction thus enhancing competitiveness [2]. And more
recently, the convergence between the two concepts
has been again underlined: Lean orientation may also help firms to adopt environmental management
practices which aim at reducing waste and pollutant
ejection [12].
The effective and environmentally aware companies have opportunities to improve waste management, because waste management often involves several members and staffs from various organizations,
therefore making it difficult to manage [1, 13]. This
paper focuses on the waste management improvement from perspective of Lean and operations management. A several of Lean tools for combined operations and environmental improvement and realization of waste management was conducted by casebased study. This paper focuses on an analysis of
the industrial waste management routing improvement from workplace to handling stations to separation center, and to vendors or final treatment. Finally, the objective of this paper is to enhance the
knowledge of how Lean principles and environmental management can be integrated, focusing on the
waste management handling.
Industrial waste
Waste is defined as an unusable or unwanted
substance or material [14] including solid and fluid
waste [1]. The components that constitute the solid
waste are metals, paper, textile, leather, food waste,
rubber, plastic and glass... [14]. Industrial waste can
be classified into two major categories include hazardous waste and non-hazardous waste [15] as below:
• Hazardous waste refers to solid, liquid or gaseous
wastes, that are harmful, such as highly flammable, corrosive, highly reactive or toxic substances, which also include treated hazardous
waste [15].
• Non-hazardous waste refers to wastes generated in
manufacturing or production that are not harmful
to humans, property or the environment.
Waste generator refers to a factory that generates
or possesses industrial waste listed in the waste [15].
Factories are divided into two categories: (1) Large
industrial waste generators generate more than 1,000
kilograms of industrial waste per month. (2) Medium
industrial waste generators generate more than 100
kilograms but less than 1,000 kilograms of industrial
waste per month [15].
Waste handling systems
Today, most manufacturing factories are in need
of detailed analysis of their waste management system at all stages of production, and studied waste
streams to identified opportunities for recovery and
resource saving [16]. Thus, the main objective of
waste management in factories was to find a method
of organizing a waste management system for a particular company, and of gaining an overview of the
whole system. Common stages of the process were
included workplace waste, waste collection, internal
handling (separation, container loading), transport,
and final treatment [1, 16].
Economic aspects of waste handling are usually
concerned with the cost of the trucks and/or depots
used, costs connected with municipal facility location [16–18]. The economic analysis may include fuel
costs, the cost of raw materials, of waste disposal and
treatment, of internal waste handling and income
from material and energy recovery [16]. Therefore,
the purpose of waste handling improvement is designing waste-minimization programs including balances of material, energy and water to cost reduction
with respect to industrial waste reduction and waste
management [16, 19].
Lean tools and principles
used to waste management
The term “Lean” is a concept used in production
system for eliminating waste and non-value-added
(NVA) operations by using a series of activities or
solutions [3]. Lean was first introduced by Womack
and Jones in 1990 in their book “The Machine That
Changed the World”, which describes the Toyota
production system (TPS) [20, 21].
Fig. 1. Overall waste management main processes [1, 16].
38
Volume 10 • Number 1 • March 2019
Management and Production Engineering Review
Lean focuses on elimination of waste within the firm’s
production system through continuous improvement
and process changes for reducing NVA activities or
elimination of wastes [20]. Womack and Jones (2003)
describes Lean as: “The most powerful tool available for creating value while eliminating waste in
any organization” [6]. The fundamental principles of
Lean are visualization and “go and see” or “GenchiGenbutsu” [7]. These fundamentals have been leading lights in the development of LM tools and techniques to achieve the target of improvement. There
are many Lean techniques can also specifically address environmental concerns [22]. Some tools and
principles of Lean such as Pull system, Andon, Value Stream Mapping, and Kanban can be applied
for environment management which efficient material flows, shorten lead-time, and minimal waste of
time (Muda) [23, 24].
• Value Stream Mapping (VSM) is a tool used to
showing the mapping for material flow in the factory floor [8] and find operational inefficiencies in
a process [23]. Later, in the latest publications,
the VSM extends to link factories, across the production chain. A VSM can be drawn for the entire supply chain, a process or a single subprocess.
The VSM can also be used in a non-detailed way
to analyze processes and subprocesses to visualize improvement potentials [1]. The conventional
VSM can be further extended through environmental [1, 22]. In environmental, VSM can be used
to map material use in different processes such as
energy consumption, waste and excess material.
From these activities, time and information in the
process including lead-time and inventory are diagnosed and mapped. Materials being processed
in manufacturing constitute a large part of final
product expenditures, and a VSM analysis aims at
both economic and environmental improvements.
Utilizing VSM proved to be an effective way for
management to functionally address problems of
production materials [1, 8, 22]. VSM analysis for
waste management considers how waste handling
is performed, for instance loading and sorting [1].
• The terms “pull” or “pull system” are often used
interchangeably with flow. It should be understood that, like flow, pull is a concept, and the
two are linked, but not the same. Flow defines
that state of material as it moves from process
to process. Pull dictates when material is moved
and who (the customer) determines that it is to
be moved [25]. Pull system enables the production based on customer demand; the downstream
process/customer takes the product/service they
need and ’pulls’ it from the producer [26]. A “pull
Volume 10 • Number 1 • March 2019
system” is an aggregation of several elements that
support the process of pulling. The successful Pull
system depends on flowing product, pacing the
processes to takt time, and signaling replenishment via a Kanban signal and leveling of product
mix and quantity over time [26]. The Kanban signal is one of the tools used as part of a Pull system.
The Kanban is simply the communication method
and could be a card, an empty space, a cart, or any
other signaling method for the customer to say,
“I am ready for more” [6]. Kanban system provide mixed model production along with optimal
inventory level which results in less lead time in
delivery and effective utilization of resources [26].
Womack and Jones (2003) indicated that it is possible to design a system that will be effective in any
situation [6]. Therefore, in environment field, pull
system can be used for design a signal for waste
collection, delivery and connection between shopfloor, waste separation center, and final treatment
vendors.
• Visual control via Andon system: Visual control
(VC) is any communication device used in the
work environment that tells us at a glance how
work should be done and whether it is deviating
from the standard [7]. VC limit and guide human
response in terms of height, size, quantity, volume,
weight, width, length and breadth [27]. They answer the information need for the basic where, how
many, who, when and what questions by integrating the message into the physical environment at
the point-of-use and leaving not many options for
people [28]. VC are mostly seen in production and
logistics, maintenance, quality and safety management efforts [29]. Bordering, outlining, marking, color-coding are some of the cognitive design
methods adopted for visual controls [28]. Andon is
a term for a visual control system using an electric
light board or screen monitor to visual information
and/or progressive of operations [7, 30]. The idea
of Andon is that worker can pull the so-called Andon cord, triggering the light and/or music as a
call for help decision making [30]. In waste management, Andon can help visualize and control the
progress of waste handling such as collection, storage, truck loading, and delivery.
Materials and method
In this research, an integrated Waste Flow Mapping (WFM) by using VSM method was used in
a case study. The case study examined the waste
flows, labor costs, handling efficiency and transport
efficiency in the waste management system at pro39
Management and Production Engineering Review
duction and non-production sites. The method was
designed to enable efficient routing and optimize
costs with limited resources by LM tools and principles applied. Two of the authors participated, serving as leader and main member of a “Eco Center”
project in case company.
Case study
The research was based on studies from the case
of Toyota Motor Vietnam (TMV), a leading manufacturer of automotive industry and Lean application
in Vietnam. The multi-site waste mapping project
focused on waste management and procurement of
waste management services are conducted.
The approach of this research requires knowledge of waste management and treatment standards
of Vietnam. The specific characteristics of the shop
site level analysis included overall analysis of the
waste volumes and the costs for waste handling from
the shop site to vendors. Performance measurements
were included to compare the results with best practices of the internal waste handling and ownership of
operations, together with the potential to improve
sorting and minimize costs of manpower and transportation. The analysis also resulted in recommendations for the continuous improvement and development of waste management services in manufacturing enterprises in Vietnam.
Company production and wastes situation
Toyota Motor Vietnam (TMV) is an automobile
manufacturer founded in Vinh Phuc province, Vietnam from 1995. Currently, TMV has a completed
production line with five main processes including:
Stamping – Welding – Painting – Assembly – Inspection. TMV is producing and assembly three sedan
models are Camry, Corolla Altis, and Vios and one
model of Multi-Purpose Vehicle (MPV) is Innova.
Total employees in TMV in 2018 are nearly 1,800
members with 1,300 operators and delivery members. TMV is holding the leading position in the
Vietnamese automobile market with the capacity of
more than 50,000 units per year in 2017 with two
working shifts a day. Average Takt time up to April,
2018 for sedan line is 6.7 minutes and MPV line is 16
minutes. In 2018, TMV has 25 local suppliers and 10
foreign suppliers from Japan, Thailand, Indonesia,
Malaysia, Taiwan... with more than 300 components
and parts (TMV documents).
TMV is a large industrial waste generator in Vietnam. Totally, TMV generate more than 5 tons of
waste in a production day. The case study resulted in a vast amount of detailed data and photos
on the waste management in TMV and the waste
supply chain. Table 1 shows the overall picture of
the amount of waste in the TMV’s production, nonproduction and logistic shops by weight.
Table 1
Waste categories and volumes in TMV.
Category
Name
Volume
Collecting
Transport
Note
1
2
3
4
5
6
Recycle
Paper, Carboard
2,000 kg/shift
Every 30 minutes
1 truck per shift
Nylon, Plastic, Rubber
415∼440 kg/ shift
4 per shift
1 truck per shift
40
Metal, plastic drink cans
6∼7.5 kg/day
4 per shift
Metal (Part cases
cover/Steel scrasp)
6,000 kg/day
8 per shift
1 truck per shift
Volume 10 • Number 1 • March 2019
Management and Production Engineering Review
Table 1 [Cont.]
1
Burned
Hazardous
2
3
4
5
Destroy part/body
Not fix
–
1 truck per month
Organic waste from canteen
85 kg/shift
2 per shift
Glover, rag
15∼18 kg/shift
4 per shift
Complex waste
120∼160 kg/shift 4 per shift
Oiled glover, rag
12.5∼18 kg/shift 4 per shift
Sealer/Primer/PVC/
Sticky tape
1.5∼2.5 kg/shift 2 per shift
Air filter/Absorbable substances
5∼6 kg/shift
6
1 truck per shift
2 per shift
1 truck per 2 weeks
Sanding paper/Grindstone/
Grinding disk
4∼6.5 kg/shift
2 per shift
Neon lamp
Not fix
–
Volume 10 • Number 1 • March 2019
41
Management and Production Engineering Review
Table 1 [Cont.]
1
2
3
4
Battery/Electronic devices
waste/Printer cartrigde
Not fix
–
Clinic waste
<1.5 kg/day
1 per day
Empty metal drum/
container
14 pcs/shift
2 per shift
5
6
1 truck per weeks
Empty plastic container
Engine waste oil/
lubrication oil
Paint sludge/
Photphate sludge
57∼62 pcs/shift 2 per shift
∼120 liter/ week 1 per week 1 per month (combined)
∼120 kg/week
1 per week
1 truck per week
Wastewater sludge
5,500 kg/week
1 per day
Source: TMV documents.
Data collection
The data collection was performed on both quantitative and qualitative data to visualize the waste
handling management. Quantitative data was collected by orserved system’s performance, charateristics and behavior of waste collection and handling.
Qualitative datas were collected on the method’s
functionality, charateristics and usability.
42
For the collecting the qualitative data, the production and waste management activities in the
cases were analysed as systems with inputs, proccesses, and outputs [1]. Taking a system view of
waste management, involving collection, transportation and storage operations, is an effective way to
gain efficiency and effectiveness [31]. The information on the total number of volumes, weights and
Volume 10 • Number 1 • March 2019
Management and Production Engineering Review
types of waste at each site along with the procurement effort for equipment and services was collected and used as input for operational development
regarding the waste management. The analysis on
each manufacturing site also considered the interactions between system elements such as equipment,
management, contractor companies, humans, environmental emissions and wastes, operation/ process
efficiency and the economic/social impacts [1].
Current map of waste generation points
The waste management process was studied with
a value stream mapping approach in a non-detailed
way. The waste management system was divided into subprocesses in the value stream approach include
work place waste operation, internal handling, waste
gathering, external transport and final treatment.
This paper focuses on of waste generations points,
amount of each, and how waste to be separated
and transported to buyers and treatment. The waste
management main processes are shown in Fig. 2.
Data were collected on each process regarding
resources, inventories, handling and movements.
Process (1) at the internal collection point was
mapped using layouts visualize (see Fig. 3), including data on the number and type of pallets, bins,
Fig. 2. Current waste treatment processes from TMV to vendors.
Fig. 3. Current map of waste generation points in TMV.
Volume 10 • Number 1 • March 2019
43
Management and Production Engineering Review
fractions, time for collecting and delivery (Table 1)
and consider inefficiencies in the main operation due
to waste handling. In process (2), the handling of
waste sources from operations to the external wastehandling contractor was mapped by data on handling
time, and manpower for handling. In process (3),
the layouts of “waste center” for separation, sorting
and storage were mapped to show NVA activities.
In process (4) was mapped by the type and cost of
external transportation off-site for each material segment. Process (5) at the disposal/final treatment operations was analyzed by type of disposal or recycling
code, and location. However, the full life cycle assessment data on the final treatment were not available.
The data of information management were collected by observes, interviews and data records, and the
improvement process was documented by interviews
and process efficiency data.
Figure 2 show the main points of waste generation from production and non-production in TMV
plant. There are total 28 main routes for waste delivery from shop site to separation center before truck
loading and transport to treatment destinations. In
addition, to collect and delivery more than 35 types
of waste include hazardous and non-hazardous waste
are generated from shop floors (Table 1), TMV need
40 operators for waste handling from sources to waste
center for separate and loading.
When trying to make the overall operation as
Lean as possible, the focus is on minimizing the
use and handling of NVA (Called MUDA in Toyota). In practical improvement work, the MUDA are
addressed simultaneously. First, the overall of waste
routing is analyzed to show the MUDA of transportation, motion, and over processing. Then, indicate the
Kaizen point (chance to improvement) for each of operation. All of these activities are conducted based
on “Genchi-Genbutsu” principle (Genchi-Genbutsu
mean go to shop site and see what happening). One
example is that if only one large bin is used for all
types of waste, the efficiency measure for bins is good
but the costs of final treatment and sorting, as well as
internal transportation (There are 108 waste points
with 108 waste bins in TMV assembly shop), will give
a non-optimal result. Therefore, in this study, the
improvement approach is conducted through several step include: Waste generation mapping and photograph fractions, map of internal logistic of waste,
Map of collecting points, Collect and analyze data
on out-site transportation and treatment. In order
to improve work place environment and expand pro-
44
duction plant, TMV president required a new waste
center called “Eco center” in a new place as far as
possible from production. Therefore, project team
proposed a new place for Eco-center and setup a new
full process from shop site to Eco center to vendors.
Next section will present Lean applying for waste operation improvement for three stages in waste flow,
include internal waste flow improvement, waste center operation improvement, and truck calling system
improvement for new Eco center.
Improvement method employed
using Lean tools and techniques
Flow mapping of waste handling
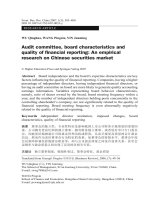
Figure 4 show the overall picture of waste flow
mapping for waste collecting and delivery design. In
order to minimize cost of collecting, moving and sorting, the project team proposed nine stations to gather all the waste. Project team also divided waste into four main routes with different transport methods include: (1) Mixed, (2) Cardboard, (3) Metal,
(4) Water-sludge.
The mixed waste routes delivery both hazardous
and non-hazardous waste but they are separated by
different color of bags or bins. Every 60 minutes, delivery member come and collect bags/bins and move
to Eco center from point No. 1 to point No. 9 as
shown in Fig. 4. The driver will utilize an electric
car with connected bins to collect or replace bins
and come to Eco center before put them to its locations. The schedule for mixed waste collecting is
planned based on pull principle from the sources.
Table 2 show delivery schedule in one shift of production at TMV. In addition, sub-routes for all of
waste from shop-floor and office to station are also
calculated to minimize moving and costs (Fig. 3).
Cardboard are continuously delivered from Shopsite to Eco center by Electric cars. In the first round,
driver pull empty cases from Eco center come to cardboard station (Point 1 in Fig. 4) and replace for
full-cases. In the second round, he will connect fullcases of cardboard to Electric car then come back
Eco center and put them to Baler machine.
Metal from press and weld shop and water-sludge
waste are moved to Eco center by forklift directly
with returned pallets and cases. The operation procedure of these delivery is same principle with cardboard and mixed waste (Come with empty then replace a full case and move to Eco center).
Volume 10 • Number 1 • March 2019
Management and Production Engineering Review
Fig. 4. Waste flow visualization and mapping proposal.
Table 2
Scheduling for mixed waste delivery in one production shift.
Source: TMV’s Eco-center project document.
Volume 10 • Number 1 • March 2019
45
Management and Production Engineering Review
Fig. 5. Some indicators of improvement result.
After applied waste flow mapping and combination waste routing, TMV’s project team saved 9 operators in total manpower for waste handling operation (save 23% manpower) and reduce 12 routes
from 28 routes to 16 routes (Fig. 5). In addition,
all of wastes from TMV are separated and full managed between hazardous and non-hazardous waste by
scheduling system visualized in control board located
in each waste station.
Pull principle applying
to Truck calling system
In order to design Lean operation for waste management and Just in Time (JIT) treatment, an information sharing system between production line with
Eco center and between Eco center with buyers, ven-
dors need to be setup. The first principle of JIT is
setup pull information system from the sources. All
of waste generation must be mapped and visualized
(as shown in Subsec. “Flow mapping of waste handling”) before make schedule to collecting and delivery to Eco center.
Figure 6 show new location for Eco center location and its simulate of sorting and storage. The
model of Eco center is made in the rate of 1/500 and
all of activities for input (contain waste from shop
site), main operations (contain waste sorting, pretreatment, storage, worker operation), and output
(contain truck calling, waste loading, goods controlling, and weighting) are visualized on Andon board.
The operation of Andon board for truck calling and
controlling is shown in Fig. 7.
Fig. 6. Eco-center design and simulation model.
46
Volume 10 • Number 1 • March 2019
Management and Production Engineering Review
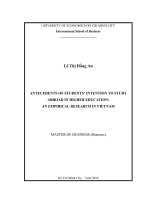
Fig. 7. Truck calling system using Andon (Example for hazardous waste).
Based on the truck capacity for waste loading and
transportation by weight and dimension and distance
between TMV and vendor, the system will count
quantity of waste storage to identity time to call
vendors come to load the waste automatically and
transport. For example, the full capacity of a 1.5 tons
truck for mixed waste is 18 standard bags of waste.
Count system will count the coming bag one by one
through light sensors, and confirmation button. Andon will send a signal to vendor to come and load
when enough 18 bags are counted from storage and
show on Andon board. The operation system for all
of wastes are similarly. The pull principle is follows
seven steps as below: (1) Waste come and separate
at Eco center → (2) Quantity count → (3) Sync to
Andon board → (4) Call truck → (5) Load the waste
→ (6) Transport → (7) Treatment (see calling points
in block “Lot making” show in Fig. 7).
Currently, TMV has two main vendors for waste
transport and treatment. Trucks from first vendor
will come Eco center to load the waste after 30
minutes (distance between this vendor and TMV
is 40 km located in Vinh Phuc province, Vietnam)
when received a waste loading signal from TMV.
Trucks from second vendor will come Eco center to
Volume 10 • Number 1 • March 2019
load the waste after one production-shift (distance
between this vendor and TMV is 120 km located in
Hai Duong province, Vietnam). In some case, trucks
will come to load waste (waste-sludge, empty metal drum, hazardous waste) after one production-day
because quantity of waste generation for one day is
little. Vendor often load these wastes every one or
two weeks.
When driver come TMV gate, he must drive the
truck to weighing station to weights in empty status. At station, truck license plate will be scanned
and driver select one of the modes of loading. For
example, when truck come to load cardboard, driver
must select cardboard mode by pull the rope named
CARDBOARD. Then, a light and/or sound will be
turned and the barrier is also opened to truck come.
After finished loading, the full-truck will drive back
to weighing station to weights again. The weight of
bulks is calculated by minus between before and after waste loaded. All of these activities are controlled
and visualized, and confirmation by Administration
department to calculate cost or income from each
ship. Steps of pull principle for calling system is follow main seven steps, include: (1) Full lot of waste
→ (2) Call vendor by E-Kanban/Email → (3) Truck
47
Management and Production Engineering Review
come → (4) Scan license plate and weights and select
mode of loading → (4) Waste loading → (6) Weights
again and confirmation → (7) Transport (see Andon visualize in Fig. 7). This improvement of calling
process has achieved JIT with pull system, and the
problem related to waiting, over-stock, and less than
truck load was eliminated.
Discussion and conclusion
Based on the literature review, characteristics
and gaps in existing operational improvement and
Lean improvement tools and principles were identified and applied. Potential operations of waste management were determined by using an integrated of
waste flow mapping and visualize method in a case
study. Waste flow and visualize in Lean principle as
solutions to the identify the problem of the waste
management for operational and environmental improvement to reducing resources and cost are discussed in this paper.
To analyze the criteria and requirements of current methods, an effort was made to cover as many
strategic and operational factors as possible from
reverse internal and external logistics systems [32].
Sustainable operation, including cleaner production,
eco-efficiency, material flow cost accounting and environmental management accounting were taken into consideration to cover different aspects from enterprises. The tools and principles included address
the analysis of materials, movements, related costs,
information, reports and methods, which are also
in line with the chosen system approach for this
study [1, 33]. The Lean principles approach appears
to be useful for implementation at the enterprise in
waste management and eco-efficiency.
The majority of manufacturing enterprises in
Vietnam are not familiar with Lean principles and
have studying to created their production systems
based on the Lean and the elimination of Muda.
However, Lean approach often focuses on improve
production activities rather than efficiency and sustainable development. Therefore, waste management
are often neglected. When an enterprise applied Lean
on waste management has previously proven fruitful
in healthcare and construction [1]. Minimizing NVA
activities is fundamental of Lean, and waste management activities by focusing on flow mapping and visualization are not only improves collaboration and
shares information but also covers scattered waste
management responsibilities in the waste handling
process for stockholder.
Implementing Lean tools and principles as a
framework for analyzing the waste management
48
process, revealing NVA, and identifying sustainable
improvement chances, and environment saving. Categorizing different waste fractions into segments and
analyzing segments individually are necessary steps
to identify best practices for the different segments.
Applying Lean approach to a multiple-site case study
highlighted the importance of visualization, mapping, and Genchi-Genbutsu in any production or
non-production activities. This is a good reference for
enterprises in production control and waste management in general. This more in-depth work would enable enterprises also to precise the impact of a waste
improvement plan into the different facets of company performance: economic, environmental and social.
Finally, this approach for waste management could
be expanded to other sectors such as environment
treatment companies, energy efficiency improvement
projects, water consumption reductions. This result
is also a good experience for enterprises in other developing countries have similar conditions to Vietnam in achieving sustainable development.
To manage all these data effectively and exactly,
next research should develop a waste database collection tool to store all required data. A technology application should then be developed to calculate and
construct the industrial waste flow and an analysis of
current flow can be done systematically to optimize
a new waste flow.
The authors sincerely thanks to Mr. Tadashi
Yoshida – Director of Production and Logistics, and
Mr. Huynh Anh Tuan – Deputy General Manager
from Toyota Motor Vietnam for all of their comments and suggestions.
References
[1] Kurdve M. et al., Waste flow mapping to improve
sustainability of waste management: a case study
approach, Journal of Cleaner Production, p. 1–12,
2014..
[2] Fercoq A. et al., Combining lean and green in manufacturing: a model of waste management, IFAC Proceedings Volumes, 46, 9, 117–122, 2013.
[3] Manzouri M. et al., Increasing production and eliminating waste through lean tools and techniques for
halal food companies, Sustainability, 6, 12, 9179
9204, 2014.
ă
[4] Papadopoulou T., Ozbayrak
M., Leanness: experiences from the journey to date, Journal of Manufacturing Technology Management, 16, 7, 784–807,
2005.
[5] Ohno T., Toyota production system: beyond largescale production, CRC Press, 1988.
Volume 10 • Number 1 • March 2019
Management and Production Engineering Review
[6] Womack J., Jones D., Lean thinking, Free Press,
2003.
[7] Liker J.K., The 14 principles of the Toyota way: an
executive summary of the culture behind TPS, The
Toyota Way, 14, 35–41, 2004.
[8] Torres Jr. A.S., Gati A.M., Environmental value
stream mapping (EVSM) as sustainability management tool, Management of Engineering & Technology, PICMET 2009, Portland International Conference on. 2009. IEEE.
[9] King A.A., Lenox M.J., Lean and green? An empirical examination of the relationship between lean production and environmental performance, Production and Operations Management, 10, 3, 244–256,
2001.
[10] Herrmann C. et al., An environmental perspective
on Lean Production, Manufacturing Systems and
Technologies for the New Frontier, Springer, pp. 83–
88, 2008.
[11] Florida R., Lean and green: the move to environmentally conscious manufacturing, California Management Review, 39, 1, 80–105, 1996.
[12] Yang M.G.M., Hong P., Modi S.B., Impact of lean
manufacturing and environmental management on
business performance: an empirical study of manufacturing firms, International Journal of Production
Economics, 129, 2, 251–261, 2011.
[13] Halme M. et al., Business models for material efficiency services: conceptualization and application,
Ecological Economics, 63, 1, 126–137, 2007.
[14] Golomeova S. et al., Solid waste treatment technologies, Machines, Technologies, Materials, 9, 59–61,
2013.
[15] Plubcharoensuk P., Nakayama H., Shimaoka T.,
Material Flow Analysis for Industrial Waste Management in Thailand, Memoirs of the Faculty of Engineering, Kyushu University, 68, 2, 107–127, 2008.
[16] Hogland W., Stenis J., Assessment and system
analysis of industrial waste management, Waste
Management, 20, 7, 537–543, 2000.
[17] Wang F., Roddick F., SWIM – interactive software
for continuous improvement of solid waste management, J. Resour. Manage. Technol., 22, 2, 63–72,
1994.
Volume 10 • Number 1 • March 2019
[18] Barlishen K., Baetz B., Development of a decision
support system for municipal solid waste management systems planning, Waste Management & Research, 14, 1, 71–86, 1996.
[19] Roberge H., Baetz B.W., Optimization modelling
for industrial waste reduction planning, Waste Management, 14, 1, 35–48, 1994.
[20] Womack J.P., Jones D.T., Roos D., Machine that
changed the world, Simon and Schuster, 1990.
[21] Alaskari O. et al., Critical successful factors (CSFs)
for successful implementation of lean tools and ERP
systems, 2013.
[22] Kidwell M., Lean manufacturing and the environment, Target, 22, 6, 13–18, 2006.
[23] Rother M., Shook J., Learning to see: value stream
mapping to add value and eliminate muda, Lean Enterprise Institute, 2003.
[24] Mike R., Toyota Kata Managing People for Improvment, Adaptiveness and Supeior Resolts, McGrawHill, USA, 2010.
[25] Liker J., The Toyota way fieldbook, Esensi, 2006.
[26] Sundar R., Balaji A., Kumar R.S., A review on lean
manufacturing implementation techniques, Procedia
Engineering, 97,1875–1885, 2014.
[27] Galsworth G.D., Visual systems: harnessing the
power of the visual workplace, American Management Association, 1997.
[28] Tezel A., Aziz Z., Visual controls at the workface
of road construction and maintenance, Preliminary
Report, 2015.
[29] Suzaki K., New shop floor management: empowering people for continuous improvement, Simon and
Schuster, 1993.
[30] Ismail S.Z., Design and Development of Andon System for Machining Machine at FKP Lab, UMP,
2013.
[31] Seadon J.K., Sustainable waste management systems, Journal of Cleaner Production, 18, 16–17,
1639–1651, 2010.
[32] Dowlatshahi S., Developing a theory of reverse logistics, Interfaces, 30, 3, 143–155, 2000.
[33] Arbnor I., Bjerke B., Methodology for creating business knowledge, Sage, 2008.
49