DETERMINANTS OF INTEREST RATE SPREADS IN BELIZE ppt
Bạn đang xem bản rút gọn của tài liệu. Xem và tải ngay bản đầy đủ của tài liệu tại đây (348.9 KB, 46 trang )
1
CENTRAL BANK OF BELIZE
1
Research Department
DETERMINANTS OF INTEREST RATE SPREADS IN BELIZE
Prepared by Paula Perez
July 2011
Abstract
This paper examines the components of interest rate spreads in Belize using accounting
data and then seeks to identify the factors that affect interest rate spreads using a panel
dynamic least squares model. The study concludes that market share and adversely
classified loans are two main determinants of the spread. Based on these findings, the
study suggests policy recommendations to reduce information asymmetries and increase
competition in the Belizean financial sector.
JEL codes: E43, C33
Keyword: Belize, interest rate spreads, panel dynamic least squares
1
The views expressed are those of the author and do not necessarily represent those of the Central Bank of
Belize.
2
1.0Introduction
In the latter part of 2008, the first wave of the global financial economic crisis was
manifested through a slowdown in the real economy, with vulnerable sectors such
tourism being severely affected. These external shocks led to a rise in unemployment
from 8.2% in 2008 to 13.1% in 2009 as businesses tried to compensate for the loss in
revenue by reducing business hours and maintaining minimal staff. Eventually, adversely
classified loans in the commercial banking system spiked from 6.83% at the end of 2007
to 12.69% in 2008. Notwithstanding the external macroeconomic environment, public
sentiment identified exorbitant lending rates as the major obstacle hampering private
sector growth and inhibiting their ability to recover.
Lending rates are made up of two components: deposit rates and the interest rate spread.
While high interest rates have been suggested as a significant deterrent to a thriving
entrepreneurial sector in Belize, empirical work on interest rate spreads is limited. The
purpose of this paper is to identify the factors which sustain the interest rate spread in
Belize and quantify the effects of these determinants using accounting and econometric
techniques.
This paper is the first to decompose interest rate spreads using banking data at the
consolidated country level and provide an analogous econometric model using panel data.
3
This approach recognizes that consolidated data can provide a general sense of the risk
premium and minimum required returns placed on lending activities, while panel
techniques are able to capture the market dynamics faced by individual banks at the
country level.
Definitions of interest rate spreads and margins vary among authors and offer no
consensus on the best measure for interest rate spreads. By employing the wide interest
margin definition in the analysis of the interest rate spread , the model seeks to accurately
capture actual rates paid to depositors and actual interest incomes earned from loans,
which includes the effects of fees and commissions, net of non-performing loans (see
Section 4).
The paper is organized as follows: section 2 outlines the historical behaviour of interest
rate movements from the 1970’s to present, while section 3 reviews the economic
literature pertaining to interest rate spreads. Section 4 provides an overview of the
methodologies employed in the study, while sections 5 and 6 present the respective
findings of the accounting and econometric framework applied in the study. Finally, the
analysis and conclusions are presented in section 7.
4
2.0StylizedFacts
Belize is a small, developing economy with a land mass of 8,866 square miles and has a
population of 312,971 persons
2
. Belize’s maintains a fixed exchange rate, pegged at
$2BZ to $1US, and the Central Bank is required to maintain external assets amounting to
at least 40.0% of the monetary base
3
. As of December 2010, Belize’s domestic financial
sector was comprised of five commercial banks, thirteen credit unions, fourteen insurance
companies, two financial institutions and one development bank. In 2009, the sector’s
total asset size amounted to $3.3bn, of which commercial banks and credit unions
accounted for 76.8% and 13.9% respectively. In the commercial banking sector, market
share is highly concentrated with two banks accounting for an average of 68.4% of total
loans. Some financial deepening was evidenced in the last four years as the growth in
branches and ATM machines
4
underpinned an increase in the ratio of broad money to
GDP from 59.7% in 2005 to 77.3% in 2009.
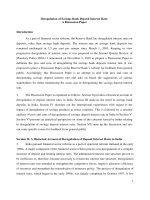
Graph 3 examines interest rates for the consolidated banking system from 1977 to 2009.
Tillet (1989) identifies the minimum lending and deposit rates as tools that influenced
monetary policy in 1980s. The spike in interest rates in the early 1980’s reflects the
authorities’ response to the drain on reserves experienced in 1978. Their efforts to curb
private sector credit growth led to an increase in the discount window from 7% in 1978 to
2
Based on Belize Housing & Population Census 2010.
3
This includes notes and coins in circulation and the Central Bank’s liabilities to other depository
corporations.
4
The number of branches increased from 39 in 2005 to 47 in 2009, and the number of ATM machines
increased from 51 in 2005 to 71 in 2009.
5
14.5% in 1981, and the imposition of credit restrictions on commercial banks
5
.
Consequently, commercial banks’ prime lending rate rose from 9.5% in 1978 to 19.5% in
1981, while rates on time deposits increased to 15.0% at the end of 1980. In another
instance, in an effort to limit credit expansion, reduce pressure on the balance of
payments and increase domestic savings: the Central Bank increased the minimum
lending rate from 12% to 14% in January 1984, while the minimum deposit rate was
increased by 3 percentage points from existing levels. In the reverse case, relaxing of
monetary policy led Central Bank to reduce the minimum lending and deposit rates
December 1986 and March 1989.
Figure I. Weighted Average Interest Rates
6
, 1977- 2010
5
In December 1979, Monetary Authorities issued directives to commercial banks to reduce their level of
outstanding loans and advances by 5%.
6
As reported by commercial banks to the Central Bank of Belize at the end of year.
0
5
10
15
20
25
%
DepositRate LendingRate Spread
6
Mendoza (1997) noted that during the 1985 to 1996 period, increases in government
borrowing were accompanied by a decline in the rate of private sector credit growth and
vice versa. Her study noted that some level of crowding out of private sector investments
would have contributed to higher interest rate levels during this period. She identified that
a significant structural change which contributed to the upward pressure on loan rates
was the transformation of a Canadian bank subsidiary into a locally incorporated bank,
and the later introduction of the International Business Company (IBC) Act with its
Public Investment Company section that enabled this bank to enjoy considerable tax
benefits. Coupled with aggressive management, the advantages conferred by its PIC
status paved the way for a sizeable increase in its deposit and loan growth. The remaining
commercial banks were forced to increase their competition for customer’s long term
deposits by bidding up interest rates, which reflected an increase in the weighted average
deposit rate from 8.6% in 1995 to 10.0% to 1996.
Another significant change in the interest rate structure took place in the mid-nineties
when efforts were made to reduce commercial banks’ reliance on Central Government’s
deposits for financing private sector credit. The liberalization of interest rates was
brought about when Central Government shifted deposits from commercial banks to the
Central Bank, and Central Bank simultaneously removed several floors on deposit rates
to foster a more competitive environment. The only floor maintained was a rate of 4.5%
on savings deposits, which was retained to protect small savers. Table I provides details
on changes to interest rate floors set by the Central Bank of Belize in March 1989 and
March 1994.
7
Table I. Comparative Interest Rates Floor Set by the Central Bank of Belize
Mar-89
(%)
Mar-94
(%)
Deposit Rates
Ordinary Passbook Savings 5.0 4.5
Premium Savings or other special
savings account 6.0 -
Fixed deposits for periods of
up to three months 7.0 -
Fixed deposits for periods over
three months and up to six months 8.0 -
Fixed deposits for periods over
six months and up to one year 8.5 -
Lending Rate
Minimum Lending Rate 10.0 9.0
Central Bank's Lending Rate
12.0 11.0
Source: Central Bank of Belize Annual Report 1994
During the period 2000 to 2009, marginal declines in weighted average lending rates and
simultaneous increase in deposit rates caused the weighted average interest rate spread
(IRS) to fall from 11.1% to 7.8%. The Central Bank of Belize 2006 Annual Report
identifies three factors that heightened the level of competition in the financial system
and consequently reduced the interest rate spread, as follows: (i) in 2001, the number of
domestic commercial banks increased from four to five; (ii) changes in the Offshore
Banking Act in 2002 allowed EPZ and CFZ companies to bank with offshore banks
licensed in Belize; and (iii) higher reserve requirements increased the level of
8
competition among banks and prompted them to compete for market share by offering
more attractive rates.
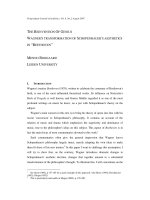
Despite these recent declines, graphs 2 & 3 indicate that Belize has the second highest
lending rates in the Caribbean and has been able to offer some of the highest deposit rates
in the region over the last three years.
Figure II. Weighted Average Lending Rate
Interest rate spreads in Belize are high relative to economies such as the United States
(2.95%) and China (3.06%)
7
, while they remain in the vicinity of countries such as
Guatemala (7.94%)
6
and Mexico (4.2%)
6
. A regional comparison of spreads in 2009
8
places Belize in the middle range. Graph 3 shows weighted average spreads in Belize are
7
As at December 2010, calculated using lending rate minus deposit rate, as per International Financial
Statistics.
8
Spreads measure weighted average lending rate minus weighted average deposit rate. These were
extracted from 2009 Annual Report Publications of the relevant Central Bank/Monetary Authorities.
0
1
2
3
4
5
6
7
8
9
10
%
2008 2009 2010
0
5
10
15
20
25
%
2008 2009 2010
Figure III. Average 3-month Deposit
Source: Caribbean Centre for Monetary & Finance
9
higher than rates in the OECS economies and Barbados, but lower than those in Guyana,
Trinidad & Tobago and Jamaica.
Figure IV. Regional Comparison of Interest Rate Spreads for 2010
Source: Relevant Monetary Authourities
3.0LiteratureReview
Interest rate spread consists of several components: operating cost, profits, reserves and
provisions for bad debts based on the accounting perspective. These components are a
reflection of micro and macro variables which impact the spread, such as efficiency, type
of ownership, concentration of market power and the regulatory framework under which
banks operate. A review of the literature provides an extensive list of variables that affect
the spreads and categorises these determinants into five main groups: bank-specific
0246810
Guyana
Trinidad&Tobago
Belize
Bahamas
Barbados
%
10
variables, system-wide measures of market structure, regulatory environment, legal and
institutional environment and macro-economic variables.
Bank-specific variables refer to those factors which characterise individual banks and
affects the interest rate spreads accruing to the respective institution. This category
includes features such as efficiency, credit risk levels, bank profitability and excess
liquidity. Higher operational costs have been positively correlated with higher interest
rate spreads as banks increase mark up on loans to cover operating expenditure. Various
studies supporting this relationship included: an international cross-country comparison
of OECD, developing and transitioning economies by Demirguc-Kunt & Huizinga
(1999); a regional study on the Caribbean by Craigwell and Moore (2002); and individual
country analyses of the Ugandan economy by Beck and Hesse (2006) and Central Bank
of Solomon Islands (2007). Further, larger operating costs have been associated with
greater levels of inefficiency in the financial system of developing countries established
by respective studies by Randall(1998) and Ngugi (2001) on the OECS and Kenya. A
recent study by IADB (2010) found that Belize’s high interest rate spreads are indicative
of high operating costs or inefficiencies in financial intermediation.
Increases in loan loss provisions has been cited as another factor which increases interest
rate spreads as additional resources must be committed to dealing with bad loans
(Barajas, Steiner and Salazar 1998, Randall 1998 and Craigwell and Moore 2002).
Additionally, country-specific studies by Central Bank of Solomon Islands (2007) and
Ghosh (2008) on India states that holdings of excess liquidity also drives spreads
11
upwards as higher levels of excess liquidity represents a greater penalty for unused funds
on which banks must pay interest to depositors.
Demirguc-Kunt, Laeven & Levine (2003) concluded that individual bank characteristics
can also explain a substantial part of within-country variations in financial intermediation
cost, as high net interest margins tend to be associated with (i) small banks, (ii) banks
without substantial income from fee-based activity, (iii) banks that hold a low amount of
capital and (iv) those with a large market share.
System-wide measures of market structure highlight those attributes that define the
industry and which cause interest rates to change over time. These factors include the
level of bank concentration, market power and competition, as well as the effect of
foreign ownership and state ownership. In the late nineties, the relationship between
market structure and interest rate margins was re-visited, as the push for financial
liberalization among several countries in the 1990s failed to bring about the convergence
of spreads between developing and industrial economies. Cross-national and regional
studies were able to establish that the structure of the financial markets can affect
variations in spreads. However, results produced were sometimes contradictory and
differed across regions.
In Belize, an IADB study (Martin 2010) noted that inefficient and uncompetitive
financial intermediation processes partially contributed to the country’s high cost of
financing. Similarly, Mendoza (1997) identifies the low level of competition in the
12
Belizean banking system as a primary reason for interest rate spreads being higher than in
Barbados, a Caribbean country with a similar exchange rate regime and higher reserve
requirements. Mendoza identified that Barbados’ financial system was of a larger size
and had a variety of non-bank financial institutions which facilitated lower spreads when
compared to Belize.
Demirguc-Kunt and Huizinga (1999) noted that in relatively poor countries foreign
ownership of banks is associated with higher interest spreads as foreign banks were
frequently exempted from unfavourable domestic regulations and their application of
superior banking techniques would allow them to earn higher margins than domestic-
owned banks. In contrast, Martinez Peria and Mody’s (2004) study on Latin America
concluded that foreign banks were able to charge lower spreads relative to domestic
banks and indirectly influence intermediation through lowering costs of operation.
Martinez Peria and Mody (2004) also established a positive correlation between bank
concentration and interest rate spreads, as industries with a high market concentration had
less pressure to reduce intermediation costs. On the other hand, Crowley (2007) provided
evidence of a negative relationship between concentration and spreads suggesting that a
country with a small number of powerful banks are able to restrict the level of
competition by keeping spreads artificially low.
Chirwa and Mlachila (2002) found that interest rate spreads in Malawi increased
significantly after implementing financial liberalization reforms due partially to high
13
monopoly power within the industry coupled with the high incidence of interlocking
ownership and directorship in the Malawian banking system which effectively stifled
competition. Their study strongly concluded that high interest rate spreads in developing
countries will persist if financial sector reforms do not alter the structure within which
banks operate.
Regulatory environment specifically includes both explicit taxation via corporate
income tax or profit tax and implicit taxation via reserve requirements. The legal and
institutional environment refers to the overarching ethos under which all national
institutions operate. This impacts perceptions of risk including credit risk and loan loss
provisioning. Commercial laws, adequate institutional enforcement, index of corruption
and level of institutional development are variables studied under this category.
Increases in reserve requirements are associated with a growth in interest rate spreads
since banks pass on the cost of holding unloanable funds to consumers via an increase in
lending rates or a reduction in deposit rates (Demigurc-Kunt and Huizinga 1999,
Demigruc-Kunt, Laeven and Levine 2003 and Tennant and Folawewo 2009). However,
reserve requirements relative to the size of the spread were small for the OECS (Randall
1998) accounting for less than 10% of the average spread between the period 1991 to
1996. In the case of Belize, Martin (2010) estimated that 50% of the spread is
attributable to reserve requirements, based on the zero-profit methodology.
14
The level of country risk was another key factor that boosted spreads as severe socio-
political instability in the Solomon Islands was a key factor behind commercial banks’
high spreads (Central Bank of Solomon Islands 2007). Further, a weak legal system
contributed to the accumulation of non-performing loans in Kenya, which in turn pushed
up lending rates and increased net interest margins (Ngugi 2001).
Macro-economic factors such as inflation, GDP growth, interest rates on alternative
financial instruments and exchange rates were employed as control variables across most
studies. However, Birchwood(2004) explicitly examined the impact of macroeconomic
influences on nominal and real interest spreads in the Caribbean region. He concluded
that differences in interest rate spreads across the region may be due to differences in
economic cycles, inflation and liquidity conditions, while the differences in the exchange
rate regime affected the magnitude of the spreads. The study also found that countries
with fixed exchange rates exhibited lower inflation rates and the highest real spreads.
4.0Methodology
Based on the literature, use of the net interest margin is a commonly used measure which
is calculated by subtracting interest expense from interest income and then dividing by
total assets. A variation of this measure is wide interest margin, which subtracts interest
payments divided by total deposits from interest earnings divided by total loans. Graph 1
shows that the reported rates in the Belizean system are a close proxy of the actual
interest rate spread calculated from the profit and loss statements.
15
Figure V. Comparison of Various Interest Rates (%) in Belize, 2001-2010
Source: Central Bank of Belize
The graph shows that disparities exist between rates reported by commercial banks and
actual rates paid to depositors since actual interest payments on deposits are based on the
minimum holdings during the period. Similarly, the weighted average lending rate
exceeds actual interest income when a rise in non-performing loans reduces the average
earnings realised by the commercial bank. Sections 5 of the paper will focus on the wide
interest margin as this is a more accurate measure of spreads accrued by commercial
banks in comparison to reported interest rates
9
.
9
Commercial banks are required to submit their lending and deposit rates on a monthly basis to the Central
Bank of Belize.
0.0
5.0
10.0
15.0
20.0
2001 2002 2003 2004 2005 2006 2007 2008 2009 2010
ReportedWeightedAverageLendingRate Interestearnedfromloans/totalloans
ReportedWeightedAverageDepositRate Interestpaidondeposits/totaldeposits
ReportedInterestRateSpread InterestRateSpread(Profit&Loss)
16
A review of the literature uses specific accounting and econometric techniques to
examine interest rate margins. For the purpose of this analysis, the accounting method is
used to decompose the spread and identify its most significant components. Building on
these results, the econometric model is then used to analyse those behavioural factors that
sustain the spread. The consistency of the findings in these two models will then be used
as a check and balance to corroborate the accuracy of the study.
The accounting method used by various studies analyses the factors that make up the
interest rate spread using information from the profit and loss statement and the balance
sheet. This method attempts to quantify the contribution of specific accounting factors
such as return on assets, operating expenses and cash reserve requirements to the overall
spread. Although it offers preliminary insights on the impact of these determinants on the
size of the spread, it is unable to provide an explanation for causation or behavioural
patterns (Central Bank of Solomon Islands 2007). This model cannot be used to ascertain
the underlying causes for the magnitude of each factor’s contribution to the spread.
Hence, it is ineffective for predictive purposes and cannot adequately assess the impact of
non-accounting factors to the spread, such as competitiveness, risk and bank size, among
others.
To overcome these deficiencies, econometric techniques will be used to model interest
rate spreads. A review of the literature shows that most econometric models employ
panel regression techniques and use the appropriate fixed or random effects model, based
on the suitability of the data. Taking into account the main factors that affect interest rate
17
spreads (bank-specific, industry-specific, and macro-economic variables), a panel
regression was used to model the determinants of the spread, as shown in Section 6.
5.0AccountingMethodology
5.1AccountingModel&DataSources
The accounting model taken from Randall (1998) is based on the premise that total
income earned by banks must cover interest expenses, operational cost, provisioning cost
and profits or losses. On the other side of the equation, total income is the sum of interest
income and non-interest income. Hence, the equation is represented as follows:
II + NII ≡ IP + OC + Prov + P + T…………(1)
Where II represents interest income, NII represents non-interest income, IP represents
interest expense, OC represents operational cost, Prov represents provision for loan
losses, P represents profit or losses after taxes and T represents taxes.
By rearranging identity (1), and normalizing certain variables using loans and deposits,
we reduce the equation to make interest rate spreads the subject of the formula, as
follows:
i
L
– i
D
≡ ρ i
L
+ OC/ D + Prov/D + ROA* A/D – NII/D + T/D + ε……… (2)
18
Based on equation 2 above, i
L
represents II/L or interest income divided by loans and is a
proxy for the effective lending rate. i
D
represents interest expenses divided by deposits
which is a proxy for effective deposit rate. ρ represents the required reserved ratio, and ρ
multiplied by i
L
represents that fraction of interest earnings that is lost by holding cash
reserves. ROA*A/D is a normalised variable representing the proportion of the spread
that makes up the return on assets after taxes. Prov/D and T/D represents that portion of
the spread attributable to provisioning and taxation. NII/D represents a reduction from the
spread which has a negative effect on the spread as non-interest income earning increase.
Ε represents the residual. Appendix 1 contains a detailed derivation of the formula.
The residual reflects errors that result from combining flow data from income statements
and stock data from the consolidated balance sheet. The residual also accounts for errors
as well as simplifying the assumption that loanable funds are comprised of deposits net of
required reserves.
Balance sheet and profit and loss data of the five commercial banks for the time period
2001 to 2010 were used for individual banks and were consolidated for the system.
5.2EmpiricalResults
According to the accounting model described above, variables from the profit and loss
statement would have a direct impact on the interest rate spread, as follows:
(i) Factors increasing the spread: reserve requirements, operating costs, loan loss
provisioning, tax payments and after tax profits; and
19
(ii) Factors decreasing the spread: non-interest income.
Table 3 below shows the contribution of the various factors to the interest rate spread
over the period 2001 to 2009. Notwithstanding gradual increases in the reserve
requirements, the actual interest rate spread has narrowed over time from 10.9% in 2001
to 6.9% in 2010, as the average lending rates have declined (from 15.2% to 13.1%) and
average rate on deposits have increased (from 4.3% to 5.9%). For the ten-year average,
the interest rate spread represents almost two-thirds (63.5%) of the lending rate (i.e. 8.9%
out of 14.0%).
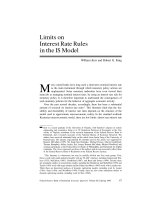
Graph 5 below displays a regional comparison on the interest rate spread to lending rates
for a few selected Caribbean countries for the time period 2001 to 2009. While Belize has
the largest interest rate spread to lending rate ratio in 2001, this ratio has consistently
declined and interest rate spreads accounts for less than 60% of the lending rate in 2009.
In contrast, Trinidad & Tobago had the lowest spread to lending ratio in 2001, but their
ratio rose significantly in 2009 with their spread accounting for almost 90% of their
lending rate.
10
10
This lending rate refers to local currency lending only.
20
Figure VI. Comparative Ratios of Interest Rate Spreads to Lending Rates
11
among Selected Caribbean Economies
Table II provides the decomposition of the interest rate spreads based on the accounting
methodology. On average, operating cost and after–tax profits are the largest components
of the spread, while non-interest income is a significant factor that reduces the spread.
11
Lending rates and spreads for Trinidad & Tobago, Barbados and Jamaica represent reported interest
rates, while calculations for Belize uses actual average loan income and wide interest margin.
40%
50%
60%
70%
80%
90%
100%
2001 2002 2003 2004 2005 2006 2007 2008 2009
Trinidad&Tobago Jamaica Barbados Belize
21
Table II. Components of Interest Rate Spread for the Banking System
2001
(%)
2006
(%)
2007
(%)
2008
(%)
2009
(%)
2010
(%)
Average
2001-2010 (%)
i
L
15.2 14.4 13.9 13.6 13.1 12.6 14.0
i
D
4.3 5.5 5.7 5.8 5.9 5.7 5.1
Spread 10.9 9.0 8.3 7.8 7.2 6.9 8.9
Factors increasing interest rate spread
Res. Req.
(cash) 0.5 1.3 1.4 1.4 1.3 1.1 1.0
OC/D 6.0 6.2 6.0 6.2 5.5 5.2 5.8
Prov/D 0.3 0.5 0.5 1.0 0.6 1.3 0.6
Taxes/D 0.5 0.9 0.9 1.0 1.1 1.1 0.7
ROA *(A/D) 6.6 4.8 4.1 2.6 2.1 1.3 4.3
Factors decreasing interest rate spread
NII/D 3.0 3.8 3.5 3.5 3.5 2.7 3.3
Residual 0.1 0.9 1.2 0.8 0.0 0.4 0.3
Figure VII. Components of Average Interest Rate Spread: 2001 – 2010
‐60.0%
‐40.0%
‐20.0%
0.0%
20.0%
40.0%
60.0%
80.0%
ReserveRequirements
OperationalCost
Provisioning
ReturnonAssets
Taxes
Non‐InterestIncome
22
Contribution to
the Spread
Variable
Range Mean Calculation Factors Affecting Changes in Variables
Reserve
Requirement
ρ*i
L
5.0%(2001) -
18.3%(2009)
12.4%
Cash Reserve Requirement x
(Interest Earnings on Loan/Average Loans)
Cash reserve requirements were increased 6 times as measures to curb credit and foreign
exchange demand were necessary after sizeable fiscal expansion in the four years prior to
2002. (See Table A.2 )
Operating
Cost
OC/D 51.2%(2002) –
79.2%(2008)
66.6%
Annual Operating Cost/ Average Deposits
- Salaries and operating costs contributed to the largest increase in operating cost followed by
net expenses on bank premises and equipment. (See Table A.3)
-The Burden ratio fluctuated around 2.0% during the period, but the efficiency ratio rose from
44.8% in 2001 to 56.7% in 2009 indicating that although inefficiency levels rose for the entire
banking system, commercial banks were able to recoup these costs via non-interest income
(fee-based) activities.
Two main factors accounting for the decline in net interest income which caused the disparity
between the two variables are (i) reduction in interest earnings attributable to increased non-
performing loans and (ii) increases in the cost of deposits.
Loan Loss
Provisioning
Prov/D 1.1%(2004) –
18.2%(2010)
7.0%
Total Annual Loan Loss Provision/
Average Deposits
The rapid acceleration in the growth of non-performing loans between 2007 (at 6.83%) to 2010
(16.1%). Table A.4 provides definitions and requirements for different categories of non-
performing loans.
Tax
Payments
T/D 3.0%(2003) -
15.9%(2010)
9.0%
Annual Tax Payments/ Average Deposits
Commercial Banks tax rates increased twice during the period. In February 2005, commercial
banks tax rates increased from 4% to 8% for Public Investment Companies (PICs) and from
10% to 15% for non-PICs. The second was effective January 2009, when taxation for PICs
rose from 8% to 12%. (Table A.5)
After Tax
ROA*A/D 18.9%(2010) -
60.7%(2001)
46.5%
A
nnual Net Income After Tax x
Average Assets/Average Deposits
After tax profits declined sharply in 2008 with the increase in non-performing loan levels, as
noted above, and the increase in operating costs.
Table III. Factors affecting Interest Rate Spread Components
23
Profits
Non-Interest
Income
NII/D -25.5%(2002) -
-48.2%(2009)
37.9%
A
nnual Non Interest Income/
Average Deposits
Banks increasing dependence on non-interest-based activities. Foreign exchange transactions
were the most significant source of non-interest income for commercial banks between 2005
and 2009. (See Table A.6)
24
In summary, an examination of financial data reveals that profits and operating costs are
the main components of interest spreads in the commercial banking system.
Simultaneously, non-interest income is equally important in reducing the pressure on
commercial banks to raise revenue from interest-based activities. On the other hand,
reserve requirements account for an average of 12.4% of the interest rate spread,
considerably lower than the 50% estimate derived from the zero-profit methodology
applied by Martin (2010) for the year 2006. However, the accounting model fails to
identify the behavioural factors that may sustain these profits and operating costs such as
the level of competition for deposits and loans in the banking system, inefficiency and
macro-economic factors. The econometric model attempts to identify those behavioural
factors which impact interest rate spreads in the Belizean system.
6.0EconometricModel
6.1ModelSpecification
Based on the model by Ghosh (2008), an assessment of the factors that affect interest rate
spreads can been decomposed into bank-specific variables (B), industry specific variables
(Z) and macro-economic variables (M).
The general model takes the following form:
WIM
it
= φ
0
+ φ
1
B
it
+ φ
2
Z
t
+ φ
3
M
t
+ ε
it
where i indexes banks and t denotes year;
WIM measures wide interest margin;
25
For the purpose of this analysis, bank specific variables include adversely classified loans
(acl), operating cost (ovcost), liquidity (xsliq) and non-interest income (non_int_yoi) and
actual holdings of liquid assets as a ratio to liquidity requirements (holdings_req).
Holdings_req is a scalar variable used in this model which measures holdings of excess
liquidity beyond statutory requirements and attempts to quantify the effect of banks’
liquidity management practices on interest rate spread. Industry specific time-varying
determinants are measured by cash reserve requirements (cashreq), marketshare
(mktshare) and concentration of deposits (dep_concen). The latter two variables are a
proxy for market power: (i) market share (measured by the relative size of a commercial
banks’ loan portfolio) is a common indicator across several countries, and (ii) the
concentration of deposits variable has been devised for the Belizean context where
limited investment alternatives permit large institutional depositors to negotiate for higher
deposit rates among banks with tight liquidity. Macroeconomic variables include GDP
growth (dgdp) and inflation (dcpi).
A priori expectations from the literature review suggest a positive correlation with
adversely classified loans, cash reserve requirements, operating cost, the ratio of actual
holdings to required holdings, excess liquidity, market share and GDP growth; while
concentration of deposits, inflation and non-interest income should be negatively
correlated with the interest rate margin. Appendix 7 provides a description and summary
statistics of the variables used in the model.