ENVIRONMENTAL INDICATORS: A SYSTEMATIC APPROACH TO MEASURING AND REPORTING ON ENVIRONMENTAL POLICY PERFORMANCE IN THE CONTEXT OF SUSTAINABLE DEVELOPMENT pot
Bạn đang xem bản rút gọn của tài liệu. Xem và tải ngay bản đầy đủ của tài liệu tại đây (5.74 MB, 58 trang )
•^k^S
:
ENVIRONMENTAL
INDICATORS:
A SYSTEMATIC APPROACH TO MEASURING AND
REPORTING ON ENVIRONMENTAL POLICY PERFORMANCE
IN THE CONTEXT OF SUSTAINABLE DEVELOPMENT
Allen Hammond
Albert Adriaanse
Eric Rodenburg
Dirk Bryant
Richard Woodward
WORLD RESOURCES INSTITUTE
ENVIRONMENTAL INDICATORS:
A Systematic Approach to Measuring
and Reporting on Environmental
Policy Performance in the Context of
Sustainable Development
Allen Hammond
Albert Adriaanse
Eric Rodenburg
Dirk Bryant
Richard Woodward
n
n
u
WORLD RESOURCES INSTITUTE
May 1995
Kathleen Courtier
Publications Director
Brooks Belford
Marketing Manager
Hyacinth Billings
Production Manager
Sam Fields
Cover Photo
Each World Resources Institute Report represents
a
timely, scholarly treatment
of a
subject
of
public concern. WRI takes
re-
sponsibility
for
choosing
the
study topics
and
guaranteeing
its
authors
and
researchers freedom
of
inquiry.
It
also solicits
and
responds
to the
guidance
of
advisory panels
and
expert reviewers. Unless otherwise stated, however,
all the
interpretation
and
findings
set
forth
in
WRI publications
are
those
of
the authors.
Copyright © 1995 World Resources Institute. All rights reserved.
ISBN 1-56973-026-1
Library
of
Congress Catalog Card No. 95-060903
Printed
on
recycled paper
CONTENTS
ACKNOWLEDGMENTS v
FOREWORD vii
I. Introduction 1
National-level Indicators 2
Environmental Indicators in the Context of Sustainable Development 2
II.
BACKGROUND AND CONTEXT 5
III.
HOW INDICATORS CAN INFLUENCE ACTION:
TWO CASE STUDIES 7
The Dutch Experience 7
WRI Experience—The Greenhouse Gas Index 8
IV. ORGANIZING ENVIRONMENTAL INFORMATION: INDICATOR
TYPES,
ENVIRONMENTAL ISSUES, AND A PROPOSED CONCEPTUAL
MODEL TO GUIDE INDICATOR DEVELOPMENT 11
Pressure, State, and Response Indicators 11
Focusing on Environmental Issues 12
A Conceptual Model for Developing Environmental Indicators 15
V. POLLUTION/EMISSION: ILLUSTRATIVE CALCULATIONS OF
INDICATORS AND OF A COMPOSITE INDEX FOR THE NETHERLANDS 17
Climate Change 17
Depletion of the Ozone Layer 18
Acidification of the Environment 18
Eutrophication of the Environment 19
Dispersion of Toxic Substances 19
Disposal of Solid Waste 20
Composite Pollution Index 20
VI.
RESOURCE DEPLETION: ILLUSTRATIVE CALCULATIONS OF
COMPOSITE INDICES FOR SELECTED COUNTRIES 23
VII.
BIODFVERSITY: AN ILLUSTRATIVE APPROACH TO THE
DEVELOPMENT OF COMPOSITE INDICATORS 27
VIII. HUMAN IMPACT/EXPOSURE INDICATORS 29
IX. APPROACHES TO SUSTAINABLE DEVELOPMENT INDICATORS 31
X. IMPLICATIONS FOR ACTION 33
Implications for Data Collection and Statistical Reporting 33
Involving Users 33
Reporting to the Public 34
NOTES 35
APPENDIX
1
37
Valuation Methods in Natural Resource Accounting 37
Country Notes 37
APPENDIX II. ENVIRONMENTAL INDICATOR REPORTING FORMATS 43
LIST OF FIGURES
Figure 1. The Information Pyramid 1
Figure 2. Pressure-State-Response Framework for Indicators 11
Figure 3. Matrix of Environmental Indicators 13
Figure 4. Matrix of Environmental Indicators 14
Figure 5. A Model of Human Interaction with the Environment 15
Figure 6. Climate Change Indicator 18
Figure 7. Ozone Depletion Indicator 18
Figure 8. Acidification Indicator 19
Figure 9. Eutrophication Indicator 19
Figure 10. Toxics Dispersion Indicator 20
Figure 11. Solid Waste Disposal Indicator 20
Figure 12. Composite Pollution Indicator 21
Figure 13. Resource Depletion Index: Resource Depreciation/Gross Fixed
Capital Formation 25
Figure 14. Resource Depletion Index: Resource Depreciation/Sector Domestic
Product (Agriculture-forestry-fisheries sector) 26
•
ACKNOWLEDGMENTS
Two of the authors of this report—Dr. Ham-
mond and Dr. Adriaanse—participated in the Pro-
ject on Indicators of Sustainable Development of
the Scientific Committee on Problems of the Envi-
ronment (SCOPE), an international scientific
effort intended to contribute to the indicator
activities of the U.N. Commission on Sustainable
Development. An earlier version of this report
was reviewed by the SCOPE project and provided
background for an international policy meeting
on indicators of sustainable development hosted
by the Belgium and Costa Rican governments in
collaboration with SCOPE and the U.N. Environ-
ment Programme. Dr. Hammond and Dr.
Adriaanse have benefited from the advice and
comments of their international colleagues, includ-
ing Bedrich Moldan, Arthur Dahl, Peter
Bartelmus, Donella Meadows, Kirit Parikh, and
Manuel Winograd, through several revisions of
this work. The authors would also like to thank
John O'Connor, Ted Heintz, Don Rogich, Tim
Stuart, Dave Berry, Francisco Mata, David Pearce,
Wayne Davis, Brian Groombridge, and Rick Coth-
ern, all of whom provided valuable comments
and encouragement on earlier drafts of this report.
Our gratitude is also extended to those within
WRI who helped with this report—to Jonathan
Lash, Walt Reid, Alan Brewster, Paul Faeth, and
Dan Tunstall for their reviews, to Kathleen Cour-
rier for her skillful editing, to Maggie Powell for
preparation of figures, and to Sharon Bellucci for
desktop production and support throughout the
project. Of course, we alone bear responsibility
for the final result.
A.H.
A.A.
E.R.
D.B.
R.W.
FOREWORD
All across the United States, policy-makers
and pundits sit up and take notice when the Dow
Jones inches up, housing starts plummet, or unem-
ployment rates rise—and millions of Americans re-
think personal financial decisions. In every
country, leaders find changes in gross national
product (GNP) similarly riveting. These economic
indicators show the power of a single number
when its importance is widely understood. Yet,
no remotely similar numbers exist to indicate how
the environment is faring.
A significant attempt to bridge this knowl-
edge gap is Environmental
Indicators:
A
System-
atic Approach to Measuring
and
Reporting
on
Environmental
Policy Performance
in the
Context
of
Sustainable Development
by Allen
L.
Hammond,
director of
WRI's
Resource and Environmental In-
formation program; Albert Adriaanse, senior minis-
terial advisor to the Netherlands' Directorate for
the Environment; Eric Rodenburg, WRI senior pol-
icy analyst; Dirk Bryant, WRI policy analyst; and
Richard Woodward of the University of Wiscon-
sin. The authors begin by laying out a concep-
tual approach for producing "highly aggregated
indicators"—that is, for turning mountains of
data into a set of simple, significant, and user-
friendly tools.
The authors note the special utility of environ-
mental indicators in democratic countries, where
electorates push governments to act on perceived
problems. Indeed, they maintain, creating environ-
mental indicators that the public can easily grasp
is the surest way to compel high-level government
attention—both to the environment and to the effi-
cacy of policies for protecting or restoring it. Be-
sides illustrating environmental trends, indicators
can be designed to measure how well (or how
poorly) policies work, implicitly pointing the way
toward better approaches. In most countries,
though, policy-makers and the public are equally
in the dark when it comes to timely warnings
about whether policies are taking the nation in
the right direction.
There are exceptions, of course—most nota-
bly the Netherlands. As the authors demonstrate,
the Dutch have made good use of indicators
based on strong national goals to curb such envi-
ronmental problems as ozone depletion, climate
change, and acid rain. Since 1991, the Dutch gov-
ernment has published indicators showing how
the nation's contribution to such problems has
changed from one year to the next. When com-
bined with targets for future performance, these in-
dicators show Dutch citizens how effectively
current policies are helping to improve both the
Dutch environment and global conditions, and
how far they have yet to go. As this report docu-
ments, the Dutch experience also shows that
when conditions don't improve, indicators stimu-
late the search for improved policies.
WRI's experience also testifies to the efficacy
of indicators as agents of change. In 1990, WRI's
World Resources
report published data showing an
acceleration in the rate of tropical deforestation
and summed up in a single indicator for each
country—the Greenhouse Gas Index—the poten-
tial impact on global warming of both deforesta-
tion and fossil energy use. The results, admittedly
controversial, attracted worldwide attention and
helped to focus the efforts of scientists and govern-
ment policy-makers on deforestation's possible
role in climate change.
Environmental
Indicators
will not be the last
word on this new field. On the contrary, it deliber-
ately proposes bold ideas to spark dialogue on
which data to compile and how to massage a
mass of facts into a handful of meaningful num-
bers that signal whether environmental problems
are getting better or worse. The authors acknow-
ledge the work of others laboring in the field—
not only the Canadian and Dutch governments
and the Organization for Economic Cooperation
and Development, but also a growing number of
other institutions and university researchers. The
United Nations Commission on Sustainable Devel-
opment, for one, is exploring ways to create
"sustainable development indicators;" so is the
U.S.
Government.
Dr. Hammond, Dr. Adriaanse, and their col-
leagues argue that environmental indicators are
the best place to begin. They suggest that those
they describe are good candidates to become the
environmental components of sustainable develop-
ment indicators some years down the road. But
first things first, they say. Economic and social in-
dicators already influence policy. What's utterly
missing is a set of simple and unambiguous sig-
nals of how human activities are affecting the en-
vironment.
Environmental
Indicators
extends WRI's ear-
lier work on indicators—including such reports as
Biodiversity
Indicators for
Policy-makers—and
the
analyses set forth in our biennial series of World
Resources
reports.
We are continuing our indicator
research program, focusing on biodiversity and
the coastal environment—critical resources for
which we need better means of assessing our
problems or our progress.
We would like to thank The Florence and
John Schumann Foundation for an initial grant
that enabled WRI to begin its indicator research,
and express our appreciation to the U.S. Environ-
mental Protection Agency, the Aeon Group Envi-
ronment Foundation/Environmental Information
Center-Japan, the Swedish International Develop-
ment Authority, and the Netherlands Ministry for
Foreign Affairs for continuing support of these ef-
forts.
We would also like to acknowledge the en-
couragement of this work by the United Nations
Environment Programme. We are deeply grateful
to this array of partners and sponsors for their
assistance.
Jonathan Lash
President
World Resources Institute
I. INTRODUCTION
The term "indicator" traces back to the Latin
verb indicare, meaning to disclose or point out, to
announce or make publicly known, or to estimate
or put a price on. Indicators communicate informa-
tion about progress toward social goals such as
sustainable development. But their purpose can
be simpler
too:
the hands on a clock, for example,
indicate the time; the warning light on an elec-
tronic appliance indicates that the device is
switched on.
As commonly understood, an indicator is
something that provides a clue to a matter of
larger significance or makes perceptible a trend or
phenomenon that is not immediately detectable.
(A drop in barometric pressure, for example, may
signal a coming storm.) Thus an indicator's signifi-
cance extends beyond what is actually measured
to a larger phenomena of interest.
Since the concern in this report is public pol-
icy issues and specifically the process of communi-
cating information to decisionmakers and to the
public, indicators are defined more precisely. Indi-
cators provide information in more quantitative
form than words or pictures alone; they imply a
metric against which some aspects of public pol-
icy issues, such as policy performance, can be
measured. Indicators also provide information in a
simpler, more readily understood form than com-
plex statistics or other kinds of economic or scien-
tific data; they imply a model or set of assumptions
that relates the indicator to more complex phe-
nomena.
Those who construct indicators for public pol-
icy purposes have an obligation to make explicit
both the metric and the underlying model inher-
ent in them. As used in this report, indicators have
two defining characteristics:
1
• indicators quantify information so its sig-
nificance is more readily apparent;
• indicators simplify information about com-
plex phenomena to improve communication.
Even though indicators are often presented in
statistical or graphical form, they are distinct from
statistics or primary data. Indeed, indicators and
highly aggregated indices top an information pyra-
mid whose base is primary data derived from
monitoring and data analysis.
(See Figure
1.) Indi-
cators represent an empirical model of reality, not
reality
itself,
but they must, nonetheless, be analyti-
cally sound and have a fixed methodology of
measurement.
Indicators also fulfill the social purpose of im-
proving communication, but can play a useful role
only where communication is welcomed, where
decisionmaking is responsive to information about
new social issues or the effectiveness of current
policies. In an international context, the need for
comparability in the way indicators are formulated
Figure 1. The Information Pyramid
and calculated becomes obvious. If every nation
calculated GDP in a different manner, this indica-
tor would be of little value.
Experience in public policy also illustrates sev-
eral additional characteristics of successful indicators:
• user-driven. Indicators must be useful to
their intended audience. They must con-
vey information that is meaningful to deci-
sionmakers and in a form they and the
public find readily understandable. Simi-
larly, they must be crafted to reflect the
goals a society seeks to achieve.
• policy-relevant. Indicators must be perti-
nent to policy concerns. For the national-
level indicators described in this report,
policy-relevant means not just technically
relevant, but also easily interpreted in
terms of environmental trends or progress
toward national policy goals.
• highly-aggregated. Indicators may have
many components, but the final indices
must be few in number; otherwise deci-
sionmakers and the public will not readily
absorb them. How much indicators should
be aggregated depends on who is to use
them and for what.
Indicators can be used for many purposes at
many levels—community, sectoral, national, or in-
ternational. All are important, but in this report dis-
cussion is restricted to indicators that can support
national or international decisionmaking. These in-
dicators can guide national decisionmaking and fo-
cus top-level policy attention. Those gauging
national performance explicitly can show citizens
and decisionmakers alike whether trends are in the
desired direction and, hence, whether current poli-
cies work. Indicators can also provide a frame-
work for collecting and reporting information
within nations and for reporting national data to
such international bodies as the United Nations
Commission on Sustainable Development. Indica-
tors can provide guidance to those organizations
on needs, priorities, and policy effectiveness.
The choice of indicators depends not only on
the desired purpose—on the goals a nation seeks
to achieve—but also on the audience. The indica-
tors discussed in this report are intended to improve
national policy and decisionmaking—specifically,
the identification of environmental problems, policy
formulation and target setting, and, especially, policy
evaluation. The obvious audience comprises na-
tional and international decisionmakers. Since public
opinion shapes democratic decisionmaking, the pub-
lic is also an important audience for national per-
formance indicators. Indeed, the power of economic
and social indicators to shape public opinion com-
pels high-level officials to take action when, for ex-
ample, the GDP declines or the unemployment
index rises.
Since the United Nations Conference on Envi-
ronment and Development in 1992, sustainability
has become a widely shared goal. Although infor-
mation can provide an improved basis for decision-
making and gauging progress, accountability is
possible only if goals and measures of progress are
explicit. Appropriately formulated indicators—as
defined in this report—can provide such measures,
enhancing the diagnosis of the situation and mak-
ing progress or stalemate obvious to all.
Sustainability involves—at a minimum—inter-
acting economic, social, and environmental fac-
tors.
Progress toward sustainability thus requires
directing policy attention to all three. But analysts
don't agree on whether existing economic and so-
cial indicators—such as GDP, the consumer price
index, or the unemployment index—are useful
measures of progress toward sustainable develop-
ment and so far no consensus has formed on indi-
cators of sustainable development. There is not
even agreement on which conceptual framework
is best for developing such indicators—a question
raised later in this report.
That said, many highly aggregated economic
and social indicators have been widely adopted
and are frequently reported. They focus public at-
tention and influence national and international
policy decisions for better or worse. But there are
virtually no comparable national environmental in-
dicators
to
help decisionmakers or the public
evaluate environmental trends
or
assess the effec-
tiveness
of
national efforts to maintain environ-
mental quality. True,
local
air quality indicators
or
smog indices
of
one kind
or
another are in com-
mon use
in a
number
of
industrial countries, but
only
a
handful
of
indicators are widely adopted
and systematically reported. Even the environ-
mental indicators developed and compiled by the
OECD are not routinely and publicly reported by
national governments
in
most OECD countries
or
by most international development organizations.
Consequently, environmental policy issues have
often been overlooked
at
the highest levels of na-
tional and international decisionmaking,
2
and virtu-
ally nowhere is accountability for environmental
decisionmaking as high as it is for economic and
social issues.
This report attempts to lay a basis for environ-
mental indicators
in
the context
of
sustainable de-
velopment.
It
briefly surveys past efforts
to
develop such indicators and reports evidence that
they can influence policy decisions. However,
it
also suggests that indicators based on conven-
tional environmental data won't capture many
environmental issues key to sustainable develop-
Many highly aggregated economic
and social indicators have been
widely
adopted,
but there are
virtually no comparable national
environmental
indicators to help
decisionmakers or the public
evaluate environmental trends.
ment and identifies the need for additional envi-
ronmental indicators and for more highly aggre-
gated measures.
It
suggests new approaches
for
formulating these indicators and illustrates how
such approaches might be carried out. Nonethe-
less,
this report is
a
work
in
progress:
it
also con-
tains ideas and indicator concepts that are
preliminary,
in
the hope that they will stimulate
discussion and further work.
(The
indicators
proposed here
can be under-
stood
as candidates for
the
environmental
compo-
nents of sustainability
indicators.
As
such,
their
interaction with
social
and economic factors is im-
portant and
is so
noted in the text where links
exist
to specific economic sectors
or
social
concerns.)
II.
BACKGROUND AND CONTEXT
Growing concern over environmental issues
in recent decades drives the need for more com-
prehensive and reliable environmental informa-
tion. It has also generated "State of the
Environment" efforts in many countries and in
such international organizations as the U.N. Envi-
ronment Programme to provide, analyze, and re-
port on scientifically-based environmental
information. Still neither decisionmakers nor the
public have been able to easily interpret large
quantities of new environmental data. To simplify
information and thus to improve communication,
the Canadian government began developing envi-
ronmental indicator concepts in the late 1980s. In
1987,
the Dutch government initiated similar
work. After a G-7 Economic Summit in 1989, the
seven economic powers asked the OECD to de-
velop environmental indicators. Pioneering work
by the Canadian and Dutch governments and by
the OECD ensued.
3
'
4
'
5
International interest in the environment and
in sustainable development issues hit a new peak
at the 1992 United Nations Conference on Environ-
ment and Development in Rio de Janeiro. The Dec-
laration of
Rio
de Janeiro on Environment and
Development
emphasized the need for sustainabil-
ity and for respect for the precautionary principle
to protect the environment; Agenda 21 called for
the development of indicators.
(See
Box
1.,
Formal
Commitments at
the Earth
Summit.)
WRTs involvement in environmental indicator
research began in the late 1980s. In 1991, it sur-
veyed more than 100 organizations and carefully
reviewed the literature. At that time, it found that
fewer than a dozen organizations were working
on environmental or sustainable development indi-
cators at a national or international level. In 1992,
WRI organized and hosted an international work-
shop on environmental indicators to discuss con-
cepts,
methods, and tentative approaches; the
attendees concluded that it was premature at that
time to attempt a synthesis but pointed out the need
for innovative approaches and experimentation.
In 1993, WRI hosted Albert Adriaanse of the
Dutch Ministry of Housing, Physical Planning, and
Environment for a month's working visit that be-
gan a collaboration leading to this report. Later
that year, the United Nations Statistical Division
(UNSTAT) and the United Nations Environment
Programme (UNEP) organized a Consultative Ex-
pert Group Meeting on Environmental and Sustain-
able Development Indicators in Geneva to survey
the approaches to indicator development being
pursued by many organizations. By 1994, the
number of conferences and workshops on envi-
ronmental or sustainable development indicators
had grown enormously, as had the number of or-
ganizations pursuing indicator work; national or re-
gional initiatives were launched in Europe (by the
European Commission for Europe), in the United
States, and in many other countries. Notable
among more recent meetings was a technical
workshop convened by the World Bank in late
1994 to find common ground on approaches to
sustainable development indicators and, in early
1995,
an international policy conference hosted by
the Belgian and Costa Rican governments in con-
nection with UNEP and the Scientific Committee
on Problems of the Environment (SCOPE) to seek
consensus on the need for and the uses of indica-
tors internationally. The United Nations Commis-
sion on Sustainable Development (UNCSD)
agreed that indicators of sustainable development
would be discussed at its third session in 1995.
Parallel to these efforts were attempts to re-
form the GDP and other economic indicators to
better take environmental concerns into account.
Pioneering work at
WRI
and at the World Bank
helped to launch what is known as environmental
or "green" national accounting or as natural re-
source accounting, which adjusts national eco-
nomic accounts to reflect pollution costs and the
depletion of natural resources. The basic idea ih
green accounting is that the depletion of nature's
capital—natural resources—has a real cost to soci-
ety and should be treated in national accounts in
Box 1. I
;
orma! Commitments at the Earth Summit
Principle -i of the Kin Declaration stales:
'In order lo achieve sustainable development, environmental protection shall consti-
tute an integral pail of the developmental process and cannot be considered in isola-
tion from it."
Principle
IT
of the Declaration states:
"In order to protect the environment, the precautionary approach shall he widely ap-
plied by slates according lo their capabilities. Where there are threats of .serious or irre-
versible damage, lack of full scientific certainty shall not be used as a reason for
postponing cost-effective measures to prevent environmental degradation."
Agenda 21 comments .specifically on the need for indicators in Chapter 'it):
"Indicators of sustainable development need to be developed to provide, solid bases
for decisionmaking at all levels and to contribute lo a self-regulating suslainabilily of in-
tegrated environment and development systems."
This chapter also recommends that, the United Nations system work with other relevant organizations
lo develop a harmonized set of indicators of sustainable development.
the same way as the depletion of economic capi-
tal assets. Support for this idea was immediate. It
was endorsed in Agenda
21,
which in Chapter 40
calls for "establishing systems for integrated envi-
ronmental and economic accounting," and a pro-
posed system of such accounts has been
published by the United Nations Statistical Office
as the System of Integrated Environmental and
Q
Economic Accounting or
SEEA.
So far, no country
has yet greened its GDP, even though preliminary
studies of individual countries show that the GDP
would be more accurate and useful if such envi-
ronmental corrections were included. In any
event, the SEEA accounts can also be used to cal-
culate environmental indicators, as illustrated later
in this report.
In addition to adjustments to economic indica-
tors,
purely economic approaches have been used
to calculate measures of sustainability. Researchers
at University College-London, for example, have
developed widely used concepts of "weak" and
"strong" sustainability.
9
(See
Chapter 9.)
In recent years, the importance of "human
capital"—human and social development—to over-
all development has been emphasized by the Hu-
man Development Index pioneered by the U.N.
Development Programme.
1
So too, indicators of
sustainable development must also reflect the de-
gree to which human needs—including that for a
safe,
healthy, and productive environment—are
met. Thus, measures of environmental impacts on
human health and welfare are key to sustainabil-
ity—either as environmental indicators or as com-
ponents of social indicators. Equally important are
measures of the degree to which exposure to pol-
lution or access to clean water and clean air vary
among social and economic groups, as discussed
later.
III.
HOW
INDICATORS CAN INFLUENCE ACTION:
TWO CASE STUDIES
The environmental policy performance indica-
tors discussed
in
Chapter 5 have been published
annually since 1991
by the
Dutch government.
These indicators have increased Dutch awareness
of environmental issues, influenced policy deci-
sions,
and
spurred planning efforts
to
reduce envi-
ronmental pressures.
When first published,
the
indicators attracted
considerable attention. Government officials,
the
private sector,
and
citizens
all
found such quantita-
tive description
of
environmental trends intrigu-
ing. Initial discussions centered
on the
relevance
of the trends presented
and the
methods used
to
quantify
and
construct
the
indicators.
As
they be-
came accepted
by
decisionmakers
and
others
as
a
proper model
or
representation
of
the pressures
driving these environmental issues,
the
indicators
began
to
exert
a
significant influence
on
policy-
making; they were used
to
help
set the
policy
agenda
on
environmental issues
and to
measure
policy success
or
failure.
As users grew more familiar with
the
indica-
tors
and the
methodology used
to
construct them,
attention focused
on the
component pres-
sures—whether specific gases
or
sectoral activi-
ties—that contributed
to the
overall trend
described
by
a
given indicator. They thus became
a tool
for
setting detailed cleanup priorities. Users
also began
to use the
whole information sys-
tem—symbolized
by the
information pyramid
(Figure 1)—interactively
to
assess
the
effects
of
proposed
or
planned policy measures
on the
trend
of
environmental pressures represented
by
the indicators.
In
short,
the
information system
has
become
a
kind
of
model
for
exploring alternative
policies.
As
one
example, indicators have deeply influ-
enced policy-making
in the
Netherlands
on the is-
sue
of
environmental acidification. Here, interest
in
the
overall trend shown
by the
indicator—and
the wide difference between current emissions
and
the
level judged
to be
sustainable over
the
long term—prompted
the
Dutch government
to
set progressively stricter policy targets
for
reduc-
ing emissions
of
each
of
the primary acidifying
gases (SO
2
, NO
X
, NH
3
) covered
by the
indicator.
Interest in the overall trend
shown by one indicator—and the
wide difference between current
emissions and the level
considered sustainable over the
long term—prompted the Dutch
government to set progressively
stricter policy targets.
A second example concerns
the
dispersion
of
toxics into
the
environment. Typically, targets
for
reductions
in
emissions
are set in
negotiations
with
the
relevant economic sectors.
As the
indica-
tor has helped
the
private sector
to
appreciate
how
its
various activities contribute
to the
total
burden
of
toxics released within
the
Netherlands,
attitudes have changed. Recently,
the
Minister
of
Housing, Physical Planning,
and the
Environment
and representatives
of
industry have signed volun-
tary agreements
to
significantly reduce toxic emis-
sions.
Welcome alternatives
to
regulation, these
agreements harness
the
knowledge
and
creativity
of the private sector
in
designing mitigation meas-
ures
to
meet policy targets. Such agreements
are
possible only with
the
industry's active participa-
tion
and
involvement—owed
in
large part
to the
visibility
of
the environmental indicators
and the
"transparency" of the information system on
which they rest.
The construction and regular publication of
environmental indicators related to policy perform-
ance in the Netherlands has helped
it
progress to-
ward sustainability. By quantifying key trends and
compressing enormous amounts of data into sim-
ple,
comprehensible graphical indicators, this proc-
ess has moved the policy debate toward specific
mitigation measures and inspired additional policy
measures where progress was limited. The Dutch
experience has attracted wide interest in other
countries.
In 1990, WRI published the first estimates of
greenhouse gas emissions for all major countries.
11
Although background data were also given, the es-
timates were presented as an aggregated green-
house index—an indicator that summed up for
each country the overall impact on the atmos-
phere of its annual emissions of the major green-
house gases. The estimates attracted widespread
press attention and became very controversial,
partly because the index allowed users to com-
pare national emissions. Yet, they also helped pro-
voke worldwide debate over the causes of such
emissions, such as the combustion of
coal,
oil,
and other fossil fuels and the clearing and burning
of tropical forests, inspiring research, and influenc-
ing policy actions in several countries.
WRI has continued to publish the greenhouse
index and to note trends in greenhouse gas emis-
sions and their potential implications for climate
change. With the passing of
time,
the controversy
has faded: estimates once fiercely contested now
attract no unusual attention. Indeed, countries that
have signed the Climate Convention have commit-
ted themselves to calculate and report their own
emissions. Yet, the controversy and subsequent
changes in both received wisdom and public poli-
cies illustrate the power of indicators to communi-
cate and to influence public discourse.
One source of the initial controversy was the
methodology used to estimate the cumulative
ef-
fects of greenhouse gas emissions on the atmos-
phere. In the absence of an established scientific
methodology, WRI adopted
a
simple empirical
method that differed from the method sub-
sequently published by the Intergovernmental
Panel on Climate Change, an international scien-
tific collaboration. It later turned out, however,
that the two methods yielded closely comparable
results.
12
Indicators, as this report emphasizes, are
a simplified model of reality, but in this instance
the model was quite accurate.
A second source of controversy came from
strenuous objections by Brazil to estimates of the
rate of deforestation in that country, which made
its total emissions high. The estimates came from
an unpublished study done by
a
Brazilian scien-
tific agency for the amount of deforestation
in
1987—the year for which emissions were esti-
mated for all countries, but also
a
year, as it hap-
pened, in which forest clearing and burning in
Brazil were more extensive than ever before. The
satellite technique used in the 1987 estimates was
criticized as imprecise, and Brazil subsequently
found
a
more reliable technique. On the other
Estimates of greenhouse gases
attracted widespread press
attention and became very
controversial,
partly because the
index allowed users to compare
national
emissions.
Yet,
this
indicator also helped provoke
worldwide debate, inspiring
research and influencing policy
actions in several countries.
•
hand, even reducing the estimated deforestation
in 1987 by 40 percent would not have significantly
altered the result: Brazil would still have ranked
among the highest three or four nations in green-
house gas emissions that year. How much the pub-
lic attention given deforestation rates after the
greenhouse index was published affected Brazil's
subsequent actions is uncertain, but new and
tougher policies did combine with better enforce-
ment and wetter weather, which reduces burning,
to dramatically cut deforestation rates in sub-
sequent years.
A third source of controversy was a com-
plaint from the Centre for Science and Environ-
ment, an NGO in India. Analysts at the Centre
used WRI's estimates of greenhouse gas emissions
to calculate an alternative index of "excess emis-
sions,"
taking into account the Earth's natural abil-
ity to sequester greenhouse gases and allocating
this "global sink" to countries in proportion to
theirpopulationsize.
13
The Centre's index—and
charges that more standard ways of calculating
emissions represented "environmental colonial-
ism"—engendered a debate over sinks and addi-
tional research on these poorly understood
aspects of the carbon cycle.
As this experience illustrates, indicators that
can capture complex environmental data in an
easy-to-communicate form can heighten public
awareness and inspire policy action.
IV. ORGANIZING ENVIRONMENTAL INFORMATION:
INDICATOR TYPES, ENVIRONMENTAL ISSUES,
AND A PROPOSED CONCEPTUAL MODEL
TO GUIDE INDICATOR DEVELOPMENT
The goal of environmental indicators is to
communicate information about the environ-
ment—and about human activities that affect it
—in ways that highlight emerging problems and
draw attention to the effectiveness of current poli-
cies.
Indicators must tell us, in short, whether
things are getting better or worse. To tell this
story, an indicator must reflect changes over a
period of time keyed to the problem, it must be
reliable and reproducible, and, whenever possi-
ble,
it should be calibrated in the same terms as
the policy goals or targets linked to it.
Many human activities have environmental
consequences, and these consequences can be nu-
merous and wide-ranging. The information base
used to build environmental indicators must span
them all, so the data are sometimes confusing. For
this reason, a conceptual framework is needed to
structure diverse environmental information and
to make it more accessible and intelligible to deci-
sionmakers and the general public. Such a struc-
ture can also reveal data gaps, thus guiding data
collection efforts.
A widely used framework for environmental
indicators arises from a simple set of questions:
What is happening to the state of the environment
or natural resources? Why is it happening? What
are we doing about it? Indicators of changes or
trends in the physical or biological state of the
natural world (state indicators) answer the first
question, indicators of stresses or pressures from
human activities that cause environmental change
(pressure indicators) answer the second, and meas-
ures of the policy adopted in response to environ-
mental problems (response indicators) answer the
third.
(See Figure
2.) More specifically, state indica-
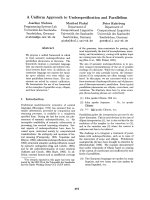
Figure
2
. Pressure-State-Response F
Human subsystem
1
1
I population Mjl>sy<;fem
1
1
^
ramework for Indicators
pollution
PRESSURE
resource depletion
natural feedbacks
RESPONSE
societal response
human system feedback
Environmental subsystem
c
iriifi.u
[
cviviionmoMtal
compartments
I
1
1
s iArr
I
inifKK
i-s
ocosystonis
tors measure the quality or "state" of the environ-
ment, particularly declines attributable to human ac-
tivities. Examples include measures of stratospheric
ozone concentrations, of urban air quality, or of
stocks of fish. Pressure indicators, in contrast, show
the causes of environmental problems: depletion
of natural resources through extraction or overhar-
vesting, releases of pollutants or wastes into the en-
vironment, and interventions such as infrastructure
development or the conversion of natural ecosys-
tems to other uses. In other words, these indicators
measure environmental stress.
Response indicators gauge the efforts taken
by society or by a given institution to improve the
environment or mitigate degradation. Thus they
measure how policies are implemented by track-
ing treaty agreements, budget commitments,
research, regulatory compliance, the introduction
of financial incentives, or voluntary behavioral
changes.
This pressure-state-response framework, fol-
lowing a cause-effect-social response logic, was
developed by the OECD from earlier work by the
Canadian government. Increasingly widely
accepted and internationally adopted, it can be
applied at a national level (as in this report), at
sectoral levels, at the level of an individual indus-
trial firm, or at the community level.
Pressure indicators measure policy effective-
ness more directly—whether emissions increase
or decrease, whether forest depletion waxes or
wanes, and whether human exposure to hazard-
ous conditions grows or shrinks. Accountability
for the pressures each country exerts on the en-
vironment is clear—as in the case of the amount
of ozone-degrading gases emitted. These indica-
tors are not only descriptive. They can also pro-
vide direct feedback on whether policies meet
stated goals because they are based on meas-
ures or model-based estimates of actual behav-
ior. Pressure indicators are thus particularly
useful in formulating policy targets and in evalu-
ating policy performance. They can also be
used prospectively to evaluate environmental im-
pacts of socioeconomic scenarios or proposed
policy measures.
Response indicators measure progress toward
regulatory compliance or other governmental ef-
forts,
but don't directly tell what is happening to
the environment. As a practical matter, data to
construct indicators is usually most available for
pressure indicators and sparsest for response
indicators.
For practicality's sake, most efforts to de-
velop environmental indicators have chosen to
focus on a limited set of key environmental issues.
The OECD, for example, compiles and reports in-
dicators for eight environmental issues. The advan-
tages of working from a common international list
should be obvious, even though the importance
of any single issue will vary by region or country.
To keep indicators as simple as possible, a
single measure is usually selected for each major
environmental issue. Often a considerable degree
of aggregation is required. For instance, emissions
A widely used framework for
environmental indicators arises
from a simple set of questions:
What is happening to the state of
the environment or natural
resources? Why is it happening?
What are we doing about it?
of many greenhouse gases can be combined
—through appropriate weights based on physical
properties of the gases and models of their life-
times in the atmosphere—to yield a single indica-
tor of "equivalent" emissions. In a similar way,
data on emissions of various nutrients that cause
E
lakes and estuaries to eutrophy can be combined
based on their chemical behavior, and measures
of the depletion of various resources can be aggre-
gated using economic valuation techniques.
Aggregation of similar data related to a sin-
gle environmental issue is quite common, and,
though experts can debate which weighting
scheme to use, usually aggregation can be based
on generally accepted scientific or economic
principles.
Core lists of environmental issues—and of
relevant indicators—have been and are being de-
veloped by several organizations, building on the
OECD's initial work. Such indicators can be organ-
ized within the pressure-state-response framework
into a matrix of indicators. Figure 3 is adapted
from such a matrix under consideration by UNEP.
Figure 4 shows a similar matrix adapted from one
being considered by the World Bank.
Although they organize or structure environ-
mental indicators (and have been extended to so-
cial and economic indicators as well), such arrays
or matrices still provide an unwieldy amount of in-
formation. Accordingly, they may not simplify in-
formation enough for decisionmakers and the
public. For this reason, a still higher level of aggre-
gation or structuring is recommended: grouping
environmental issues into a few broad categories
based on a conceptual model of human-environ-
ment interaction. The indicators presented in this
report give a preliminary sense of how such aggre-
gation might work and what the result might be,
Figure 3. Matrix of Environmental Indicators
Issues
Climate Change
Ozone Depletion
Eutrophication
Acidifcation
Toxic Contamination
Urban
Env.
Quality
Biodiversity
Waste
Water Resources
Forest Resources
Fish Resources
Soil Degradation
Oceans/Coastal
Zones
Environmental Index
Pressure
(GHG) emissions
(Halocarbon) emissions;
production
(N,P
water,
soil) emissions
(SO
X
,
NO
X
,
NH
3
)
emissions
(POC, heavy metal)
emissions
(VOC, NO
X
,
SOx)
emissions
Land conversion; land
fragmentation
Waste generation
mun'pal,
ind.
agric.
Demand/use intensity
resid./ind./agric.
Use intensity
Fish catches
Land
use
changes
Emissions;
oil
spills;
depositions
Pressure index
State
Concentrations
(Chlorine) concentrations;
O3 column
(N,
P, BOD)
concentrations
Deposition; concentrations
(POC, heavy metal)
concentrations
(VOC, NO
X
,
SOx)
concentrations
Species abundance comp.
to
virgin area
Soil/groundwater quality
Demand/supply ratio;
quality
Area
degr.
forest;
use/sustain, growth ratio
Sustainable stocks
Top soil loss
Water quality
State index
Response
Energy intensity;
env. measures
Protocol sign.;
CFC
recovery; Fund contrib'n
Treatm. connect.;
investments/costs
Investments; sign,
agreements
Recovery hazardous
waste; investments/costs
Expenditures; transp.
policy
Protected areas
Collection rate; recycling
investments/cost
Expenditures; water
pricing; savings policy
Protected area
forest, sustain, logging
Quotas
Rehabilitation/protection
Coastal zone managment;
ocean protection
Response index
Source:
OECD
and
UNEP
1
Figure 4. Matrix of Environmental Indicators
; Issues
I. Source Indicators
1.
Agriculture
a. Land Quality
b.
Other
2.
Forest
3.
Marine Resources
4.
Water
5.
Subsoil Assets
a. Fossil Fuels
b.
Metals & Minerals
n. Sink or Pollution
Indicators
1.
Climate Change
a. Greenhouse Gases
b.
Stratospheric Ozone
2.
Acidification
3.
Eutrophication
4.
Toxification
m. life Support Indicators
1.
Biodiversity
2.
Oceans
3.
Special Lands(e.g.,wetland)
IV. Human Impact Indicators
1.
Health
a. Water Quality
b.
Air Quality
c. Occupat'l Exposures,etc.
2.
Food Security & Quality
3.
Housing/Urban
4.
Waste
5.
Natural Disaster
Pressure
Value Added/Gross Output
Human-Induced Soil Degrad.
Land Use Changes, Inputs for
EDP
Contaminants, Demand for
Fish as Food
Intensity of Use
Extraction Rate(s)
Extraction Rate(s)
Extraction Rate(s)
Emissions of CO
2
Apparent Consumption of
CFCs
Emissions of SOx, NOx
Use of Phosphates(P),
Nitrates(N)
Generation of hazardous
waste/load
Land Use Changes
Threatened, Extinct species
% total
Burden of Disease
(DALYs/persons)
Energy Demand
Population Density
(persons/km )
Generation of industrial,
municipal waste
State
Cropland as % of wealth
Climatic Classes & Soil
constraints
Area, volumes, distribution;
value of forest
Stock of Marine Species
Accessibility to Pop.
(weighted % of total)
Subsoil assets % wealth
Proven Reserves
Proven Reserves
Atmosph. Concentr. of
Greenhouse Gases
Atmosph. Concentr. of CFCs
Concentr. of pH, SO
X
, NOx in
precipitation
Biological Oxygen Demand,
P,
N in rivers
Concentr. of lead, cadmium,
etc.
in rivers
Habitat/NR
Life Expectancy at birth
Dissolved Oxygen, faecal
coliform
Concentr. of particulates,
SO2,
etc.
Accumulation to date
Response
Rural/Urban Terms of Trade
In/Output ratio, main users;
recyc. rates
% Coverage of Int'l
Protocols/Conv.
Water efficiency measures
Material balances/NNP
Reverse Energy Subsidies
In/Output ratio, main users;
recyc. rates
Energy Efficiency of NNP
% Coverage of Int'l
Protocols/Conv.
Expenditures on Pollution
Abatement
% Pop. w/waste treatment
% Petrol unleaded
Protected Areas as %
Threatened
% NNP spent on Health,
vaccination
Access to safe water
% NNP spent on Housing
Exp.
on collect. & treatmt,
recyc. rates
Source: The World Bank
Figure 5. A Model
of
Human Interaction with the Environment
Environment
impact on people
Human Activity
Economy
waste, pollution,
And dissipative use
H
torosysttMTi
LiKTo.ichmenl
^M
H
Ecosystem services
thus illustrating the approach's feasibility. Highly-
aggregated indicators, by compressing and simpli-
fying information, communicate more effectively.
If all the assumptions and sources
of
data are
clearly identified, and the methodology is explicit
and publicly reported, the index can readily be
disaggregated to the separate components and
no
information is lost.
Indicators are models
of
a more complex real-
ity, and so are systems
of
indicators. The appropri-
ateness
of
any model can be better judged
if
it
is
explicit. Here we propose an explicit conceptual
model
to
guide the development
of
environmental
indicators, acknowledging that it does not repre-
sent the only way to organize environmental infor-
mation.
(See Figure
5)
This model describes four interactions be-
tween human activity and the environment:
• source: from the environment, people de-
rive minerals, energy, food, fibers, and
other natural resources
of
use
in
economic
activity, thus potentially depleting these re-
sources or degrading the biological systems
(such as soils) on which their continued
production depends;
• sink: natural resources are transformed by
industrial activity into products (such
as
pesticides) and energy services that are
used or disseminated and ultimately dis-
carded
or
dissipated, thus creating pollu-
tion and wastes that (unless recycled) flow
back into the environment;
• life support: the earth's ecosystems—espe-
cially unmanaged ecosystems—provide es-
sential life-support services, ranging from
the decomposition
of
organic wastes
to
nu-
trient recycling to oxygen production to the
maintenance
of
biodiversity;
as
human ac-
tivity expands and degrades
or
encroaches
upon ecosystems,
it
can reduce the environ-
ment's ability to provide such services;
• impact on human welfare: polluted air
and water and contaminated food affect hu-
man health and welfare directly.
For each of these types of interactions, com-
posite indicators can be constructed. For instance,
the source and sink type of interaction are closely
related to organized economic activity and can be
linked with specific sectors that play major roles.
Economic sectors that withdraw materials from the
environment include the managed ecosystems (ag-
riculture, forestry, fisheries), energy, construction,
and manufacturing (including mining). Pollutants,
waste, and materials dissipation stem mainly from
manufacturing (including mining), energy produc-
tion and consumption, agriculture, the transport
sector, and the municipal and household sectors.
Environmental indicators for both source and sink
interactions thus potentially contain important in-
formation about the sustainability of certain eco-
nomic sectors; indeed, a source indicator can be
stated in economic terms (namely, depletion) as
well as physical terms. Chapters V and VI describe
how highly aggregated sink indicators can be sum-
marized in a composite pollution index and
how the sustainability of resource use for many
types of resources can be summarized in a
resource depletion index.
The third type of interaction described in the
model above is closely related to the ability of eco-
systems to provide essential ecosystem services, in-
cluding the maintenance of biodiversity. These
issues are of growing importance—witness the inter-
national agreements formalized in the Biodiversity
Convention—but almost no policy-relevant indica-
tors exist. Chapter VII describes how such indicators
for a central life-support function, maintenance of
biodiversity, might be constructed from a geo-refer-
enced database and summarized for each broad eco-
system type in a composite biodiversity measure, the
ecosystem risk index.
The fourth type of interaction is concerned
directly with environmental conditions that might
affect human health and welfare. Closely related
to social indicators, environmental indicators
keyed to this interaction thus potentially contain
important information about social conditions and
development successes or failures. Such indicators
could be summarized in an index of environ-
mental impact on human welfare.
If the methodology described earlier is ap-
plied to this model, specific leading issues for
each of the component interactions can be identi-
fied. In principle, indicators can be developed for
each such issue to describe environmental pres-
sures from human activity, the state of the environ-
ment, and the policy response. Here we focus on
pressure indicators, partly because they best sat-
isfy the criteria of policy-relevance and interna-
tional commonality across countries and because
Box 2.
l-our
Key \i>,nregjle Indie
• pollution
• resource depletion
• ecosystem risk
• environmental impact on
welfare
a tors
human
they provide the basis for assessing policy per-
formance. Nonetheless, state and response indica-
tors may be immensely important, particularly in
developing countries concerned primarily with
identifying environmental issues and formulat-
ing environmental policies, or in international in-
stitutions trying to gauge their program
effectiveness.
These indices track four broad types of hu-
man interaction with the environment. As such,
they suggest a comprehensive yet easily compre-
hended basis for national reporting and policy
evaluation. The four indices are aggregated from
more than 20 primary environmental indicators,
many of which are themselves aggregations of a
number of similar data series—compressing a lot
of information into a simple message. These four
indices and their supporting indicators can be re-
garded as the environmental pressure element of
a pressure-state-response matrix. They are also,
we submit, a possible basis for assessing national
environmental policies that is practical, covers the
environmental concerns that are most critical to
sustainability, and can easily be communicated to
policy-makers and the public.
V. POLLUTION/EMISSION:
ILLUSTRATIVE CALCULATIONS OF INDICATORS
AND OF A COMPOSITE INDEX FOR THE NETHERLANDS
In human activities that treat the environment
as a sink, what most needs to be measured are
emissions, wastes, and dissipative uses of materi-
als.
Such activities can degrade the environment in
various ways. Some create a global impact, others
primarily a local or regional impact. Those pollu-
tion issues, important mainly because they affect
human health and welfare, are discussed in a later
chapter. So here the focus is on phenomena that
primarily alter the character or health of the
Earth's physical or biological systems. Climate
change; depletion of the ozone layer; acidification
of soils and lakes; eutrophication of water bodies;
toxification of soils, water bodies, and ecosystems;
and the accumulation of solid wastes all fall into
this category. These problems are of importance
in the Netherlands, but other countries may give
highest priority to others.
Indicators for these six environmental issues
are illustrated along the lines taken by the Nether-
lands.
14
They are measured in physical units.
These indicators are already aggregated, since the
environmental pressures for each of the six all
stem from emissions or releases of more than one
material or substance. Because the environmental
effects of the components of a given indicator
vary, each type of contributing emission must be
appropriately weighted before emission can be to-
talled or aggregated to create an overall indicator
for a given issue. Halon 1301, for instance, dam-
ages the ozone layer more than ten times as much
as the reference substance CFC-11 and is
weighted accordingly. Based on comparable
weighting principles, a unit of measure has been
developed for each issue—an ozone-depletion
equivalent, for example. When the contributions
of each component are expressed in these units,
the effects of each can be compared and then
summarized in a single indicator.
The selection of contributing substances for a
given indicator is based on a compromise between
the need for completeness and the need for simplicity
in methodology and in data coEection. In practice,
only the principal contributing substances are selected
for each issue, though it
is
important to check that the
indicator
is
sufficiently representative and that no ma-
jor factor has been neglected.
The indicators are presented to be self-ex-
planatory. Each consists of a single graph—show-
ing the course of the total environmental pressure
measured by the indicator over time—one or
more policy targets, and a single percentage,
which is the percentage reduction in the pressure
required to reach the target. In the graph, the pres-
sure indicator and the policy target for that issue
are expressed in the same units, such as ozone-
depletion equivalents.
Emissions of greenhouse gases alter the com-
position of the Earth's atmosphere so that it traps
additional heat radiated by the earth, thus increas-
ing the likelihood of global warming. The main
greenhouse gases released by human activities are
carbon dioxide, methane, nitrous oxide, chlo-
rofluorocarbons (CFCs), and halons. Emissions of
any of these substances increase the atmosphere's
warming potential.
How much emissions of greenhouse gases
add to the potential for global warming depends
on how long they remain in the atmosphere be-
fore being removed or breaking down into other
compounds and on how well they absorb the
heat radiated by the earth. These two factors are
combined in the Global Warming Potential (GWP)
for each gas, which is used as a weighting factor
for emissions of that gas. The weighted summa-
tion of the Dutch annual discharge of
CO
2
,
CH4,
N
2
O,
and the Dutch use of
CFCs
and halons, ex-
pressed in CO
2
equivalents, forms the indicator for
climate change. In 1980, the Dutch contribution to
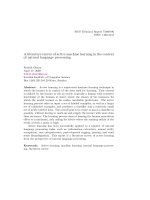
Figure 6.
300-
250-
200-
150-
100-
50-
Climate Change
carbon dioxide equivalent)
1980 1985 1990 1995
Indicator
— Actual
• Goal
•
2000 2005 2010
Figure 7.
20-
15-
10-
5-
Ozone Depletion
ozona depletion equivalents-thousand!
•
1980
\
\
1985 1990 1995
Indicator
>
— Actual
• Goal
2000 2005 2010
the greenhouse effect was approximately 286 of
these units; in 1991, approximately 239, a decline
of 16 percent in environmental pressure caused
by the discharge of greenhouse gases in the Neth-
erlands. The trend of the climate change indicator
is shown in Figure 6.
The aim of the Dutch policy is to reduce the
1988 discharge levels of greenhouse gases by more
than 50 percent by the year
2020.
The near-term
policy targets are to reduce emissions to 205 CO
2
equivalents by 1995 and to 195 by the year 2000.
The ozone layer blocks ultraviolet rays that
are harmful to people, flora, and fauna. Its deple-
tion is caused by pollution of the stratosphere by
substances that catalyze the decomposition of
ozone (O
3
). When this happens, ultraviolet radia-
tion increases. The compounds most damaging to
the ozone layer are chlorofluorocarbons (CFCs)
and halons, which may take 10 to 15 years to
reach it once released.
How damaging these ozone-depleting com-
pounds are depends on how long they reside in
the atmosphere and how readily their constituent
chemicals react to break down ozone. These two
factors are combined in an Ozone Depletion Po-
tential for each gas, which is used as a weighting
factor for emissions of that gas. The weighted sum-
mation of the Dutch use of CFCs and halons, ex-
pressed in ozone-depletion equivalents, forms the
indicator. In 1980, Dutch use and, consequently,
emissions, were estimated to be 20,000 of these
units.
By 1991, it had dropped to 8,721 units, a 56
percent decline in environmental pressure from
the emission of ozone-depleting substances. This
trend in the ozone depletion indicator is shown in
Figure 7.
The Dutch policy target is nearly complete
termination of production of ozone-depleting sub-
stances—to a level of 54 ozone-depletion equiva-
lents—by 1995. By the year 2000, the target goal
is zero production. The assumption here is that
the use and, consequently, the emissions of CFCs
and halons will follow the same trend as their
production.
Air pollution by substances that form acids
acidifies the environment. Acid deposition can di-
rectly damage buildings, materials, and plants. In-
direct damage occurs via acidification of the soil.
The three main acidic substances are sulphur diox-
ide,
nitrogen oxides, and ammonia; other acidic
components and ozone are not incorporated in
the indicator.
The potential environmental damage from
acidifying substances that are deposited in the soil
Figure 8. Acidification Indicator
7,000 -
6,000 -
5,000 -
4,000 -
3,000 -
2,000 -
1,000 -
o-
acidiftcation equivalent per hectare)
V
^ •
—
Actual
•
Target
-
Sustainabtlity Level
1990
1995
2000 2005
2010
Figure 9. Eutrophication Indicator
300 -
250 -
200 -
150 -
100 -
50 -
{eutrophication equivalent)
—Adual
^~X - SusUinability Level
1980 1985 1990 1995 2000 2005 2010
is expressed in units of acidification equivalents
per hectare per year. In 1980, deposition consisted
of 6,700 units; in 1991, the comparable figure was
4,100, reflecting a decline in the environmental
pressure from acidification of 39 percent. This
trend in the acidification indicator is shown in
Figure 8. Both foreign and domestic sources con-
tribute to acid deposition; in 1980 and 1989,
Dutch sources contributed 48 percent and 54 per-
cent, respectively, of total acidic deposition in the
Netherlands.
The policy target set by the Dutch govern-
ment is to reduce deposition to 4,000 acidification
equivalents by 1994, to 2,400 units by 2000, and
to 1,400 units by 2010. The sustainability level, or
the long-term target, is estimated to be 400 acidifi-
cation units. These targets relate to the total depo-
sition, which includes the foreign contribution.
Eutrophication of the environment occurs
when an excessive supply of plant nutrients dis-
rupt ecological processes in water bodies or in
soil. One manifestation of eutrophication is an un-
desirably large quantity of algae in ponds and
lakes,
which leads to a shortage of oxygen. Plant
species that thrive in low-nutrient environments
often disappear as a result of eutrophication—one
reason why heaths or peat bogs are becoming in-
creasingly overgrown with grass. In addition, ni-
trate levels in groundwater are now so high that
drinking water supplies are under threat. Phos-
phates and nitrogen compounds are the primary
substances that cause eutrophication; in the
Netherlands, the principal sources are manure, fer-
tilizer, wastewater, sewage sludge, dredge spoil,
and solid waste.
Releases of phosphates and nitrogen com-
pounds to the environment can be expressed in
units of eutrophication equivalents. In the indica-
tor, only releases from Dutch sources are in-
cluded. In 1980, such releases totalled 302 units;
in 1991, the amount was 273 units, a decline of 10
percent in environmental pressure resulting from
the discharge of the two main eutrophying sub-
stances. The trend in the eutrophication indicator
is shown in Figure 9-
The Dutch policy objective is to restore the
balance between the supply and removal of phos-
phates and nitrates in water and soil so as to safe-
guard the natural processes. The target for the
year 2000 is calculated to be 95 eutrophication
equivalents.
Many chemicals, heavy metals, radioactive sub-
stances and other toxic or hazardous substances