Fiscal decentralization and poverty alleviation in a transitional economy the case of viet nam
Bạn đang xem bản rút gọn của tài liệu. Xem và tải ngay bản đầy đủ của tài liệu tại đây (88.87 KB, 26 trang )
FISCAL
[Asian
Economic
DECENTRALIZATION
Journal 1998, Vol. 12 No.
AND
3]
4]
POVERTY
353
Fiscal Decentralization and Poverty
Alleviation in a Transitional Economy:
The Case of Viet Nam
M. Govinda Rao
Australian National University
Richard M. Bird
University of Toronto
Jennie I. Litvack
World Bank
Intergovernmental fiscal arrangements may play an important role in ameliorating poverty in many countries. Successful poverty alleviation generally requires
both ‘capacity improving’ and ‘safety net’ policies, and both types of policies may,
to some extent, be implemented through, or affected by, intergovernmental transfers. From this perspective, we analyse the efficacy of intergovernmental fiscal
arrangements in poverty alleviation in a transitional economy, Viet Nam. We
argue that both general and specific transfers are needed for this purpose: the
former to enable all provinces to provide a given basket of public services at a
given tax-price by offsetting their revenue and cost disabilities and the latter to
ensure that minimum levels of those public services provided by lower levels of
government are targeted to the poor throughout the country.
I.
Introduction
A successful poverty alleviation strategy in any country has four distinct elements.
First, who are the poor? Where are they located, and what do they do? Second,
why are they poor? Only after we know who the poor are, where they live, what
they do, and have some idea of the causes of poverty, can the third element in
the strategy, the design of a set of specific policies to improve the living standards of the poor, be determined. Third, experience suggests that effective strategy to improve the living standards of the poor require both measures aimed at
accelerating economic growth (capacity improving) to provide a lasting solution
to the problem, and more direct (safety net) policies to provide an immediate
ASIAN ECONOMIC JOURNAL
354
consumption entitlement to the poor. Finally, policies must, of course, be implemented effectively to ensure that benefits actually accrue to the targeted groups
at the lowest cost.
Fiscal decentralization may, in principle, enter this picture at several different
levels. The proximity of policy makers to the people, for example, may reduce
the information and transaction costs in identifying the poor and help in designing appropriate ‘capacity improving’ and ‘safety net’ policies. Decentralized
provision of public services enhances welfare when there are significant localized differences in preferences although the extent to which this ‘decentralization theorem’ (or ‘principle of subsidiarity’) actually influences policy in any
country, of course, depends upon how a nation’s political institutions are organized (Oates, 1972). Further, effective implementation of capacity-improving and
safety-net policies may depend upon the close involvement of local governance
institutions. Governments that are ‘closer to the people’ should, in principle, be
able to provide services more efficiently and effectively than a remote, centralized authority provided responsibilities are assigned appropriately and the right
incentives are provided through the system of intergovernmental fiscal arrangements (Bird, 1993).
Different regions may have different needs and preferences for poverty alleviation and different capacities to meet those needs and preferences. If poverty
alleviation is a national policy concern, but some key poverty-alleviation policies are for whatever reason delivered by local governments, the capacity of
the latter to finance such services out of their own resources is likely to differ
greatly. In Viet Nam, for example, provinces with a high concentration of poverty also have low levels of social and physical infrastructure, low agricultural
productivity, and low per capita gross domestic product (GDP). Intergovernmental transfers may thus have to be designed to ensure that the poorer localities
have sufficient resources to deliver the desired ‘package’ of services (Rao and
Das-Gupta, 1995).
This paper considers how fiscal decentralization and central transfers to
sub-central governments can help in the task of poverty alleviation policy in
Viet Nam. In Section II, we describe briefly the poverty situation in Viet Nam
and introduce the appropriate design and implementation of policies required to
accelerate economic growth and reduce poverty in the light of the experience
of successful East Asian economies. In Section III, we consider the role of central and local governments in designing and implementing poverty-alleviating
policies and the design and mix of different types of intergovernmental transfer
schemes. In the light of this conceptual discussion, we then analyse in Section
IV current intergovernmental fiscal arrangements and transfer systems in Viet
Nam. Finally, in Section V, we suggest how the intergovernmental fiscal system
might be reformed to improve poverty-alleviation policies in Viet Nam.
FISCAL DECENTRALIZATION AND POVERTY
II.
355
Poverty, Public Policy, and Fiscal Decentralization
II.1 Where do the Poor Live?
The Viet Nam Living Standards Measurement Survey (LSMS) highlights four
important features of poverty in Viet Nam (see Table 1) namely: (i) the overall
incidence of poverty is extremely high; the consumption level of 51% of population is below a widely used international poverty line;1 (ii) there are significant
regional variations in the incidence of poverty within the country, ranging from
33% in the South East to 71% on the North Central Coast; (iii) poverty is about
twice as common in rural as in urban areas and rural poverty accounts for almost
90% of the poor; and (iv) almost 76% of the poor are in the farming population.
As Table 1 shows, in Viet Nam poverty is not only associated with low per
capita income, low population density and low agricultural productivity but is
also reflected in low indicators of human development such as infant mortality,
maternal mortality and illiteracy. The inverse relationship between the poverty
ratio and agricultural productivity reflects at least, in part, the importance of
such economic services as irrigation, agricultural extension, rural roads and rural
credit in reducing poverty. Similarly, the high poverty ratio in areas with low
population density reflects in part the lack of social and economic infrastructure
for the population in mountainous and remote regions.
II.2 Poverty and Public Policy: The Asian Experience
Policy interventions to combat poverty may be divided into two broad groups
(Bhagwati, 1988). First, longer-term policies attempt to create an environment
for the efficient use of resources and technological progress and to direct the flow
of benefits of ensuing faster growth to the poor: ensuring a conducive incentive
structure through land reforms, generating larger farm and off-farm employment
opportunities through the provision of irrigation, agricultural extension and rural
infrastructure and investment in human resources through publicly funded broad
based education and primary health care. Second, shorter-term policies to provide
immediate relief through self-employment and wage-employment opportunities
and social security to the disabled and the destitute.
The experience of such Asian economies as Taiwan (China), South Korea,
Indonesia, Malaysia and China underlines the importance of public investment
in rural infrastructure and human capital in generating broad-based growth in
rural incomes and reduction in rural poverty irrespective of the political systems. In all these countries, rural transformation was achieved by improving the
quality of physical and social infrastructure, improving access to education and
health facilities, raising agricultural productivity and expanding rural non-farm
1. The poverty line is based on a basket of goods in which food items contain 2100 calories per
person per day and the non-food items reflect the cost of basic goods consumed by the people who
just reach the poverty line.
Region
1.
2.
3.
4.
5.
6.
7.
8.
Northern Mountains
Red River Delta
North Central Coast
South Central Coast
Central Highlands
South East
Mekong Delta
All Regions
Regional Profile of Income Levels, Poverty and Social Development in Viet Nam
Poverty Ratio
Rural
Urban
Total
63
55
74
54
50
45
52
57
34
15
42
36
–
17
28
26
59
49
71
49
50
33
48
51
Per Capita
GDP – 1993
(1989 Prices)
1000 Dongs
Density of
Population
Per sq. km.
Illiteracy Rate*
Infant
Mortality Rate
(Per 1000 births)
Maternal
Mortality Rate
(Per 1000 births)
Agricultural
Productivity
(Paddy equivalent)
Tons/hectare
332.5
448.4
277.6
331.2
380.8
1117.5
472.0
478.2
115
1085
181
157
50
358
325
209
18.9
7.2
10.2
12.3
25.6
10.1
15.3
13.1
52.3
44.2
54.2
50.6
69.1
37.4
51.7
49.5
2.1
1.7
2.1
2.2
2.8
1.5
2.0
2.0
2.07
2.74
2.25
3.13
2.36
2.67
3.95
3.06
ASIAN ECONOMIC JOURNAL
Table 1
Note: * Percentage of population above 10 years who never attended school has been taken as a proxy for illiteracy rate.
Source: Bird, Litvack and Rao (1995).
356
FISCAL DECENTRALIZATION AND POVERTY
357
activities. This experience suggests that publicly funded investments in rural
infrastructure (roads, bridges, irrigation and electricity) and broad-based education and health care in rural areas are critical in the early years of rural transformation. The combination of rural infrastructure and human resource development led
to improvements in productivity, opened up markets, hastened the demographic
transition, enhanced the mobility of labour, strengthened urban-rural linkages
and accelerated rural industrialization. Together with changes in the incentive
structure initiated by the land reforms in the early phase of development (as in
Taiwan, South Korea and China), investments in rural infrastructure, rural institutions and human resource development not only led to strong growth performances, but also created an equitable basis of growth and resulted in a significant
decline in poverty.2 The experience of Viet Nam itself highlights the pressure
of demand for rural public services created by the change in the incentive structure with the return to family farming and market opportunities (World Bank,
1993b).
As in other Asian economies, analysis of household data in Viet Nam underlines the importance of physical and social infrastructure in rural areas. As mentioned earlier, the poor in Viet Nam are concentrated in areas where agricultural
productivity is low. Those who live near all-weather roads have higher incomes,
and education has a significantly favourable effect on agricultural productivity
and small household enterprise earnings. Households with more diverse economic
activities enjoy higher living standards. Such findings suggest that significant
levels of investments in irrigation, agricultural extension and research, rural
roads and marketing facilities, access to information and knowledge, markets
and technology and above all basic education and primary health care in Viet
Nam are needed to achieve appreciable reduction in poverty in the medium term
(Wiens, 1996; Van de Walle, 1996).
III. Fiscal Decentralization and Poverty Alleviation
III.1
Role of Local Governments in Poverty Alleviation
What is the role of local government expenditure policies in reducing poverty?
If poverty alleviation is considered as a purely redistributive task, in principle its
implementation should be the responsibility of the central government since the
potential mobility of population limits the efficacy of sub-central governments
in undertaking these redistributive policies (Brown and Oates, 1987; Ladd and
Doolittle, 1982). Moreover, if concern for the poor of one locality is not confined to the residents of that locality, the volume of resources allocated by the
2. See, World Bank (1993a) for a discussion on the contribution of these factors in imparting
dynamism to the agricultural sector in East Asian economies. Ranis (1995) also stresses the importance of well developed rural (roads, drainage, irrigation and power) and institutional infrastructure
(agricultural research, experiment stations and farmers’ associations) and effective land reforms in
Taiwan and South Korea.
ASIAN ECONOMIC JOURNAL
358
locality for poverty alleviation would be non optimal.3 However, even from this
limited perspective, local governments may, as noted earlier, have a role to play;
governments that are closer to the people should, as a rule, be able to provide
services more efficiently than a remote, centralized authority.
More importantly, as already mentioned, a lasting solution to the problem of
poverty can be achieved only by accelerating economic growth by promoting
efficient allocation of resources. The literature on fiscal federalism has highlighted the potential efficiency gains from the better matching of the supply with
the demand for public services in different localities and more flexible bundling
of public services (Breton, 1990) when the allocative function is decentralized.
Moreover, competition among jurisdictions may lead to greater innovations and
productivity gains (Oates, 1977; Shah, 1994).4
Whether or not fiscal decentralization is a help or a hindrance in designing
and implementing poverty alleviation policies, it is an important institutional
reality in a country like Viet Nam with a unitary political system and a significantly planned economy. How existing decentralized institutions can be geared
and reoriented to enhance efficiency in the delivery of public services, accelerate
economic growth and reduce poverty is thus an important question.
III.2
Intergovernmental Transfers: Rationale and Design
Transfers between governments often coexist with transfers between persons
executed through tax-transfer schemes and public spending policies. Intergovernmental transfers may be explained in various ways: (i) closing the fiscal gap arising from the assignment of more expenditure responsibility than revenue sources
or ensuring adequate funds for the sub-central governments to satisfactorily
undertake the functions assigned to them; (ii) offsetting the imbalance between
revenue capacity and expenditure need across different sub-central governments
(equalization); and (iii) Pigovian-type transfers needed when the benefits of
public services spill over jurisdictional boundaries to ensure optimal supply or a
prescribed minimum levels of those services considered ‘meritorious’ by the
central government (Bird, 1993; Shah, 1994). Broadly, general-purpose transfers
3. Brown and Oates (1987) and Ladd and Doolittle (1982) argue for central intervention on the
grounds that poverty anywhere in a country is a concern for people everywhere. In contrast, Pauly
(1973) and Tresch (1981) present a local public good view of poverty alleviation and assume limited
mobility of labour to justify local interventions in poverty alleviation.
4. Bahl and Linn (1992), however, think that this efficiency case for decentralization in developing
countries is much weaker than industrialized countries. Prud’homme (1995), takes an even stronger
position when he argues that decentralization would result in lower allocative efficiency because the
local bureaucracy is less efficient (economies of scope) and more corrupt (see also Tanzi, 1995).
However, experience shows that capacity or efficiency of local bureaucrats, even when it is seen to
be low in a static situation, may improve dramatically when greater responsibility is assigned and
right incentives are given, as in Colombia. (see, World Bank, 1995). As regards corruption, it may
also be argued that greater transparency in public spending and taxes at the local (rather than central)
level may lead to higher accountability (hence less corruption).
FISCAL DECENTRALIZATION AND POVERTY
359
are intended to meet the objective of equalization and specific-purpose transfers
(with matching requirements from local governments) are considered appropriate (cost effective) for transfers given for spillover or merit good reasons.5
Arguments for equalization were advanced initially by Buchanan (1950) and
later developed by Boadway and Flatters (1982). Taking comprehensive income
as an index of wellbeing, it is argued that a central income tax can not ensure
horizontal equity since it does not take account of the redistributive effect of
local fiscal operations, which can not be distributionally neutral (except in the
unlikely case of their financing public services through only benefit taxes). When
local public services are financed by resource rents or source-based (as against
residence-based) taxes, the net fiscal benefits (NFBs or benefits less locally borne
taxes) will vary systematically with residents of resource-rich (high-income)
regions having higher NFBs, inefficient migration into these regions may thus
be induced. For both efficiency and equity reasons then, it may be argued that
there should be transfers from the rich to poor regions to offset the fiscal disadvantages arising from lower revenue capacity and higher unit cost of providing
public services. This can be achieved by a general-purpose transfer equivalent to
the ‘need-revenue’ gap (Bradbury, et al., 1984), which measures the difference
between what a local government needs to spend to provide a specified level of
public services and the revenue it can raise at a given level of tax effort.
Transfers meant to deal with spillover problems or those given for merit,
good reasons are required to ensure that local governments provide a prescribed
normative (minimum) level of specified public services. Such transfers are
cost effective when the purpose for which they are given is specified, and subnational governments are required to make a matching contribution with the
matching ratio varying with the size of the spillovers.6
The objective of intergovernmental transfer, in principle, is thus, not poverty
alleviation per se. Rather, such transfers are intended to offset local fiscal disabilities and to ensure the provision of prescribed standards of specified public
services. Of course, one such service might take the form of specific poverty
alleviation programmes. By enabling the provision of a reasonable level of
physical and social infrastructure in low-income areas where the poor are concentrated, as well as the maintenance of selective schemes to provide short-term
self-employment and wage-employment opportunities, the intergovernmental
transfer system may thus in practice be an important instrument in povertyalleviation strategy.
An ideal set of intergovernmental fiscal arrangements would include the following elements: (i) adequate resources in the hands of local governments as
a whole, from a combination of local taxes and central transfers, to enable them
5. Of course, both type of transfers help close the ‘fiscal gap’.
6. Since the responsiveness of sub-central governments to a given matching ratio may vary with
their level of incomes, to elicit equal responsiveness, equalizing matching ratios may be required
(Feldstein, 1975).
ASIAN ECONOMIC JOURNAL
360
to carry out their assigned functions; (ii) a transfer system that ensures each individual local government has sufficient resources to provide essential functions at
an acceptable standard, provided local taxes are imposed at reasonable rates; (iii)
sufficient flexibility in setting local taxes and charges so that local governments
can respond to the preferences, special problems, and resource endowments prevailing in different regions; (iv) sufficient incentive to ensure that local fiscal effort
is maintained and local budgets are managed efficiently; and (v) where minimum
levels of spending on specific programmes are considered to be of national importance, specific-purpose transfers, sometimes with matching requirements.
Such an ideal system, is seldom found in practice, and certainly not in countries such as Viet Nam where, traditionally a unified budget has been employed
as a tool to implement central planning. Nonetheless, an essential, but often
unduly neglected part of the transition towards a more market-oriented economy
is precisely a change in the budgetary and intergovernmental system (Bird and
Wallich, 1993), and such a change is under way in Viet Nam.
IV. Fiscal Decentralization and Delivery of Public Services in Viet Nam
IV.1
Structure of Local Governments
Like most centrally planned economies, Viet Nam has a ‘deconcentrated’ system, in which the centralized state authority is extended to local administrations
in provinces, districts and communes.7 In this unified structure of government,
local governments do not have independent decision-making authority. Nonetheless, the system provides for local involvement to ensure that the public services
are delivered in response to the local needs and development is in conformity
with local resources. In this so called ‘double subordination’ system, local governments are thus accountable in a sense to both the electorate and higher level
governments.
Within the unified state, the government is deconcentrated into three local
levels – provinces, districts, and communes. The structure of local government
consists of 53 provinces, 560 districts, and 10,032 communes. The unified budget
includes the revenues and expenditures of the centre, the provinces and the
districts. Delivery of public services at the commune level is included only to
the extent that it is financed by grants from higher-level governments.8
IV.2
Assignment of Expenditures and Taxes
The assignment of expenditures to different levels of government in Viet Nam
is based on a resolution of the Council of Ministers passed in November 1989,
as subsequently amended. Local governments are responsible for ensuring law
7. For a discussion on typology of decentralization, see, Rondinelli (1996). For a useful description
of the ‘double subordination’ system see, World Bank (1996), pp. 42–43.
8. Note that as used here, ‘local governments’ refers to all subnational levels.
361
FISCAL DECENTRALIZATION AND POVERTY
Table 2 Government Expenditure in Viet Nam (1992)
Total Expenditure
(Bn Dongs)
Per Capita
Expenditure
(Dongs)
Per cent
of GDP
Per cent
of Total
Share of
Provincial
Expenditure (%)
Current expenditure
Gen. adm. services
Economic services
Social services
(i) Education
(ii) Health
(iii) Pensions
(iv) Others
4. Interest
5. Others
Total Current
expenditure
2,404
1,495
6,240
1,495
1,136
2,369
1,240
3,218
5,314
18,671
34,687
21,571
90,035
21,571
16,391
34,182
17,892
46,432
76,674
269,399
2.4
1.5
6.1
1.5
1.1
2.3
1.2
3.2
5.2
18.3
10.2
6.3
26.4
6.3
4.8
10.0
5.2
13.6
22.5
79.0
43.1
78.9
46.0
88.6
88.1
–
15.1
–
18.9
35.9
B. Capital expenditure
Total expenditure
4,956
23,627
71,509
390,908
4.9
23.2
21.0
100.0
34.4
35.5
A.
1.
2.
3.
Source: Bird, Litvack and Rao (1995).
and order within their jurisdictions, but, as in many other countries, with a few
exceptions such as defence most responsibilities are shared more on the basis of
the size of the projects than the type of expenditure. Large investment projects,
the benefits of which spill over to a number of provinces, are central responsibilities, while small projects benefiting mainly the residents of a province are
undertaken by provinces. Thus, all major irrigation, flood control and embankment projects and national highways are central responsibilities, but the maintenance and repair of minor irrigation works and roads other than national highways
is a local responsibility. Similarly, primary and secondary education is mainly
assigned to the provinces, but higher education is central, and major hospitals
are managed by the centre, while the provinces run hospitals in provincial towns
and districts. Provinces are also responsible for the public health centres run at
the commune level.
Thus, in principle, local governments have a significant role in the delivery
of public services. Expenditure incurred by the provinces constitutes almost a
third of the total (Table 2). Their expenditure share is especially high in such
social services as education and health. Moreover, although most capital expenditures are incurred by the centre, the provinces play a major role in maintaining
public investments and in activities like agricultural extension and rural roads.
Consequently, their share in current expenditures on economic services is also
significant.
Nevertheless, the provinces’ leeway in altering expenditure levels is constrained by the absence of significant revenue-raising powers. The responsibility
ASIAN ECONOMIC JOURNAL
362
for determining the tax base and the rate structure of all taxes lies with the
central government. Except for taxes on foreign trade (administered by the customs department), tax administration and enforcement is done by the General
Department of Taxation (GDT) of the Ministry of Finance (MOF) and by provincial and district tax offices under its direction. The centre determines virtually
all aspects of tax policy, but the provinces effectively control tax collection,
ensuring that the targets set are achieved through proper enforcement in part by
providing cash incentives to provincial and district tax departments. Provinces
have an incentive to overreach centrally determined targets because the excess
amount can be used by the province for any social or economic service (not general administration). In addition, provinces can collect some minor charges and
fees, although in total these account for less than 5% of their revenues.
IV.3
Balancing Provincial Budgets
The budget law, which assigns expenditure functions to the central and local governments, also provides financing for them either through tax revenue assignment or grants. The determination of expenditures and assignment of revenues
to the different levels of government is carried out through the budgetary process
involving a number of steps. First, the MOF issues a budget circular in June
containing detailed guidelines for preparing the budget to be submitted to the MOF
by July or August. The guidelines are prepared on the basis of macroeconomic
forecasts, the strategic framework and the projected availability of resources.
The guidelines also prescribe the norms for projecting expenditures under each
of the heads.
Based on these guidelines, the provinces project current expenditures and also
consolidate similar estimates they receive from the districts. In a parallel process,
they also prioritize their own investment projects and those submitted by the
districts and communes and submit them to the Ministry of Planning and Investment (MPI). Similarly the central line ministries submit forecasts of current
expenditures to the MOF based on the guidelines, and investment projects to the
MPI. These ministries also prepare the estimates with respect to the National
Programmes (see below) – the specific purpose transfers to local governments.
The MPI then finalizes the investment outlay of the central government and each
of the provinces. The GDT and the customs department prepare forecasts of
revenues and the State Bank of Viet Nam (the Central Bank) provides an estimate
of borrowing. Finally, the MOF puts together the estimates of revenue from
domestic and foreign sources and establishes budgeted recurrent and investment
expenditures to balance the revenues. As a rule, the central expenditure forecasts
made by the provinces and line ministries are far in excess of the available
resources, two or three rounds of negotiations are required between the budget
department of MOF and the provinces and other spending agencies.
Once the expenditures of each of the provinces are finalized, revenues are
assigned to meet these expenditures through a combination of methods. Certain
FISCAL DECENTRALIZATION AND POVERTY
363
revenue sources are assigned directly to the provinces. Collections from certain other taxes are shared with them. The residual gap is filled by sharing the
proceeds from the turnover tax.9 Finally, if turnover tax is not adequate to fill
the gap, cash grants are allotted. The effect of policy and price changes, made
between the budget cycles, on revenues and expenditures are calculated by the
MOF, and additional grants are given, if necessary.
Thus, although the provinces account for almost one-third of total spending,
their actual role in determining expenditure decisions is limited. The selection
of investment projects is done by the MPI. Provincial preferences are taken into
account only indirectly, and the final selection is both complicated and nontransparent. Similarly, though the provinces project current expenditures based
on an elaborate set of norms, the norms themselves are developed with respect
to revenue constraints and hence do not really represent cost/need factors adequately. Moreover, in the end expenditure levels are decided by negotiations to
match revenues, and the norms lose much of their relevance anyway. Provinces
also have very limited flexibility with regard to the composition of expenditure.
Even though in principle, they can vary allocations between different functions
within the overall ceiling, in practice they have hardly any leeway since the
centre determines both the number of employees and their salary levels in each
department. Provinces can spend more than the budgeted amounts only when they
are able to collect more than the targeted amount of revenues assigned to them.
Two features of revenue assignments are notable. First, as may be seen from
Table 3, there is no fixity or stability in the assignments; the type of tax and the
proportion to be assigned to each province is determined afresh every year. The
ad hoc nature of assignments makes it difficult for local governments to plan
expenditures. This problem should be obliterated by a new Budget Law implemented in 1996 under which the arrangements will remain stable for five years.
Second, the system provides incentives to the provinces to distort the estimates
because they can retain revenues in excess of the targets and either spend the
excess or economic and social services or build the financial reserves.
IV.4
Evaluating Fiscal Arrangements
The preceding discussion shows that the system of transfers in Viet Nam falls
far short of the ideal discussed in Section III. Indeed, the concept of transfer
itself is unclear. At one extreme, all revenue collections made by a province may
be considered as its own; in this case, the difference between expenditures and
revenue collections may be construed as transfers. Another concept of transfers
would be to consider the transfers as the balancing component – the share of
turnover taxes and the cash grants received by provinces. Perhaps, the most
9. A province’s share of turnover tax is given by (Ei – Ri)/Ti if (Ei – Ri) > 0, where Ei, Ri , and Ti
respectively represent expenditures, assigned revenues from other tax and non tax sources (excluding cash grants), and revenue from turnover tax in the ith province.
Central Revenues
Assigned Revenues
Shared Revenues
1993
1994
1993
1994
1993
1995
1. External trade taxes
2. Special
consumption tax
3. Profits and
depreciation of
central enterprises
4. Revenue from
major minerals (oil)
5. Personal income tax
1. External trade taxes
2. Special
consumption tax
3. Profits and
depreciation of
central enterprises
4. Revenue from
major minerals (oil)
1. Land and housing
tax
2. Slaughter tax
3. Licence fee/taxes
4. Registration fee
5. Depreciation and
tax on capital use
and profits of
commercial
enterprises
6. Profits tax
7. Taxes on lottery
8. Import/export tax
at the land border
9. Transportation fees
10. Revenue from
forestry
1. Agricultural tax
2. Land and housing
tax
3. Slaughter tax
4. Licence fee/taxes
5. Registration fee
6. Depreciation and
tax on capital use
and profits of
commercial
enterprises
7. Personal income
tax (Except in Ba
Ria-Vung Tau)
8. Taxes on lottery
9. Transportation fees
10. Revenue from
forestry
11. Other minor fees
and taxes
1. Six provinces of the
Mekong River delta
received shares of
agricultural taxes
ranging from 8 to
60%. The remaining
provinces received
the entire
collections
2. Turnover tax
1. Turnover tax (39
Provinces received
a 100% share and
the remaining
received varying
shares depending on
the difference
between projected
expenditures and all
assigned revenues)
2. 45 provinces
received the entire
collections from
profit tax. The
remaining 8 most
prosperous
provinces received
50% of the tax
collected in the
province
ASIAN ECONOMIC JOURNAL
Table 3 Revenue Assignment to Provinces in Viet Nam 1993–94
364
FISCAL DECENTRALIZATION AND POVERTY
365
realistic solution is to consider the entire expenditure of the provinces (excluding the small amount of fees and charges they levy) as a transfer since provinces
do not have independent power to raise taxes. The critical factor in determining
transfers is thus the preparation of the expenditure budget at the provincial level,
and the relevant test in evaluating them is the distribution of expenditures across
the provinces – whether they enable the poorer provinces to provide a given
level of public services at reasonable tax rates.
As already noted, expenditure determination is beset with a number of problems. The process of selecting investment projects is both complicated and nontransparent, and is certainly not based solely on consideration of the relative needs
of the provinces. The fact that provinces can use ‘excess’ revenue collections as
they wish advantages the more prosperous provinces. The norms specified as the
basis for projecting current expenditures do not adequately represent needs nor
are expenditures finally allocated according to the specified norms. Some attempt
is made to take account of cost differences by specifying different norms for cities,
plains, midland and coastal areas, low mountainous and remote areas and highlands, but it is not clear that the central government has adequate cost information
for this purpose. In addition, the constraint on resources causes the norms to be
set too low to provide reasonable levels of services.10 Inter-Provincial distribution
of social and economic infrastructures is thus less a matter of objective analysis
than of negotiation and bargaining. In the final analysis, the allocation of expenditures basically responds to bureaucratic and political judgements at the central
level, although the relationship between political leaders at the central and provincial levels also appears to play an important role in expenditure allocation.
Uncertainty in revenues renders planning for the medium term difficult. Moreover, larger revenue collections in a province in one year result in higher targets
for the next year and appear, in at least some cases, to result in a lower provincial share of turnover taxes. In Ha Noi, for example, revenue collections in 1993
were more than 50% higher than in the previous year and exceeded the budget
estimates by 15%. Much the same happened in 1992. Consequently, the share of
turnover tax accruing to the city was reduced from 70% in 1992 to 36% in 1993
and was further reduced to just 6.3% in 1994.
Another source of possible inequity is in the system of revenue projection
itself. The tax department consistently tends to underestimate revenues so that it
can easily fulfil the targets set. This is in the interest of provinces as well, since
collections in excess of the targets can be spent by them. Unsurprisingly, actual
10. In the case of education, for example, on an average, per capita expenditure in 1991–92 was
just about US$1 and as over 80% was spent on teachers’ salaries alone, little was left for books,
furniture and educational aids. In fact, in Soc Trang, one of the poorer provinces, per student
expenditure was less than US$2. The situation is equally bad in the case of economic services. In
Thanh Hoa, for example, the sanctioned budget for strengthening embankments is less than 10% of
what is requested, with the result that the province must mobilize a lot of voluntary labour from the
community even to strengthen the weakest segment of the embankments. The situation is similar in
the case of other services.
ASIAN ECONOMIC JOURNAL
Table 4 Revenues and Expenditures – Targets and Estimates
Provinces
High-Income
Middle-Income
Low-Income
All Provinces
Per Capita Revenues – 1993
Per Capita Expenditures – 1993
Targets
(Dongs ’000)
Latest Estimate
(Dongs ’000)
Increase in
Estimates over
Targets (Dongs ’000)
Percentage
increase
Targets
(Dongs ’000)
Latest Estimate
(Dongs ’000)
Increase in
Estimates over
Targets (Dongs ’000)
Percentage
increase
656.43
95.43
54.53
278.60
758.10
111.19
69.92
323.89
10.67
15.76
15.39
45.29
15.5
16.5
28.20
16.30
178.83
95.65
104.73
126.54
230.2
122.45
135.76
162.99
51.67
26.8
31.03
36.45
28.9
28.0
29.6
28.8
Source: Bird, Litvack and Rao (1995).
366
FISCAL DECENTRALIZATION AND POVERTY
367
revenue collections have exceeded the targets in every single province since
1990 (Table 4). Although a larger share of some of the taxes collected in higherincome provinces goes to the centre in per capita terms, the richer provinces still
retained higher excess collections and therefore had higher per capita expenditures. Actual per capita expenditures exceeded the budgeted amounts by D 51,670
in high-income provinces, by D 26,800 in middle-income provinces, and by D
31,030 in low-income provinces. Thus, the system has worked to the relative
advantage of the richer provinces.
To summarize, the system of fiscal arrangements and the design of intergovernmental transfers in Viet Nam can clearly be improved in a number of respects.
First, local authorities have very little autonomy and flexibility in deciding the
level and composition of expenditures. Second, the norms used to make projection
are neither scientific nor relevant in the final analysis. Third, the ad hoc nature of
fiscal arrangements creates both uncertainties and disincentives for provincial
governments. Finally, the provision that revenues in excess of targeted amounts
may be retained has disproportionately helped the richer provinces.
IV.5
Equalizing Effect of Transfers
Although the provinces accounted for almost 35% of total public expenditures
in Viet Nam the amount they spent in absolute terms seems unlikely to be large
enough to make a significant dent on the poverty problem. In 1992, per capita
expenditure of the provinces was just about 126,000 dongs or about US $12
(Table 5) which does not amount to much even considering the relatively low
unit cost of providing public services. As capital expenditures constituted about
20% of the total, on average, local governments had little more than $2 (US) per
head to invest. The absolute level of resources available to local governments in
Viet Nam is so low as to make it difficult for those governments to provide even
the most minimal level of services.
The basic inadequacy of local fiscal resources has been exacerbated by stabilization policies since 1989, which have severely compressed investment expenditures. In 1991, capital expenditure in constant prices was actually lower than the
corresponding figure for 1985 by 12.3%.11 The compression appears to have been
especially marked with respect to expenditures on agriculture and irrigation, and
to some extent, roads. Although the share of government expenditure in GDP
increased from less than 20% in 1985 to 23% in 1992, expenditures on agriculture, irrigation and roads – the three most identifiable and important items from
the viewpoint of poverty alleviation – actually declined.
Unfortunately, the distribution of central government expenditure by province
is not available. Although it is possible that such expenditure may be allocated
to some extent to offset the disequalizing effects of provincial expenditure, only
11. Government investment expenditure at constant (1982) prices in 1991 was 21,762 dongs as
compared to 24,839 dongs in 1985. See, Bird, Litvack and Rao (1995, p. 11).
368
ASIAN ECONOMIC JOURNAL
Table 5 Distribution of Per Capita Provincial Expenditures by Region (1993)
(’000 dongs)
1.
2.
3.
4.
5.
6.
7.
8.
Per capita GDP
(1989 prices)
Poverty Ratio
Capital
Expenditure
Total
Expenditure
332.5
448.4
277.6
331.2
380.8
1117.0
472.0
478.2
59
49
71
49
50
33
48
51
22.3
20.5
13.5
20.4
25.4
31.8
13.7
19.9
119.1
126.3
83.0
122.0
134.5
235.1
99.1
126.1
Northern Mountains
Red River Delta
Central Coast-Northland
Central Coast-Southland
Central Highlands
Northeast of Southland
Mekong River Delta
Average
the latter can be analysed here. In general, as Table 5 shows, per capita provincial expenditures are clearly higher in more prosperous regions. The highest
budgeted per capita expenditure was in the North-East of Southland (Ho Chi
Minh City) where per capita income was the highest and the poverty ratio was
the lowest. Similarly, the lowest per capita expenditure was in the North-Central
coastal region where per capita income was the lowest and the poverty ratio was
the highest. A similar pattern emerges for expenditures on different items for the
two years shown in Table 6. In aggregate, per capita expenditure in the high
Table 6 Per Capita Provincial Expenditures (1993)
(’000 dongs)
High-Income
Provinces
Middle-Income
Provinces
Low-Income
Provinces
All Provinces
1992 (Actual)
1. Capital expenditure
2. Current expenditure: of which:
Education
Health
3. Total expenditure
34.6
126.3
22.0
13.7
160.9
14.9
73.6
17.3
7.8
88.5
20.8
79.7
17.4
7.8
100.5
25.0
98.1
19.4
10.4
123.1
1993 ( Budget Estimates)
1. Capital expenditure
2. Working capital for SOEs
3. Current expenditure, of which:
Economic services
Education
Health
4. Total expenditure
27.0
12.4
139.2
40.4
26.5
14.7
178.6
14.0
2.8
78.9
11.1
21.8
9.3
95.7
19.9
2.4
82.5
13.7
23.3
4.4
104.7
19.9
5.6
100.6
21.9
23.0
11.3
126.6
Note: High-income provinces are those with per capita income more than 450,000 dongs; middleincome provinces are those with 300,000–450,000 dongs and low-income provinces are those
less than 300,000 dongs.
369
FISCAL DECENTRALIZATION AND POVERTY
Table 7 Correlation Coefficients of Per Capita Expenditures with Capacity and
Need Variables
Current Expenditure
A. Variables Representing ‘Capacity’
1. Per capita GDP
0.574*
2. Per capita agricultural
−0.424*
production
3. Per capita industrial
0.479*
production
4. Per capita production
0.493*
(Agriculture + Industry)
B.
1.
2.
3.
4.
5.
Variables Representing ‘Need’
Population density
0.324*
Road length/sq. km. area
0.050
Agricultural productivity
−0.228*
Infant mortality rate
0.093
Illiteracy rate
0.160
Capital Expenditure
0.338*
−0.354*
0.366*
−0.351*
0.243*
0.279*
0.179
0.349*
0.122
−0.282*
0.144
0.214
0.282*
−0.388*
Total Expenditure
0.543*
−0.426*
0.327*
−0.368*
0.207
0.445*
0.236*
0.216
0.136
0.368*
0.170
0.132
−0.008
−0.277*
0.053
0.140
0.239*
0.100
−0.350*
0.244*
0.365*
0.283*
0.035
−0.257*
0.086
0.163
0.323*
0.092
−0.305
0.174
0.259*
Notes: 1992 – Actual. 1993 – Budget Estimates. * denotes significance at least at 5% level.
income provinces was 31% above average in 1992 and 41% above in 1993,
though in some services like education the inequality was much less pronounced.
The positive and significant correlation of per capita expenditures with per capita
incomes in different provinces both in 1992 and 1993, confirms that the relatively more affluent provinces have higher per capita expenditures.
Two important inferences emerge from this discussion. First, the resources
available at the provincial level are so low in absolute terms that they are unlikely
to have more than a very limited impact on poverty. Second, the distribution
of resources among the provinces appears to favour the relatively better-off
provinces who spend more in per capita terms. Although unit costs of providing
some public services may be higher than the national average in more urbanized
areas, others will be lower. Cost differentials alone seem unlikely to account for
these results. Indeed, in the north mountainous region, where low population
density means that the unit costs of providing public services are also likely to
be well above average, per capita expenditures were actually below average.
The correlation coefficients reported in Table 7 confirm that provinces with
higher per capita GDP had higher per capita expenditures. The results show that
both current and capital expenditures are higher in more developed provinces.
Per capita capital and current expenditures are significantly related to per capita
industrial output, but have a significant negative correlation with per capita agricultural output and productivity. Per capita expenditures were also higher in more
densely populated provinces, which implies that higher unit costs in mountainous
and remote areas are not adequately reflected in the determination of aggregate
expenditures. Actual per capita expenditure in 1992 had no significant association
370
ASIAN ECONOMIC JOURNAL
Table 8 Inter-Provincial Variations in Per Capita Expenditures: Regression Results
(Log-linear equations)
Independent variables
Total Expenditure
(1992)
Total Expenditure
(1993)
Current Exp.
(1992)
Capital Exp.
(1993)
0.771
(0.726)
0.651*
(6.639)
−0.076
(−1.208)
−0.355*
(−2.129)
0.245*
(2.268)
0.075
(0.424)
0.041
(0.771)
–
1.316
(1.202)
0.499*
(5.259)
−0.021
(−0.318)
−0.485*
(−2.700)
6.305*
(2.693)
0.090
(0.487)
0.061
(1.097)
–
0.347
(0.308)
0.650*
(6.974)
−0.117
(−2.465)
–
0.244
(0.217)
0.578*
(6.497)
−0.108
(−2.296)
–
–
–
–
–
Teacher-student ratio
–
–
Hospital beds per 1000
persons
K2
F
–
–
0.494
9.444
0.412
7.078
−0.015
(−0.325)
−0.187
(−1.599)
0.1611
(0.718)
0.294*
(2.617)
0.541
11.206
0.058
(−1.186)
0.020
(0.171)
0.230
(0.992)
0.246*
(2.131)
0.509
8.699
Constant
Per capita GDP
Population density
Agricultural productivity
Illiteracy rate
Infant mortality rate
Length of roads per sq.
km. area
Enrolment ratio
* Significant at least at 5% level.
with other ‘need’ variables such as infant-mortality rate or the literacy rate though
the latter showed significant correlation with budgeted expenditure in 1993.
The regression results for inter-provincial differences in per capita current,
capital and total expenditures are presented in Table 8, generally confirm these
observations. In all the equations, the regression coefficient of per capita GDP is
positive and significant for both 1992 and 1993. Similarly, population density
shows significant diseconomies of scale though the rate of increase in expenditures was lower as the rate of population density increases (log-linear equation).
These regressions do suggest, however, that there is some attempt to spend more
in provinces with lower agricultural productivity and higher illiteracy rate. But
per capita expenditures were not significantly related to other need variables
such as infant mortality and road length per sq. km of area.
Unfortunately, data on provincial expenditures are available at the required
level of disaggregation only for the education and health sectors. Similar correlation and regression analysis was carried out for per capita education and
health expenditures with various ‘capacity’ and ‘need’ variables (Bird, Litvack
and Rao, 1995) with broadly similar results. Expenditure on education was, for
example, higher in provinces with a higher illiteracy rate. In the case of health
371
FISCAL DECENTRALIZATION AND POVERTY
Table 9
Dependent Variable
Per capita revenues – 1993
Per capita expenditure – 1993
Per capita expenditure – 1994
Regression Equations
Constant
Reg Coeff Per
Capita GDP
K2
F
–3.5445
(–3.7741)*
2.6991
(4.6220)*
4.1612
(7.2891)*
1.4044
(9.0841)*
0.4067
(4.2307)*
0.1975
(2.1075)*
0.6152
82.5262
0.2489
17.8988
0.0632
4.4414*
Notes: Both dependent and independent variables are in logarithmic form.
* Significant at least at 5% level.
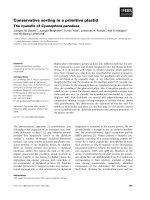
Figure 1
Equalization in Viet Nam
Ln Per Capita
Revenue/Expenditure
9
Revenue-93
8
7
Exp-93
6
Exp-94
5
4
3
5
5.5
6
6.5
7
7.5
8
8.5
Ln Per Capita GDP
expenditures, significant positive correlation with population density perhaps
suggests inadequate recognition of cost disabilities. Although per capita health
expenditure has no correlation with such ‘need’ variables as infant mortality rates,
it is significantly influenced by the number of health workers and hospital beds.
Interestingly, although budgeted expenditures on education and health in 1993
in different provinces were not significantly related to per capita GDP, actual
expenditures in 1992 were higher in provinces with higher per capita GDP. The
difference between planned and actual expenditures appears to result from the
ability of more prosperous provinces to collect larger than targeted revenues.
In spite of the positive relationship between per capita expenditure of the provinces and per capita GDP, there has been a significant degree of equalization
across provinces. This can be inferred from the difference in the income elasticities of revenue collections and expenditures estimated by employing a log-linear
regression model for the cross-section of the provinces in 1993. The estimates
presented in Table 9 show that income elasticity of expenditures (0.407) was
appreciably lower than that of revenues (1.404). Thus, expenditures are distributed
more equally than revenues and, as may be seen from Figure 1, the overall effect
ASIAN ECONOMIC JOURNAL
372
of the transfer system is clearly redistributive. Further, the degree of equalization increased between 1994 and 1993. While the income elasticity of provincial
expenditure in 1993 was 0.4, it was just about 0.2 in 1994. Even if a part of the
difference in the elasticities may be accounted for by tax spillovers (richer
provinces collecting revenues from the residents of poorer provinces), it would
appear that with all its imperfections, the general purpose transfers do have a
significant redistributive effect.
IV.6
Specific Purpose Transfers in Viet Nam
Even in a system in which the general-purpose transfers fully offset local fiscal
disabilities, specific-purpose transfers are necessary to ensure that the public services with inter-jurisdictional spillovers are provided in optimal quantities. In
addition, with respect to certain priority or meritorious public services like poverty alleviation, the centre may have to ensure that minimum levels are provided
throughout the country. Additional specific-purpose transfers are then necessary
to alleviate the effects of differential provincial capacities to provide services
related to poverty alleviation.
In Viet Nam the central government has introduced 32 different special programmes in the education, health and social welfare sectors to cope with the
perceived inadequacy of provincial spending on specific items. These programmes
are funded by the central government, but implemented by the local governments.
Not all of them are specifically directed at poverty alleviation, either directly or
indirectly. There are nine programmes on health care, 12 on education and training, and the balance relate to social, cultural and other areas. Total expenditure
on these programmes in 1993 amounted to only 1615 bn dongs, or just about 4%
of total expenditures or 12% of provincial expenditures. By and large, the distribution of expenditures on these National Programmes across provinces seems
equitable as may be seen from Table 10. Though the programmes are for specific purposes, the amount of money is distributed so thinly across different programmes and provinces that it is doubtful whether they can make an appreciable
difference to the level of services.
One important central programme that is specifically targeted to alleviate
poverty is a subsidized loan programme introduced by the Treasury and implemented through the Ministry of Labor for self employment for the unemployed.
The programme was introduced in mid-1992, and budgeted expenditure was about
D 300 bn in 1993. The loans are given to individuals (D 50 bn) and to small
enterprises and workshops (D 200 bn). The scheme covers Ha Noi and Ho Chi
Minh cities and mountainous low density provinces. Loans for self-employment
at subsidized interest rates are given after scrutinizing applications submitted to
the Provincial Peoples’ Committees. The process is similar for small enterprise
loans, which are not directly targeted to the poor, but are given to generate
employment. Loans carry a monthly interest rate of 0.5% for loans up to one
year, 0.4% for loans up to 2 years, and 0.3% for loans up to 3 years.
373
FISCAL DECENTRALIZATION AND POVERTY
Table 10 National Programmes on Education and Health
Programmes
High-Income
Provinces
Middle-Income
Provinces
Low-Income
Provinces
All Provinces
Health programmes
Central Programmes
Provincial and District
Programmes
Commune Programmes
Total
2.81
21.92
3.48
17.90
4.85
19.64
3.65
19.78
0.18
24.91
0.36
21.74
0.60
25.09
0.37
23.80
Education programmes
Pre-primary
Primary
Jr. secondary
Sr. secondary
Others
Total
2.76
18.37
8.72
4.19
1.96
35.96
1.31
16.12
7.94
2.98
1.20
29.48
1.38
14.44
10.00
3.10
1.81
30.78
1.83
16.40
8.80
3.43
1.64
32.07
This employment programme could be useful but at present it suffers from a
number of shortcomings. First, it is only a small pilot programme in two cities
and a few provinces – and, as mentioned earlier, the incidence of poverty in the
two cities is relatively low. In terms of the amount of money, D 300 bn is less
than 0.5% of the total budget. Second, although the loans to enterprises are
ostensibly given to generate employment, the recipients may be quite affluent,
and there is no mechanism in place to ensure that these enterprises in fact
generate the number of jobs proposed, once the loan is received. Third, the
maximum individual loan is D 500,000 or about $45 (in Ho Chi Minh city, it is
D 600,000). Even at a 25% rate of return, the additional income generated will
only be 125,000 or about $12 per year: any impact on the living conditions of
the poor is going to be marginal. Moreover, the fact that the loan is given for a
maximum of three years makes it more difficult for poor persons to benefit from
the scheme. Finally, while obviously repayment capacity should be taken into
account to some extent in any loan programme, there is no explicit attempt to
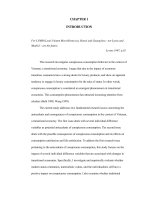
allow for the intensity of poverty in determining who benefits from this programme. The available information on the distribution of expenditures on the
programme across provinces shows that per capita expenditures were significantly higher in richer provinces, as may be seen from Figure 2.
V. Reorganizing Intergovernmental Fiscal Arrangements for
Poverty Alleviation
As Viet Nam makes a transition from central planning to market-determined
resource allocation, intergovernmental fiscal arrangements need to be reoriented
to ensure responsive provision of public services corresponding to the diversified
demands and varied resources and potential of different regions. The growth
374
ASIAN ECONOMIC JOURNAL
Distribution of Expenditure on National Programme on Hunger Eradication
Ln Per Capita
Expenditure
Figure 2
11
10
9
8
7
6
5
10
11
12
13
14
15
16
Ln Per capita GDP
Notes: The fitted regression equation is: LnE = −8.7538 + 0.7844 Ln Y * K2 = 0.126*
(−2.246) (2.625)
where E refers to per capita expenditure on the programme and Y, per capita GDP. Figures in
the parentheses are ‘t’ values of the regression coefficients. * denotes significant at 5% level.
potential of the economy may be best realized and the faster improvement in the
consumption standards of the poor achieved when public services respond to the
diversified preferences of different regions. The effectiveness of decentralized
governments in efficient provision of public services can be enhanced by reorienting intergovernmental fiscal arrangements to provide incentives and promote
accountability, replacing the negotiated system with one which is rule-based,
transparent, and properly designed to achieve the objectives of offsetting the fiscal
disabilities of poor provinces and ensuring minimum standards of ‘merit goods’
(such as poverty alleviation) throughout the economy.
An important way to ensure appropriate incentives and accountability in the
provision of public services is through linking the revenue raising and expenditure
decisions of sub-central governments at the margin. One way to do this would be
for provinces to have greater power to raise revenues. At present, the provinces
cannot vary the levels of public services even if their residents would be willing
to pay higher taxes because they do not have the right to determine the rates of
any taxes. Provinces can increase spending only when the actual collection of
revenues assigned to them exceeds the budgeted targets or by levying some minor
charges and fees. Of course, the power to levy taxes whose bases are mobile
across different provinces should remain with the centre, and provincial governments should be restrained from imposing taxes that will basically be exported
to other areas. The basic principles of local revenue assignment are: (i) local
own-source revenues should ideally be sufficient to enable at least the richest
local governments to finance from their own resources all local services primarily
benefiting local residents (as opposed to those with significant externalities such
as education); and (ii) as far as possible, local revenues should be collected from
local residents only, preferably in relation to the perceived benefits they receive
from local services (Bird, 1993).
When transfers are needed to finance provincial expenditures, ideally they
should both provide incentives for provincial revenue mobilization and, as a
FISCAL DECENTRALIZATION AND POVERTY
375
rule, allow for some degree of equalization. The critical point is that provincial
governments must, if they are to be held accountable for their actions, have
some responsibility for determining tax rates. This would both allow them to
vary rates to collect larger revenues to finance higher levels of public services
if they so choose and at the same time allow the central government to design
its transfers in such a way as to ensure that provincial fiscal efforts were not
discouraged by the receipt of such funds. Assigning at least some independent
revenue-raising authority to the provinces is essential to establishing a linkage
between revenue raising and expenditure decisions at the margin.
Of course, if the power to levy important taxes is assigned to provincial governments, inevitably richer Provinces will collect larger revenues. To offset this
disequalizing effect, as just noted, transfers have to be designed to provide sufficient revenues to provincial governments to carry out a ‘standard’ (minimum)
set of provincial expenditure, as set for example by a revised (and more accurate)
set of norms, provided they levy taxes at average national rates. In the evolution
of an objective system (as opposed to the current negotiated system) of determining provincial expenditure requirements, the development of appropriate norms
for current and capital expenditure is important. In principle, it is not difficult to
work out the precise design and implementation of such a transfer system, if
adequate information on the cost and need variables are collected.12 In practice,
in a developing country like Viet Nam it is probably better to keep the system
simple by using unit costs (e.g. per student) adjusted only for easily ascertainable factors such as population density.
Sensible local government decisions require more stability and certainty in
financial arrangements than now prevails. Although Viet Nam’s new budget law
should improve matters in this respect, a more scientific method of forecasting
revenues and expenditures would also be an improvement. As in the case of current transfers, simpler and more transparent arrangements in determining investment allocations are also needed.
Another area where reform seems needed is in regard to the National Programmes initiated by the centre. Most of these programmes are so small they seem
unlikely to have any significant impact on anything. It would seem more sensible
to focus on a few programmes that might have an impact on poverty reduction. Providing drinking water, family planning, and adult literacy, for instance,
are programmes that would appear useful from this perspective. Programmes to
combat widely prevalent diseases (like malaria and goitre) may also of course be
essential. Given the nation-wide externalities from spending on human capital
formation, provincial initiative in these areas may be encouraged by specificpurpose matching grants. There may also be a place for such grants, at higher
rates of subsidization, in mountainous regions and for ethnic minorities. If the
provinces are given the right to levy and collect some taxes as suggested above,
the introduction of specific-purpose transfers with matching resource requirements
12.
For examples of an analysis along these lines, see Ahmad (1996).
ASIAN ECONOMIC JOURNAL
376
should result in greater provincial participation and hence augment the resources
for such special programmes. Equally important is the need to maintain local
initiative and flexibility in implementing the National Programmes. It would
seem appropriate to have a set of nationally important schemes eligible for assistance. Each province should be able to choose from among these schemes subject
to a provincial ceiling of central assistance. This procedure would enhance local
initiative, and ensure that the provision of public services conformed to local
priorities. The matching rate could also be made to vary with the income levels
of the provinces as it is unlikely that the general purpose transfers would be able
to offset the fiscal disabilities of poorer provinces entirely.13
In mountainous regions and drought-prone areas and in areas in which there
is large scale unemployment of unskilled labour, a rural works programme of
creating wage employment might be introduced to provide infrastructure such
as rural roads, creating and deepening of ponds, lakes and canals, repairing and
strengthening of embankments and building school and health centres. Such a
programme might, for example, generate a fixed number of person-days of employment during the lean season. One advantage of such a programme is its selfselection process: targeting the programme to benefit the poor is easy as only the
poor will seek such employment. This approach might supplement the present
self-employment loan programme, which, as noted earlier, needs to be better
designed and targeted.
In evolving improved intergovernmental fiscal arrangements, it is obviously
useful to build on the existing system as much as possible by minimizing its
undesirable effects and imparting the necessary, autonomy, incentives and accountability to various levels of government. The key elements in this process
would seem to include the following:
(i) devolution of some independent revenue-raising authority to provincial governments, in particular, the right to set the rates of some provincial taxes;
(ii) creation of a more adequate method of resolving vertical and horizontal
imbalance through a stable, simple and transparent revenue-sharing arrangement and general-purpose grants;
(iii) identification of activities for which specific-purpose transfers should be
made and determination of the matching requirements that should be established for different provinces;
(iv) provision of adequate stability in intergovernmental fiscal arrangements;
A system along these lines should prove much more responsive to the changing needs of an emerging market economy while providing social and economic
infrastructure in an efficient manner. On paper, Viet Nam currently has a highly
centralized public sector. In practice, however, the way the system works produces unplanned decentralization and basically places the poorer provinces in a
relatively weaker position. A more formal system of fiscal decentralization in a
13.
Higher subsidy rates may be needed in poorer areas to induce similar responses (Feldstein, 1975).
FISCAL DECENTRALIZATION AND POVERTY
377
coordinated and coherent framework along the lines sketched above could prove
helpful in implementing more effective policies for poverty alleviation.
References
Ahmad, Ehtisham, Ed. 1996, Financing Decentralized Expenditures. Edward Elgar Publishing Company, Cheltenham.
Bahl, Roy, W. and Johannes F. Linn, 1992, Urban Public Finance in Developing Countries. Oxford
University Press, Oxford.
Bhagwati, Jagdish, 1988, Poverty and public policy. World Development, 16, pp. 539–556.
Bird, Richard M., 1993, Threading the fiscal labyrinth: some issues in fiscal decentralization.
National Tax Journal (June), pp. 207–227.
Bird, Richard M., Jennie I. Litvack and M. Govinda Rao, 1995, Intergovernmental Fiscal Relations
and Poverty Alleviation in Viet Nam. Policy Research Working Paper No. 1430. World Bank,
Washington, DC.
Bird, Richard M. and Christine Wallich, 1993, Fiscal Decentralization and Intergovernmental
Relations in Transitional Economies. Policy Research Working Paper No. 1122. World Bank,
Washington, DC.
Boadway, Robin and Frank Flatters, 1982, Equalization in a Federal State: An Economic Analysis.
Economic Council of Canada, Ottawa.
Bradbury, K. L., H. F. Ladd, M. Perrault, A., Rischovsky, J. Yinger, 1984, State aid to offset fiscal
disparities across communities. National Tax Journal, 37, pp. 151–170.
Breton, Albert, 1990, Centralization, Decentralization and Intergovernmental Competition. Institute
of Intergovernmental Relations, Queen’s University, Kingston.
Brown, C. C. and Wallace Oates, 1987, Assistance to the poor in a federal system. Journal of Public
Economics, 32, pp. 307–330.
Buchanan, J. M., 1950, Federalism and fiscal equity. American Economic Review, 40(4), pp. 583–
599.
Feldstein, M., 1975, Wealth neutrality and local choice in public education. American Economic
Review, 65, pp. 75–89.
Ladd, H. and F. C. Doolittle, 1982, Which level of government should assist the poor. National Tax
Journal, 35, pp. 323–336.
Oates, Wallace, E., 1972, Fiscal Federalism, Harcourt, Brace and Jovanovich, New York.
Oates, Wallace, E., 1977, An economist’s perspective on fiscal federalism. In Wallace E. Oates, Ed.,
The Political Economy of Fiscal Federalism. Lexington Books, Massachusetts.
Pauly, M. V., 1973, Income redistribution as a local public good. Journal of Public Economics, 2,
pp. 35 –58.
Prud’homme, R., 1995, The dangers of decentralization. World Bank Research Observer, 10(2),
pp. 201–220.
Ranis, Gustav, 1995, Another look at the East Asian miracle. World Bank Economic Review, 9(3),
pp. 509 –534.
Rao, M. G. and A. Das-Gupta, 1995, intergovernmental transfers and poverty alleviation. Environment and Planning C: Government and Policy, 13(1), pp. 1–23.
Rondinelli, Dennis, A., 1996, International Experience with Administrative Decentralization. Paper
presented at the seminar on Fiscal Decentralization and Rural Service Delivery, Ha Noi: Central
Institute of Economic Management and the World Bank, March 15.
Shah, Anwar, 1994, The Reform of Intergovernmental Fiscal Relations in Developing and Emerging Market Economies. World Bank Policy and Research Series Paper No. 23. World Bank,
Washington, DC.
Tanzi, Vito, 1995, Fiscal Decentralization. Paper at Annual Bank Conference on Development
Economics. World Bank, Washington, DC.