In our Backkyard pdf
Bạn đang xem bản rút gọn của tài liệu. Xem và tải ngay bản đầy đủ của tài liệu tại đây (534.82 KB, 41 trang )
RAND is a nonprofit institution that helps improve policy and decisionmaking through research
and analysis. RAND
®
is a registered trademark. RAND’s publications do not necessarily reflect
the opinions or policies of its research sponsors.
Published 2002 by RAND
1700 Main Street, P.O. Box 2138, Santa Monica, CA 90407-2138
1200 South Hayes Street, Arlington, VA 22202-5050
201 North Craig Street, Suite 202, Pittsburgh, PA 15213-1516
RAND URL: />To order RAND documents or to obtain additional information, contact Distribution
Services: Telephone: (310) 451-7002; Fax: (310) 451-6915; Email:
© Copyright 2002 RAND
All rights reserved. No part of this book may be reproduced in any form by any electronic or
mechanical means (including photocopying, recording, or information storage and retrieval)
without permission in writing from RAND.
Library of Congress Cataloging-in-Publication Data
Pebley, Anne R., 1953–
In our backyard : how 3 L.A. neighborhoods affect kids’ lives / Anne R. Pebley,
Mary E. Vaiana.
p. cm.
“MR-1470.”
ISBN 0-8330-3204-6
1. Children—California—Los Angeles—Social conditions. 2. Child development—
California—Los Angeles. 3. Neighborhood—California—Los Angeles. 4. Community
life—California—Los Angeles. I. Vaiana, Mary E. II.Title.
HQ792.C (California)+
305.23'09794'94—dc21
2002068040
Book design by Eileen Delson La Russo
iii
Preface
This book is intended for a general audience interested in learning more about the
subtle interaction between children’s well-being and the neighborhoods in which
they grow up. The book should also be of interest to community groups, health
services agencies, and other groups that want to support children by improving
their environment.
Our discussion is based on information drawn from the Focused Study of
Children and Neighborhoods (FSCN), a survey of three neighborhoods in Los
Angeles conducted in 1998. Unless otherwise noted, all of the tables and graphs in
the text are based on data from the 91 families included in that survey. We also
used information from the survey to construct the highlighted vignettes of children.
These vignettes are composites of real children, but they do not represent any par-
ticular child.
The endnotes provide references and more details about the FSCN. For read-
ers who want to know more about the topics in this report, we provide a list for
further reading.
v
Acknowledgments
The Focused Study of Children and Neighborhoods, on which this book is based,
was supported by a grant from the W. M. Keck Foundation and by a generous gift
from Jane and Ronald L. Olson. However, the authors are solely responsible for all
statements and any errors made in this publication.
We are also grateful to our RAND colleagues Eileen La Russo, whose inno-
vative page design gracefully links graphics and text, and Sandra Petitjean, who
produced the book’s graphics. Christina Pitcher edited the text. The book was
enhanced by the thoughtful comments of our technical reviewers, Jill Cannon and
Lynn Karoly.
The RAND Survey Research Group conducted the fieldwork for this study,
under the capable direction of Jennifer Hawes-Dawson. We would also like to thank
Robert Reville, Chris Fair, Shirley Nederend, Mary Lou Gilbert, Audrey Tatum,
Roberto Guevara, and Victoria Beard for their participation in this project.
1
Why care about neighborhoods?
P
eople love to talk about their neighborhoods, and everyone is an expert on the
topic. They have definite opinions about the kinds of people who live in the
neighborhood, the kinds of houses they live in, and how much money residents
make. They know if their neighborhood is safe or dangerous—and if the latter,
where and when. They have definite opinions about the neighborhood’s bound-
aries—the streets or businesses that they think constitute its edges. But each resi-
dent may have a slightly different notion of these boundaries, and boundaries may
change depending on what a resident is doing—going to work, shopping, or going
to religious services. And all of these notions of boundaries may differ from how the
U.S. Census Bureau defines the neighborhood.
Residents also feel that neighborhoods affect children’s welfare. Sociologists
and other scholars agree. Safer neighborhoods, how much contact neighbors have
with each other, whether they are willing to assume responsibility for each other
and for the neighborhood’s children in an emergency,
how involved residents are in local organizations—
these and other characteristics of a child’s environment
seem to be associated with kids who are healthier and
less likely to have problems at school or at home.
Given the potential nature and size of these
effects, it is no exaggeration to think of neighborhoods
as the foundation on which the basic social and eco-
nomic structure of society is built. The sidebar on the following page lists some
common beliefs about how neighborhoods influence children.
1
All of these ideas
make sense, but the available evidence on each is limited.
In Our Backyard
How 3 L.A. Neighborhoods Affect Kids’ Lives
It is no exaggeration to think of
neighborhoods as the foundation on which
the basic social and economic structure
of society is built.
2
In our work, we set out to answer two basic
questions:
• What exactly is a neighborhood?
• Which particular characteristics of neighbor-
hoods are important for kids?
It’s relatively easy to begin answering the first
question in older and more densely populated cities
such as New York, Boston, or Chicago. In these cities,
neighborhoods have been established for a longer time
and tend to be relatively stable. And they have been
studied a great deal. But the question is more complex
in a city like Los Angeles. L.A. is the largest and most
important example of a new type of environment
increasingly common in the southwest—for example,
Phoenix and San Diego. Spread out over a wide area,
the urban landscape includes many separate city cen-
ters. It’s not clear that lessons learned from studying
neighborhoods in New York or Boston are applicable
to cities like L.A.
Understanding how the individual characteristics
of neighborhoods affect kids is a complicated under-
taking. Take the example of a study of teenagers in
Chicago that concludes that less juvenile delinquency
and violence occurs in neighborhoods with trees and
green space. Why is that true? It may be that children’s
physical surroundings have direct effects on their
behavior. However, poor neighborhoods that have
more trees are also likely to be different from other
poor neighborhoods in many ways. For example, they
may have active community development groups,
more involved residents, and better after-school pro-
grams for children.
Figuring out which neighborhood characteristics
make a difference in children’s development isn’t just
a matter of academic interest. For example, in the
Chicago study mentioned above, unless we understand
the underlying reason for the association between trees
Some Common
Ideas About
How Neighborhoods
Affect Children
• Contagion: Problem behavior is spread
by peer influences
• Neighbors as role models: Adults other
than parents serve as role models
• Neighborhood institutions: Schools,
churches, day-care centers, after-school
programs are the key
• Relative deprivation: Kids may be better
off in neighborhoods where others are
of the same socioeconomic status
• Negative effects of a stressful environ-
ment: More stressful neighborhoods
result in poorer parenting
3
and children’s behavior, we may draw seriously
misleading conclusions and take actions, such as
tree-planting programs, which in the end have little
effect and reduce potential resources or support for
programs that might be effective.
We recently took a close look at three neighbor-
hoods in Los Angeles County to learn more about the
link between neighborhood characteristics and the quality of children’s lives. Our
work provides a rare window on the patterns of daily living in these geographically
close, yet rather different worlds.
Hitting the streets in L.A.
L
os Angeles provides an ideal laboratory for studying neighborhoods and chil-
dren because the neighborhoods within the county are tremendously diverse—
in ethnicity, social class, governmental structure, school systems, employment,
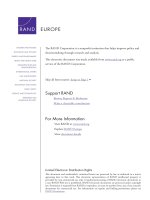
and even terrain. We chose the neighborhoods for our investigation carefully to rep-
resent a wide range of experiences. The map on page 4 shows the general areas we
selected, but in fact we examined only one census tract in each area. (A census tract
is a relatively small area containing 3,000–6,000 people.) The specific census tracts
we chose must remain confidential to protect the resi-
dents, but we’ll use the names of the larger areas—
Culver Marina, East L.A., and Windsor View—as a
convenient way to refer to the neighborhoods.
How do you listen to the heartbeat of a neigh-
borhood? The most obvious answer is “hit the streets.”
We drove and walked around the neighborhoods, talked to residents, and visited
local businesses. We recorded what we saw, creating a detailed picture of physical
characteristics of the neighborhood and daily life within it.
Then we conducted a survey of residents. We gathered information about the
lives, opinions, and experiences of about 30 individual families in each neighbor-
hood. For example, we asked questions about how long people had lived in the
neighborhood, whether they had close friends and family living nearby, and how
safe they thought the neighborhood was. We inquired about their income and their
commuting distance to work, shopping, and schools. We asked residents to define
the boundaries of their neighborhood and to tell us how responsible they felt for
the behavior of neighborhood children.
How do you listen to the heartbeat of
a neighborhood? The most obvious answer
is “hit the streets.”
4
To learn about how neighborhoods and family life affect children, we talked
with the adult in each household who had primary responsibility for taking care of
the children—in most households this was the mother. We randomly chose one
child in the household and asked about the child’s health, friends, school perform-
ance, and general mood.
To fill in the picture, we talked to shopkeepers and social service agencies
such as after-school programs and recreation centers. More information about how
we conducted the survey appears at the end of this book.
210
5
10
110
405
5
605
710
10
210
101
60
Major highways
Study area
N
Scale:
01020 miles
Long Beach
Malibu
Los Angeles
Los Angeles
County
Location of Study Areas in Los Angeles County
5
Community profiles
L.A.
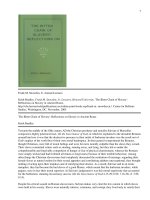
is a city dramatically
shaped by immi-
gration. The 2000
Census documents sweeping
changes in Southern California,
as Latinos and Asians have dis-
placed whites and African Americans. But each com-
munity, reflecting its own history, echoes the general
pattern in its own idiosyncratic way.
Culver Marina is located in the western portion
of Los Angeles. The area was part of Rancho La
Ballona before U.S. annexation of California. Rancho
La Ballona was sold and subdivided by real estate
developers beginning in the 1880s. Real estate devel-
opment accelerated during the 1920s and 1930s.
During this period, the Culver Marina neighborhood
also began to attract investment by movie studios and
maritime-oriented light industry.
The Culver Marina neighborhood originally
attracted primarily white middle-income families;
however, more recently it has become a very ethnically
diverse area, attracting Latino and African American
families as well as, more recently, immigrants from
Latin America and Asia. The neighborhood is primar-
ily residential although there are several commercial
retail and small-scale industrial areas in or near the
neighborhood. The residential areas consist mostly of
moderate-density single-family dwellings. Parts of
this neighborhood are overlaid by major freeways and
large boulevards. However, despite the substantial
commercial, industrial, and freeway development in
the area, the Culver Marina neighborhood still retains
the feeling of a suburban community where children
play football in the street and neighbors sit out in their
front yards in the evening.
Neighborhood
Profile—Susan
Susan is 9 years old and lives with her
parents, Emily and John. Susan’s parents
are Filipino immigrants who arrived in
the United States in the early 1980s. At
home they speak English and Tagalog.
Susan was born in Los Angeles.
Susan’s father and mother are both
college graduates. Her mother works as
a medical technician and her father as
a sales manager. Her parents’ combined
income is about $150,000 per year. The
family has lived in Culver Marina for
about three years. They moved to Los
Angeles from Seattle. They have a num-
ber of other family members in the
neighborhood and many good friends as
well. The family is active in their church
and in a soccer club. John also regularly
works out at the neighborhood YMCA.
Susan attends a private elementary
school in her neighborhood. She does
very well in school, mostly getting A’s. Her
parents report few behavior problems at
home or at school. Susan is generally a
happy and cheerful, though quiet, child.
Susan’s health is generally very good.
She is covered by health insurance from
her mother’s job and had a medical
checkup about a year ago.
6
Immigration has shaped these communities in different ways
1980
1990 2000
White African American Asian Latino Other
East L.A.
Culver Marina
Windsor View
7
[Culver Marina] has a small-town feel that seems out of place on the trendy
Westside . . . but residents are fiercely proud of their turf.
—L.A. Times, April 26, 1996, Home Edition, Metro section,
Part B, p. 2.
East L.A. is located east of downtown Los Angeles. During much of the
19th century, the land in this area was used for farming, initially by Spaniards and
Mexicans and subsequently by American migrants from the Midwest and other
parts of the United States. Residential development gradually pushed out agriculture
beginning in the late 19th century and early 20th century.
At the beginning of the twentieth century, East Los Angeles became a popular
immigrant destination. In the early 1900s, Russians, Jews, Japanese, and
Mexicans all had a significant presence in the area. Living east of the river
and working in nearby factories, or traveling by electric rail into downtown
Los Angeles, immigrants and their children helped fuel the prosperity of the
growing metropolis. By the onset of World War II, East Los Angeles was a
nearly exclusively Latino community, soon reinforced by Mexican workers who
arrived to man the machines in the area’s burgeoning war industries. Although
the face of the city of Los Angeles and its surrounding communities has
changed considerably, East Los Angeles has maintained this basic character
throughout the last sixty years.
—County of Los Angeles Public Library web site,
www.colapublib.org/history/eastla/, accessed May 17, 2002.
The population of East L.A. now includes Latino families who have lived in
Los Angeles for many generations as well as recent arrivals from Mexico. The East
L.A. neighborhood consists primarily of single-family homes and some apartments
near commercial retail areas and factories in which many East L.A. residents work.
In East L.A., the front yard is the focus, a place of wrought-iron gates and
colorful roses, where neighbors gather on the porch and talk across the fence.
—L.A. Times, Sept. 2, 1999, Home Edition, Southern California
Living section, Part E, p. 1, View Desk.
Windsor View is located west of downtown Los Angeles. The first Spanish set-
tlements in the area were ranchos in the early 1800s. As happened elsewhere in the
Los Angeles basin, most of the ranchos were sold to real estate developers and sub-
divided for housing developments during the 1880s. Rail lines from downtown were
built to allow residents to commute to work and shopping. However, in the Windsor
View area, agriculture also remained important until well into the early 20th century.
During the 1940s and 1950s, the Windsor View neighborhood and surround-
ing communities were developed with single-family homes. During the 1950s
and 1960s, Japanese Americans and African Americans began moving into the
single-family homes in the area, and a thriving residential and commercial commu-
nity developed in part of this neighborhood. The arrival of Japanese Americans
and African Americans in Windsor View was an important landmark in Los Angeles
history because it broke the ethnic exclusion barriers that had previously limited
settlement in western Los Angeles to whites only.
Most of the development of the Windsor View neighborhood took place dur-
ing the 1950s and 1960s. Subsequent residential development has generally taken
the form of subdivision of single-family homes into multifamily apartments. During
the 1970s, Japanese Americans and whites began to move from Windsor View to
other areas of the city. As a result of this transition and of in-migration by middle-
class African American professionals and their families, Windsor View today is a
middle- and upper-income African American neighborhood where most residents
have lived for several years and own their own homes.
8
Neighborhood Profile—Andrew
Andrew, age 8, lives with his parents and 3-year-old brother in Windsor View. His family is African
American, and his parents were born in Los Angeles. Both of his parents are college graduates and
have good jobs. The family’s annual income is about $130,000.
The family has lived in Windsor View for about two years. They moved to the neighborhood
because it is very safe and offered nicer housing within their price range. Andrew’s mother’s job is
about 10 minutes away from home, but Andrew’s father commutes about half an hour to work.
Andrew attends a private school about 20 minutes away from home. His mother says he does
very well in school and has very few behavior problems at school or at home.
Andrew has a lot of friends, but most do not live in his neighborhood. Part of the reason is that
many friends attend the same private school but live in other neighborhoods. Nonetheless, friends
come to Andrew’s house frequently, generally driven over and picked up by their parents.
Andrew has been covered since birth by health insurance provided by his father’s employer. His
mother says he is in excellent health, although he had problems with allergies and asthma a few years
ago. His last medical checkup was four months ago.
9
People in [Windsor View] say a friendly sense of community and stability
pervades life there.
— L.A. Times, Sunday, December 27, 1998, Real Estate section,
Part K, p. 1.
The human landscape
A
mong the neighborhood characteristics that researchers and specialists in child
development think are important for children are the age of the community’s
residents, their incomes, and residential turnover in the neighborhood. Our
three neighborhoods differ substantially on all three dimensions.
Age
Since 1970, all three neighborhoods have changed markedly in terms of age struc-
ture, mirroring major demographic trends in Los Angeles and in the United States
as a whole, but also reflecting the unique experience of each community. These
changes are highlighted in the bar charts on the following pages.
For each community, there are four sets of bars showing the demographic
makeup of its population based on the U.S. Census in 1970, 1980, 1990, and 1997
(the most recent year for which Census data are currently available). The bars
highlight three stages of life. The lowest bars on each graph show children up to
19 years of age. The middle bars include working-age adults, ages 20 to 64, who
shoulder the primary responsibility for raising children and earning income to
support their families. At the top of the graph are senior citizens, defined here as
people age 65 and older. Many senior citizens are
retired from the workforce, although they can play
an important role in their neighborhoods through
activities such as volunteering and helping to care for
grandchildren. Looking down a column of bars in
the graphs provides a comparison snapshot of the population’s age in the three
communities at a point in time. Looking across a row of bars gives a sense of how
the age structure in a given community has changed over the past 30 years.
Since 1970, Windsor View has been the “oldest” of the three neighborhoods—
that is, Windsor View residents have, on average, been older than residents of
Culver Marina and East L.A. In 1970, the average age of Windsor View residents
was about 37 years. As the graph for 1970 shows, a large proportion of adult
Windsor View residents were ages 35 to 64, reflecting the higher incomes and larger
Since 1970, Windsor View has been the
“oldest” of the three neighborhoods.
10
Culver Marina — 1970 Census (male and female)
024681012
0 to 4
5 to 9
10 to 14
15 to 19
20 to 24
25 to 29
30 to 34
35 to 39
40 to 44
45 to 49
50 to 54
55 to 59
60 to 64
65 to 69
70 to 74
75 +
Age
Percentage
Culver Marina — 1980 Census (male and female)
024681012
0 to 4
5 to 9
10 to 14
15 to 19
20 to 24
25 to 29
30 to 34
35 to 39
40 to 44
45 to 49
50 to 54
55 to 59
60 to 64
65 to 69
70 to 74
75 +
Age
Percentage
East L.A. — 1970 Census (male and female)
024681012
0 to 4
5 to 9
10 to 14
15 to 19
20 to 24
25 to 29
30 to 34
35 to 39
40 to 44
45 to 49
50 to 54
55 to 59
60 to 64
65 to 69
70 to 74
75 +
Age
Percentage
East L.A. — 1980 Census (male and female)
024681012
0 to 4
5 to 9
10 to 14
15 to 19
20 to 24
25 to 29
30 to 34
35 to 39
40 to 44
45 to 49
50 to 54
55 to 59
60 to 64
65 to 69
70 to 74
75 +
Age
Percentage
Windsor View — 1970 Census (male and female)
024681012
0 to 4
5 to 9
10 to 14
15 to 19
20 to 24
25 to 29
30 to 34
35 to 39
40 to 44
45 to 49
50 to 54
55 to 59
60 to 64
65 to 69
70 to 74
75 +
Age
Percentage
Windsor View — 1980 Census (male and female)
024681012
0 to 4
5 to 9
10 to 14
15 to 19
20 to 24
25 to 29
30 to 34
35 to 39
40 to 44
45 to 49
50 to 54
55 to 59
60 to 64
65 to 69
70 to 74
75 +
Age
Percentage
Major Demographic Shifts, 1970–1997
11
Culver Marina — 1990 Census (male and female)
024681012
0 to 4
5 to 9
10 to 14
15 to 19
20 to 24
25 to 29
30 to 34
35 to 39
40 to 44
45 to 49
50 to 54
55 to 59
60 to 64
65 to 69
70 to 74
75 +
Age
Percentage
Culver Marina – 1997 Census (male and female)
024681012
0 to 4
5 to 9
10 to 14
15 to 19
20 to 24
25 to 29
30 to 34
35 to 39
40 to 44
45 to 49
50 to 54
55 to 59
60 to 64
65 to 69
70 to 74
75 +
Age
Percentage
East L.A. — 1990 Census (male and female)
024681012
0 to 4
5 to 9
10 to 14
15 to 19
20 to 24
25 to 29
30 to 34
35 to 39
40 to 44
45 to 49
50 to 54
55 to 59
60 to 64
65 to 69
70 to 74
75 +
Age
Percentage
East L.A. — 1997 Census (male and female)
024681012
0 to 4
5 to 9
10 to 14
15 to 19
20 to 24
25 to 29
30 to 34
35 to 39
40 to 44
45 to 49
50 to 54
55 to 59
60 to 64
65 to 69
70 to 74
75 +
Age
Percentage
Windsor View — 1990 Census (male and female)
024681012
0 to 4
5 to 9
10 to 14
15 to 19
20 to 24
25 to 29
30 to 34
35 to 39
40 to 44
45 to 49
50 to 54
55 to 59
60 to 64
65 to 69
70 to 74
75 +
Age
Percentage
Windsor View — 1997 Census (male and female)
024681012
0 to 4
5 to 9
10 to 14
15 to 19
20 to 24
25 to 29
30 to 34
35 to 39
40 to 44
45 to 49
50 to 54
55 to 59
60 to 64
65 to 69
70 to 74
75 +
Age
Percentage
12
savings required to purchase a house or condo in this
neighborhood. The 1970 graph also shows that, like
the rest of the United States, Windsor View participated
in the post–World War II baby boom, which lasted
into the mid-1960s. As a result, by 1970, a large pro-
portion of children living in Windsor View had been
born during the baby boom.
In the intervening years, the population of
Windsor View has become even older: In 1997, the
average age of Windsor View residents was about 43
years. This aging process probably took place in three
ways: (1) people who stayed in Windsor View during
this entire period began to have fewer children (like the rest of the U.S. population
after about 1970) and subsequently became older themselves, (2) families with
younger children were less likely to move into Windsor View because housing there
is more expensive than in other neighborhoods, and (3) middle-aged and older
adults without children (either “empty-nesters” or adults who did not have children),
who could more easily afford Windsor View housing prices, were more likely to
move into the neighborhood.
As a result, only about 20 percent of Windsor View residents in 1997 were
under the age of 20. And the ratio of children to seniors (the number of children
19 and younger divided by the number of seniors 65 and older) was about 1 to 1—
in other words, there were about equal numbers of seniors and children in Windsor
View in 1997. During the time we spent in Windsor View, it became apparent that
there were far fewer children in this neighborhood than in the other two. It was
more difficult to locate families with children, and interviewers observing neighbor-
hood life rarely saw children playing outside or going to school. In addition, as
we will see later on, Windsor View is a very stable neighborhood, where neighbors
have often known each other for years. Therefore, although children in Windsor
View are less likely to find other children of their own age to play with in their
neighborhood, they may grow up knowing more adult neighbors in a supportive
environment.
Reflecting a national trend, the number of residents age 75 and older grew
rapidly in Windsor View during this more recent period. Throughout the United
States, these older seniors have benefited from substantial declines in mortality and
increases in life expectancy.
Culver Marina has experienced even more dramatic aging of its population
than Windsor View. In 1970, the average age of Culver Marina residents was about
13
29 years, the youngest of all three neighborhoods.
As the graph for 1970 shows, the age structure of
the population was dominated by children, in part
because of the nationwide baby boom during the
1950s and 1960s, and also because of the availability
of low-cost housing for young families in this newly
developed area. The Culver Marina neighborhood
was a very “child-friendly” place in which children could easily find friends their
own age to play with. At the other end of the age spectrum, there were few seniors
in Culver Marina in 1970, because Culver Marina was developed relatively recently
and attracted primarily younger families.
As the bar charts show, since 1970 the number of children has declined as a
proportion of the population of Culver Marina, while the number of seniors has
increased markedly. Culver Marina has changed from a recently developed residen-
Neighborhood Profile—Samantha
Samantha, age 6, lives with her 33-year-old aunt Hope and her 70-year-old grandparents, Jordan and
Carol. Jordan, who is Samantha’s legal guardian, identifies her ethnicity as multiracial. Like his own, it
includes African American, white, and Native American ancestors.
Samantha’s grandfather completed two years of college and worked for most of his life in a
manufacturing plant but is now retired, as is his wife. The family’s income comes primarily from Social
Security payments, Jordan’s veteran’s pension, income from rental property, and Hope’s salary.
Jordan and Carol have lived in Windsor View for 35 years. Samantha’s mother used to live with
them, but moved to Chicago several years ago. When Samantha was born, her mother was having
financial and health problems. She took Samantha to live with her grandparents, where she has lived
ever since.
Family life is generally happy. No other family members live in the neighborhood, but there are
lots of friends around. The family has visitors several times a week.
Samantha entered her local public elementary school last year. Her grandfather reports that she
has few behavior problems and gets mostly A’s.
The family is moderately involved in neighborhood activities, often at their neighborhood church.
Carol sometimes takes Samantha to the library for story hour. Family members all enjoy reading and
have many books and magazines at home.
The Culver Marina neighborhood was a
very “child-friendly” place in which
children could easily find friends their own
age to play with.
14
tial area settled predominantly by young families with
children to a more rooted and older neighborhood in
which middle-aged adults and seniors have come to
dominate the population. By 1997, the average age of
Culver Marina residents was 39 years, a full 10 years
older than the average in 1970. However, unlike
Windsor View, Culver Marina still has more children
under age 20 than seniors age 65 and over: The ratio
is 1.2 children per senior, compared with only 1 child
per senior in Windsor View.
Rather than aging, the population of the East
L.A. neighborhood actually became younger between
1970 and 1997: The average age declined from 35
years in 1970 to 32 years in 1997. The change
occurred primarily because of an influx of young
adults and their children into this neighborhood.
Some of these young families were recent immigrants,
while others were native Angelenos who wanted to
take advantage of the neighborhood’s lower housing
and rental prices. The graphs also show the effects
of a slightly higher birth rate in East L.A. than in the
other two neighborhoods.
Because of these changes in age structure, the
ratio of children to seniors in East L.A. was very high.
For every senior age 65 and older, there were three
children under age 20. As we noted above, the major-
ity of working-age adults in East L.A. was also relatively
young compared with the other two neighborhoods in
the study. As a result, residents of the East L.A. neigh-
borhood were primarily young families with children.
Income
Windsor View was the wealthiest of the three neigh-
borhoods, and, not surprisingly, its residents were the
best educated, since education and income tend to
be closely connected. A substantial number of families
had incomes above $100,000 a year and had four
Neighborhood
Profile—Casey
Casey is 16 years old and lives with her
45-year-old father Jim. Jim is divorced
from Casey’s mother and has custody.
Casey and Jim are white and have lived
in Culver Marina since the divorce, about
five years.
Jim is a high school graduate who
is currently unemployed. His most recent
job was as a police officer. The family
income this year has been about $65,000,
and Jim and Casey are living primarily
off of Jim’s savings and investments. Jim
expects to have another job very soon.
As a single father, it hasn’t been easy
for Jim to raise Casey, especially since he
has been unemployed. He reports that
they argue quite a bit and that Casey has
serious behavior problems at home.
Casey attends a public school about
four miles from her home. Although Jim
reports that she is not considered to have
problem behavior at school, she has been
suspended a few times. She has also
skipped school a few times without per-
mission. Her school performance has not
been very good either: She gets primarily
C’s. Despite these problems, the school
has not asked Jim to meet with Casey’s
teachers or principal during the past 12
months to talk over Casey’s problems.
Casey has about five close friends but
brings them home only occasionally. None
of the friends live in her neighborhood.
15
years of post–high school education. In contrast, almost all families in East L.A.
had incomes below $50,000 a year and a high school education. Culver Marina
fell between the other two neighborhoods in terms of income and education,
but residents in both Culver Marina and East L.A.
were significantly less likely than their Windsor View
counterparts to say that they were better off than the
average Californian.
Income differences can drive important deci-
sions that parents make for the sake of their children.
We asked parents if they had ever done the following things to make life better
for their kids: (a) moved to a different neighborhood, (b) increased work hours or
taken a second job, and (c) reduced their work hours or refused extra work.
Parents in Windsor View were significantly more likely to have moved and to
have reduced their work hours. These middle-class parents could afford to move to
Culver Marina
East L.A.
Windsor View
Percentage of parents
08070605040302010
Moved to a different neighborhood
Increased work hours or took a second job
Reduced work hours or refused extra work
What parents in these communities have done
to make life better for their children
Windsor View was the wealthiest of the
three neighborhoods, and, not surprisingly,
its residents were the best educated.
16
Residential Stability Is Not Always Related to Home Ownership
Neighborhood
Culver Marina 63 37
East L.A. 48 50
Windsor View 72 69
Percentage of families
owning their home
Percentage of families
living in same home
for 5+ years
a better neighborhood and work less so that they could stay home with their kids.
Like other middle-class parents, they often feel that spending more time with their
children is the best way to improve their children’s well-being. In contrast, parents
in East L.A. were more likely to have increased their work hours or taken a second
job. East L.A. parents were less likely to be able to afford to move to a better neigh-
borhood than were parents in Windsor View. Since these families are poorer, they
are more likely to feel that bringing home more money is the best way to improve
their kids’ lives.
Residential turnover
Given the average financial status of residents in each of the three neighborhoods,
it is not surprising that Windsor View had the lowest proportion of renters, while
East L.A. had the highest. Common sense suggests that families are more likely to
remain in neighborhoods and to invest their time and energy in their neighbor-
hoods when they own their own homes—primarily because they feel they have a
greater stake in the neighborhood.
However, results from our study show that residential turnover is not always
closely related to home ownership. For example, residential stability (defined as the
percentage of our respondents living in the same
home for more than five years) was lowest in Culver
Marina, but East L.A. had a smaller proportion of
home owners than Culver Marina. Residential sta-
bility was very high in Windsor View, where about
three-quarters of residents owned their own homes, but it was also high in East
L.A., with half of the residents living in the same home for at least five years.
Families who own their own home have a
greater stake in the neighborhood.
17
How big is a child’s neighborhood?
D
uring our discussions with neighborhood residents, we asked them to tell us
how big their neighborhood was. We wanted to know whether there was gen-
eral agreement about neighborhood boundaries and, if there were differences,
what might cause them. We found that residents had very clear ideas about the
boundaries of their neighborhoods, but they didn’t necessarily agree about where
those boundaries lie. In fact, individual residents might define boundaries differently
depending on whether they were considering where they shop, where their kids go
to school, or where they go to religious services.
To illustrate this variation, we show on page 18 one resident’s multiple bound-
aries, which fan out from the street on which he lived. The smallest boundary was
defined by his knowledge of his immediate neighbors and his contact with them.
The second boundary was defined by a problem he had with a single resident and
the subsequent process of uniting with other residents to cope with the problem. The
most expansive boundary was defined through his contact with the police depart-
ment; this boundary corresponded quite closely to
the map displayed at his neighborhood watch meet-
ings. These multiple boundaries reflect the diversity
of his personal experience in the neighborhood.
Why is it important to understand how people
think about their neighborhood’s physical dimen-
sions? It matters for the same reason that we want to
understand exactly why neighborhoods with trees have less juvenile delinquency.
Understanding where most family activities take place helps nonprofit organizations
and agencies decide where to focus efforts to improve children’s lives. For example,
can an after-school program intended to serve a particular neighborhood be ten
miles away and still be convenient for parents? Or does it need to be closer? In addi-
tion, the expansiveness with which people define their neighborhoods seems to go
hand in hand with how responsible they feel personally for others who live in the
neighborhood, including children.
From our discussions with residents, we learned that there is a great deal of
variation in how people who live in the same neighborhood perceive its boundaries.
For example, we asked residents in each community to tell us how big they thought
their neighborhood was. The figure on the top of page 19 summarizes their answers.
Boundary definitions varied both between and within neighborhoods. For example,
Residents had very clear ideas about the
boundaries of their neighborhoods, but
they didn’t necessarily agree about where
those boundaries lie.
18
A Culver Marina resident’s
multiple definitions of his neighborhood
Day-to-day perception of the neighborhood
Expanded definition from dealing with problem neighbor
Boundary defined through participation in Neighborhood Watch
the majority of people living in the Culver Marina neighborhood said that their
neighborhood included the block they live on plus several blocks in each direction.
In the Windsor View neighborhood, most residents said that their neighborhood
included the area within a 15-minute walk from their house, or an even larger area.
East L.A. neighborhood residents gave the broadest range of answers, signaling even
less agreement on neighborhood boundaries than in the other two neighborhoods.
19
Average Travel Time to Daily Activities
Daily Destination
Respondent’s job 18 minutes 20 minutes 19 minutes
Spouse’s employment 18 minutes 17 minutes 20 minutes
Place of worship 11 minutes 12 minutes 13 minutes
Children’s school 10 minutes 9 minutes 15 minutes
Children’s day care 8 minutes 9 minutes 11 minutes
Grocery store 6 minutes 6 minutes 8 minutes
Culver Marina
East L.A.
Windsor View
Percentage of residents
0506040302010
Block or street family lives on
Several blocks or streets in each direction
Area within a 15-minute walk from home
Area larger than a 15-minute walk
Windsor View residents have the most
expansive definition of their neighborhood
Culver Marina East L.A. Windsor View
20
Despite these differing definitions, the areas surrounding where families live
clearly do play an important role in residents’ daily lives, in all three neighborhoods.
Although Los Angeles is well known for hour-long commutes to work, the table on
the previous page shows that residents in these neighborhoods generally reported
working within 17 to 20 minutes of home. Children’s schools and day-care providers,
places of worship, and grocery stores were even closer.
The neighborhood environment
W
hat is it like for children to live in these neighborhoods? Experts think that
several aspects of neighborhood social environment are particularly important
for children, including
• safety
• whether neighbors know each other
• social cohesion—that is, the involvement of adults in monitoring the
neighborhood and intervening when necessary.
2
Safety
Residents of the Culver Marina and East L.A. neighborhoods generally believed their
neighborhoods were safe, but virtually all residents in Windsor View believed that
their neighborhood was safe.
Percentage of residents
who think their neighborhood is safe
Culver Marina
East L.A. Windsor View
Safe
Not safe
21
Interaction with neighbors
An important aspect of a neighborhood’s social environment is how much regular
interaction there is among neighbors. Many studies suggest that if neighbors know
and trust each other they are more likely to take action to ensure the safety and
well-being of neighbors and the neighborhood. They are also more likely to watch
out for neighborhood children and to make sure they are not getting into trouble.
It’s not that neighbors need to be good friends and spend a lot of time with
each other to create a positive social environment for children. In fact, many “child-
friendly” neighborhoods are not necessarily close-knit
communities. Rather, it’s important that residents
know who their neighbors are, have basic trust in
them, and share common values.
We looked at several different measures of social
interaction in these neighborhoods.
First, we examined what proportion of respon-
dents reported having family members (not including
those living in the respondent’s own household) or good friends living in the neigh-
borhood. About one-third of respondents in Culver Marina and Windsor View
reported that at least one family member lives in their neighborhood. In East L.A.,
more than half of the respondents reported having family in the neighborhood.
Although this may appear surprising given the influx of immigrant families to East
L.A. in the 1980s and 1990s, it reflects a long tradition of families living near each
other in East L.A. and of recent immigrants settling near family members who
arrived earlier.
A majority of respondents reported that they have at least one good friend
living in their neighborhood. Neighborhood friendships are easier to form the
longer one lives in a neighborhood. Thus, it is not surprising to find that residents
in the neighborhood with the least residential stability, Culver Marina, were the least
likely to report that they have a good friend in the neighborhood. Windsor View,
which has the highest residential stability, also had the highest proportion of
respondents reporting that they have at least one good friend in the neighborhood.
Similarly, while respondents in Culver Marina reported talking regularly to
about six adults in their neighborhood, residents in East L.A. talked regularly with
about seven, and Windsor View residents with more than eight. So residential sta-
bility appears to increase both the number of adults residents know in the neigh-
borhood and the chances of having a good friend living there.
If neighbors know and trust each
other, they are more likely to take action
to ensure the safety and well-being of
neighbors and the neighborhood.