An Economic Risk Analysis of Tillage and Cropping Systems on the Arkansas Grand Prairie
Bạn đang xem bản rút gọn của tài liệu. Xem và tải ngay bản đầy đủ của tài liệu tại đây (106.6 KB, 22 trang )
An Economic Risk Analysis of Tillage and Cropping Systems on the Arkansas
Grand Prairie
Jeffrey A. Hignight, K. Bradley Watkins, and Merle M. Anders*
Contact Author:
Jeffrey Hignight
University of Arkansas Rice Research & Extension Center
2900 Hwy. 130 E.
Stuttgart, AR 72160
(870) 673-2661
*The authors are, respectively, Program Associate-Economics, Associate Professor-Economics,
and Assistant Professor-Agronomy. All are with the University of Arkansas, Division of
Agriculture, located at the Rice Research and Extension Center, Stuttgart, AR.
Selected Paper prepared for presentation at the Southern Agricultural Economics Association
Annual Meeting, Orlando, FL, February 6-9, 2010
Copyright 2010 by [Hignight, Watkins, and Anders]. All rights reserved. Readers may make
verbatim copies of this document for non-commercial purposes by any means, provided that this
copyright notice appears on all such copies.
An Economic Risk Analysis of Tillage and Cropping Systems on the Arkansas Grand
Prairie
Abstract
No-till (NT) has been shown to reduce fuel, labor, and machinery costs compared to
conventional-till (CT) but very few rice producers in Arkansas practice NT. The low adoption
rate is most likely due to difficulties in management but also limited information on the
profitability and risk of NT. Most rice producers are knowledgeable on NT costs savings but
consider it less profitable due to yield reductions offsetting costs savings. This study evaluates
production costs, crop yields, and economic risk of both NT and CT in five rice-based cropping
systems (continuous rice, rice-soybean, rice-corn, rice-wheat, and rice-wheat-soybean-wheat).
Yields, crop prices, and key input prices are simulated to create net return distributions.
Stochastic efficiency with respect to a function (SERF) is used to evaluate profitability and risk
efficiency. Results indicate that a risk-neutral and risk-averse producer in either NT or CT
would prefer a rice-soybean rotation. NT would be preferred over CT in the rice-soybean
rotation across all risk preferences. Overall, risk-neutral producers would prefer NT in four of
five cropping systems while risk-averse producers would prefer NT in three of five cropping
systems.
Key Words: cropping systems, rice, no-till, certainty equivalent, risk premium
An Economic Risk Analysis of Tillage and Cropping Systems on the Arkansas Grand
Prairie
Introduction
No-tillage (NT) crop production in the United States has increased in popularity in areas
growing corn and soybeans where irrigation is not required and accounts for approximately
22.6% of planted acres (Peterson, 2005). Information collected from no-tillage production areas
indicates that converting from conventional-tillage (CT) to NT can improve soil quality through
increased organic matter and improved water infiltration (Rachman et al., 2003). In addition, NT
can provide social benefits through improved water and air quality.
A study in the southwestern Ohio and southeastern Indiana watersheds indicated that
water quality improved in rivers and could be partially attributed to the increased adoption of
conservation-tillage (Renwick et al., 2008). A simulated rainfall study in Arkansas indicated that
NT reduced soil erosion and runoff water significantly compared to CT (Harper, 2006). Carbon
sequestration and reduced carbon dioxide emissions are also social benefits gained from NT.
Using a global database, West and Post (2002) concluded that converting from CT to NT
sequestered on average 57g C m-2 yr-1 and intensive rotations could sequester and additional 20g
C m-2 yr-1. The study also concluded carbon sequestration would reach a new equilibrium
between 5 and 10 years while soil organic carbon would reach equilibrium in 15 to 20 years.
Rice is Arkansas’ highest valued crop and accounts for nearly half of US total production
(USDA). Rice is typically rotated with soybeans although some acres are continuous rice or
rotated with other crops such as corn, sorghum, cotton, and wheat. In 2002, NT rice production
in Arkansas was estimated at 9% (Wilson and Branson, 2002) and increased to 16% by 2008
(Wilson and Runsick, 2008). No-till has been shown to reduce labor, fuel, and machinery costs
(Epplin et al. 1982 and Krause and Black 1995). Some of these costs savings may be offset by
increased herbicide use and lower crop yields. Reductions of these costs should favor the use of
NT cropping systems in Arkansas but adoption has lagged the national adoption rate. The lack
of adoption may be attributed to potential management issues, fear that grain yields will be
significantly less than CT, and limited profit and risk information.
The economics of NT have been investigated throughout the US estimating the mean
income for corn and wheat (Burton et al. 2009; Archer et al. 2008; and Al-Kaisi 2004). The
studies concluded NT could be an economically viable option for replacing CT. Other studies
have investigated the input costs structure and concluded that as fuel becomes more expensive
relative to glyphosate the economic benefits of NT increase versus CT (William et al. 2009 and
Nail et al. 2007).
Other studies have explored the risk of NT systems compared to CT cropping systems.
Archer and Reicosky (2009) determined that risk neutral and risk-adverse corn and soybean
producers in the northern Corn Belt would prefer NT to CT. Riberia et al. (2004) examined
tillage and five cropping systems in Texas and found that risk-adverse producers would prefer
NT in all five cropping systems while risk-neutral producers would prefer NT in four of the five
systems.
Partial budget economic studies of flooded or intermittently flooded conditions have been
mixed. Pearce et al. (1999) found NT rice to be unprofitable relative to CT on soils with high
salinity. Smith and Baltazar (1992) found NT rice to be more profitable on the Arkansas Grand
Prairie. Watkins et al. (2004) found NT rice/soybean rotation to be less profitable although
Watkins et al. (2008) found that risk-neutral and risk-adverse tenants would favor NT over CT.
One major shortcoming of the rice studies mentioned is that the data sets used were very
small. Using a small data set may not represent a clear picture of NT and has resulted in studies
concluding different economic results. Another shortfall of some of the studies mentioned is that
economic risk is addressed only from the price received perspective. Producers also face input
price risk which is typically considered deterministic in simulation analysis. Other studies
exclude risk in general and present results solely from a risk-neutral perspective.
The objective of this study is to compare the profitability and risk of NT and CT rice
based cropping systems continuously grown or rotated with soybeans, corn, and/or wheat on
Arkansas Grand Prairie silt loam soils. The yield data encompasses ten years of test plot
experiments from 2000-2009. The paper will examine differences in production costs, crop
yields, and economic risk facing Arkansas producers on the Grand Prairie.
Data and Methods
Stochastic Model. Distributions for net returns to tillage and cropping systems were
empirically estimated using a stochastic model. The simulation model is represented by the
following equation:
Where
is stochastic yield of crop j in rotation i
is the stochastic price for crop j
is the percent crop j represents in rotation i
is the per-yield drying cost and checkoff fee of crop j
is the per-yield hauling costs of crop j
is the stochastic costs of glyphosate, fuel, and fertilizer for crop j in rotation i
is the per acre deterministic production costs of crop j in rotation i
The stochastic model contains land costs and is assumed to be 25% of the gross revenues.
This crop share rental arrangement is common in Arkansas especially on rice ground (Bierlen
and Parsch, 1996). Typically under this crop share arrangement, drying cost is shared at the
same proportion of the crop share. Irrigation is typically paid by the tenant who must also
provide a power unit for pumping. The landlord typically provides the well, pump, and
gearhead.
Crop prices received, fuel, fertilizer, glyphosate, and yields are the stochastic variables in
the model. Multivariate empirical (MVE) distributions of the variables were estimated and
simulated using the Excel add-in Simetar (Richardson et al., 2008). The MVE distribution
creates a distribution of the deviations expressed as a fraction from the mean or trend and
simulates the random value based upon the frequency distribution of the actual data. A MVE
distribution has been shown to appropriately correlate random variables based upon their
historical correlation (Richardson et al., 2000).
Direct and Fixed Expenses. Direct and fixed expenses for crops and tillage were
calculated by taking the average of the past three years (2007-2009) using the Mississippi State
Budget Generator (Laughlin and Spurlock, 2006). Input quantities used came from the longterm tillage and cropping system study being conducted at the University of Arkansas’ Rice
Research and Extension Center in Stuttgart, AR. The budgeted production costs are presented in
Table 1. Direct expenses include fertilizers, herbicides, irrigation supplies, crop seed, adjuvant,
custom hire, labor, fuel, repairs, maintenance, and interest on operating capital. Other costs not
included are on a per unit basis. Drying cost is estimated at $0.33 and $0.19/bu for rice and corn,
respectively. Soybeans and wheat usually do not need drying and their costs are assumed zero
for this analysis. The Arkansas checkoff fee for rice is $0.0135/bu and $0.01/bu of corn, wheat,
and soybeans. Hauling cost for all crops is assumed to be $0.20/bu. Fixed expenses are
calculated per acre and estimated using the capital replacement method and include tractors,
harvesters, irrigation machinery, and implements.
Prices. Crop prices received and key production input prices from the previous ten years
were used to create a MVE. Crop prices received are the season average for Arkansas and the
key inputs are the national seasonal average (USDA National Agricultural Statistical Service).
Prices were detrended using linear regression. The residuals from the regression were used to
calculate the historical correlation between price variables, and each variable’s frequency
distribution of residuals was used to simulate risk in prices around the previous three year mean.
Using the mean of the previous three years can be considered the price expectation Arkansas
producers’ will receive for their crops and pay for key productions inputs. Summary statistics of
simulated Arkansas crop prices, fertilizer, diesel fuel, and glyphosate prices are presented in
Table 2.
Yields. Summary statistics of simulated yields by tillage and crop rotation are presented
in Table 3. Yields were detrended using linear regression and the residuals were used to
simulate risk in yields around the mean. The mean crop yield used for the analysis was
calculated from the 10 years of data. Wheat in some years had no yield due to planting failure.
Those years are used in the MVE distribution and represent the risk producers may face under
some rotations.
Continuous Rice (R), Rice-Soybean (RS), Rice-Corn (RC), Rice-Wheat (RW), and RiceWheat-Soybean-Wheat (RWSW) long term rotation studies managed under both NT and CT
were conducted at the University of Arkansas Rice Research and Extension Center in Stuttgart,
AR. The plot location was cut to a slope of 0.15% in February of 1999, and each plot measures
250-ft x 40-ft in a north-south direction. These plots were then divided in half ease-west with
each side randomized as conventional or no-till treatments. Each tillage treatment was then split
into two fertility treatments. During the study there has been no significant difference in yields
by fertility treatment. For the purpose of this study the fertility treatment yield data were
combined.
Plant residues were left on the no-till plots while conventional-till plots were burnt
following harvest. Phosphorus and potassium fertilizers were applied prior to planting with both
fertilizers incorporated with tillage in the conventional-till plots and left on the soil surface in the
no-till plots. Herbicide use for weed control was generally the same from year to year between
tillage and crop but all no-till plots with the exception of the rice/wheat plots had an early
glyphosate application for weed control instead of tillage.
Risk Analysis. Simulated probability distributions of net returns for each tillage method
and rotation are ranked according to risk attitudes using stochastic efficiency with respect to a
function (SERF). The SERF method uses certainty equivalents (CE) for a specific range of risk
aversion levels. A CE can be defined as the value of a certain payoff a decision maker would
require for the chance of a higher payoff but an uncertain amount.
The SERF method compares each alternative investment, or in this case tillage and
cropping system, simultaneously unlike stochastic dominance with respect to a function
(Hardaker et al. 2004). The SERF method in Simetar uses a negative exponential utility function
to estimate the CE values at each absolute risk aversion coefficient (ARAC). The ARAC
formula proposed by Hardaker et al. (2004) is used to calculate a decision maker’s degree of risk
aversion. As in Riberia et al. (2004) this analysis presents a range of ARACs to demonstrate the
rankings for a range of decision makers. Additionally, the NT risk premiums are calculated for
each rotation by subtracting the CT CE value from the NT CE value at the specific ARAC value.
Given the CE values, risk premiums can be calculated across alternative cropping systems and
between tillage practices.
Results
Net Returns. Summary statistics of simulated net returns by tillage and cropping system
along with probabilities of negative net returns generated are presented in Table 4. Both the
continuous R-NT and R-CT system has about a 43% chance of generating a negative return. The
minimum, mean, and maximum returns per acre for R-NT are -$226, $62, and $661, respectively
while R-CT results are -$220, $59, and $591, respectively. Mean net returns and variability are
very similar by tillage for the continuous R cropping system. The RS-NT has about a 12%
chance of obtaining negative net returns. The minimum, mean, and maximum per acre for RSNT are -$104, $110, and $494, respectively. The RS-CT probability of generating negative net
returns is 23% which is almost double that of NT. The minimum, mean, and maximum per acre
for RS-CT are -$182, $83, and $452, respectively.
The RC-NT cropping system has about an 87% chance of generating negative net returns
while the RC-NT has about an 80% chance. The RC-NT minimum, mean, and maximum per
acre net returns are -$348, -$109, and $230, respectively. The RC-CT minimum, mean, and
maximum per acre net returns are -$364, -$89, and $241, respectively. The RW-NT cropping
system has about a 77% chance of generating negative net returns. The minimum, mean, and
maximum per acre net returns are -$315, -$56, and $265, respectively. The RW-CT cropping
system has an 83% chance of obtaining negative net returns while the minimum, mean, and
maximum net returns per acre are -$295, -$70, and $223, respectively. The RWSW-NT
cropping system has about a 73% chance of generating negative net returns while the RWSWCT exhibits an 83% chance. The minimum, mean, and maximum net returns per acre for
RWSW-NT are -$456, -$60, and $320, respectively. The RWSW-CT minimum, mean, and
maximum net returns per acre are -$533, -$120, and $235, respectively.
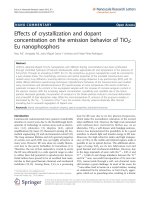
Certainty Equivalents and Risk Premium to No-till. Certainty equivalents (CE) and NT
risk premiums are presented by cropping system for a range of ARACs in Table 5 and are used
to predict preferences of NT versus CT by cropping system in Figure 1. Certainty equivalents
are equal to the mean (risk neutral) when the ARACs=0. Positive ARACs represent risk
aversion, and risk aversion increases as ARACs become more positive. Alternatively, negative
ARACs represent risk seeking behavior, and risk seeking behavior grows as ARACs become
more negative. ARACs values from -0.15 to 0.15 are used to give a range of how the cropping
systems and tillage practice would be ranked across risk aversion levels.
The CEs for the continuous R cropping system indicate that NT would be preferred by
risk neutral and risk seeking producers. NT has a positive risk premium over CT of $3 to
$70/acre as risk preference increases from risk neutral to risk seeking (ARACs = -0.15 to 0) but
CT has a premium over NT of $6/acre as risk aversion increases meaning that risk averse
producers would have to be paid $6/acre to adopt NT. The CEs for the RS cropping system
indicate that NT would be preferred over CT across all risk attitudes. NT premiums over CT
ranged from $27/acre (risk neutral) to $73/acre (highly risk adverse).
Producers in a RC cropping system would prefer CT if they are risk neutral or risk
seeking. NT would be preferred as risk aversion increased. NT risk premiums over CT are
$12/acre for risk adverse producers while CT has a premium over NT of $10/acre for risk
seeking and $20/acre for risk neutral producers. The CEs for a RW cropping system are larger
for NT if a producer is risk neutral or risk seeking. This is the exact opposite of the RC cropping
system but the preferences are similar to the continuous R cropping system. NT risk premiums
over CT are $15 to $41/acre for risk neutral and risk seeking, respectively. CT has a risk
premium over NT of $17/acre as risk aversion increases. The CEs in the RWSW cropping
system indicate that NT would be preferred over CT across all risk attitudes. NT premiums over
CT ranged from $60/acre (risk neutral) to $93/acre (risk adverse).
The CEs for net returns are used in Figure 2 across ARACs to compare all five cropping
systems for both NT and CT. Under NT, risk neutral producers would prefer the RS cropping
system over the continuous R system, the second preferred, followed by RW, RWSW, and RC
with risk premiums to RS over the other cropping systems per acre of $49, $166, $170, and
$219, respectively. In order for a risk neutral no-till producer to switch from the RS cropping
system, the premiums listed would have to be paid to the producer per acre to change to that
specific cropping system. Risk-averse producers under NT would prefer RS over continuous R
followed by RW, RC, and RWSW. The order of cropping systems slightly changed between risk
neutral and risk adverse. Risk neutral no-till producers would prefer RWSW over RC but risk
adverse producers would prefer RC over RWSW (Figure 2).
Under CT, risk neutral and risk adverse producers would prefer RS cropping system to
continuous R, followed by RW, RC, and RWSW. Risk premiums to RS per acre over the other
cropping systems for risk neutral conventional-till producers would be $24, $154, $172, and
$203, respectively. Risk premiums to RS per acre over the other cropping systems for risk
adverse conventional-till producers would be $37, $115, $181, and $350, respectively.
Summary and Conclusions
This analysis examined production costs, yields, profitability, and economic risk of NT
on Arkansas Grand Prairie silt loam soils using simulation and SERF. Labor, fuel, and
machinery costs were lower for NT than CT, but yields were usually lower on average in NT as
compared to CT. Few Arkansas rice producers practice NT due to management issues and
possibly little information about profitability and risk. The last objective of this study was to
evaluate profitability and risk of rice based cropping systems. This was achieved by simulating
crop and key input prices and yields. Net returns distributions were constructed for rice based
cropping systems under CT and NT.
Net income results based on the mean by tillage, the system with highest return or least
negative return, is continuous R-NT, RS-NT, RC-CT, RW-NT, and RWSW-NT. Risk premiums
for risk neutral producers who prefer NT to CT ranged from -$20 to $60/acre while risk
premiums for risk-averse producers ranged from -$17 to $77/acre. Negative values indicate that
a producer with a defined risk preference would have to be paid to adopt NT over CT.
The results indicate that under NT and CT producers who are risk neutral and risk
adverse would prefer the RS cropping systems over all other rotations followed by continuous R.
The RS-NT has the highest mean and lowest probability of generating a negative income. This
result explains why the majority of rice grown in Arkansas is rotated with soybeans and followed
secondly by rice grown continuously. The RC-NT has the lowest mean and greatest chance of
obtaining a negative income out of all the systems. The results also suggest that producers with a
risk neutral preference would prefer NT over CT in four of the five cropping systems (R, RS,
RW, RWSW) while a risk-averse producer would prefer NT over CT in three of the five
cropping systems (RS, RC, RWSW).
Limitations and shortcomings of this study should be mentioned to provide full disclosure
and assistance to interpreting the results. One limitation is that crops and rotations are
constrained by the results in test plots and could be different for actual farming conditions.
Another limitation is two fertility treatments were used in the test plots and combined for this
study. The quantity of fertilizer used for each crop and within the specific rotation may not be
economically optimal and therefore have an impact when comparing cropping systems. A third
limitation is that simulated prices are constrained to their historical correlations which may
change over time.
A shortcoming of this study is the focus solely on market returns. The study does not
account for social benefits or incentives to adopt NT, i.e. carbon credits and federal conservation
programs. Another shortcoming is the study focused on per acre returns and does not account
for whole-farm activities. Using a mathematical programming model with simulated prices and
yields could provide a detailed profit and risk analysis of crop rotations and tillage systems based
upon specific resource availability.
References
Al-Kaisi, M.M. and X. Yin. 2004. Stepwise Time Response of Corn Yield and Economic Return
to No-tillage. Soil and Tillage Research. 78:91-101.
Archer, D.W. and D.C. Reicosky. 2009. Economic Performance of Alternative Tillage Systems
in the Northern Corn Belt. Agronomy Journal. 101:296-304.
Archer, D.W., A.D. Halvorson, and C.A. Reule. 2008. Economics of Irrigated Continuous Corn
under Conventional-Till and No-Till in Northern Colorado. Agronomy Journal. 100:11661172.
Bierlen, R., and L.D. Parsch. 1996. Tenant Satisfaction with Land Leases. Review of
Agricultural Economics. 18(2):505-513.
Burton, R.O., Jr., R.P. Smith, and A.J. Schlegel. 2009. Economics of Reduced-Till, No-Till, and
Opportunity Cropping in Western Kansas. Journal of the ASFMRA. 72:164-176.
Epplin, F.M., T.F. Tice, A.E. Baquet, and S.J. Handke. 1982. Impacts of Reduced Tillage and
Operating Inputs and Machinery Requirements. American Journal of Agricultural
Economics. 64:1039-46.
Hardaker, J.B., J.W. Richardson, G. Lein, and K.D. Schumann. 2004. Stochastic Efficiency
Analysis with Risk Aversion Bounds: A Simplified Approach. The Australian Journal of
Agricultural and Resource Economics. 48(2):253-270.
Harper, T.W. 2006. Conservation-tillage effects on runoff water quality and soil physical
properties in the Arkansas Delta. M.S. Thesis. University of Arkansas, Fayetteville, AR.
Krause, M.A. and J.R. Black. 1995. Optimal Adoption Strategies for No-Till Technology in
Michigan. Review of Agricultural Economics. 17:299-310.
Nail, E.L., D.L. Young, and W.F. Schillinger. 2007. Diesel and glyphosate price changes benefit
the economics of conservation-tillage versus traditional tillage. Soil and Tillage Research.
94:321-327.
Pearce, A.D., C.R. Dillon, T.C. Keisling, and C.E. Wilson. 1999. Economic and agronomic
effects of four tillage practices on rice produced on saline soils. Journal of Production
Agriculture. 12(2):305-312.
Peterson, D. 2005. U.S. tillage trends. Land and water, conserving natural resources in Illinois.
Univ. of Illinois Extension. No. 6. Urbana, IL.
Rachman, A., S.H. Anderswon, C.J. Gantzer, and A.L. Thompson. 2003. Influence of long-term
cropping systems on soil physical properties related to soil erodibility. Soil Sci. Soc. Am. J.
67:637-644.
Renwick, W.H., M.J. Vanni, Q. Zhang, and J. Patton. 2008. Water Quality Trends and Changing
Agricultural Practices in a Midwest U.S. Watershed, 1994–2006. Journal of Environmental
Quality. 37:1862-1874.
Riberia, L.A., F.M. Hons, and J.W. Richardson. 2004. An Economic Comparison between
Conventional and No-Tillage Farming Systems in Burleson County, Texas. Agronomy
Journal. 96:415-424.
Richardson, J.W, K.D. Schumann, and P.A. Feldman. 2008. SIMETAR: Simulation and
Econometrics To Analyze Risk. Simetar, Inc. College Station, TX.
Richardson, J.W., S.L. Klose, and A.W. Gray. 2000. An Applied Procedure for Estimating and
Simulating Multivariate Empirical (MVE) Probability Distributions in Farm-level Risk
Assessment and Policy Analysis. Journal of Agricultural and Applied Economics. 32(2):299315.
Smith, R.J., Jr., and A.M. Baltazar. 1992. Reduced and no-tillage systems for rice and soybeans.
B.R. Wells Rice Research Studies. AAES Research Series 422:104-107.
Watkins, K.B., J.L. Hill, and M.M. Anders. 2008. An Economic Risk Analysis of No-Till
Management and Rental Arrangements in Arkansas Rice Production. Journal of Soil and
Water Conservation. 63(4):242-250.
Watkins, K.B., M.M. Anders, and T.E. Windham. 2004. An Economic Comparison of
Alternative Rice Production Systems in Arkansas. Journal of Sustainable Agriculture.
24(4):57-78.
West, T.O. and W.M. Post. 2002. Soil Organic Carbon Sequestration Rates by Tillage and Crop
Rotation: A Global Data Analysis. Soil Sci. Soc. Am. J. 66:1930–1946 (2002).
Williams, J.R., D.L. Pendell, R.V. Llewelyn, D.E. Peterson, and R.G. Nelson. 2009. Returns to
Tillage Systems under Changing Input and Output Market Conditions. Journal of the
ASFMRA. 72:78-93.
Wilson, C.W. and J.W. Branson. 2002. Trends in Arkansas Rice Production. B.R. Wells Rice
Research Studies. AAES Research Series 504:15-20.
Wilson, C.E. and S.K. Runsick. 2008. Trends in Arkansas Rice Production. B.R. Wells Rice
Research Studies. AAES Research Series 571:13-23.
USDA National Agricultural Statistical Service. 2008. Quick Stats U.S. and All States Data.
Access at: www.nass.usda.gov
Table 1. Budgets for no-till (NT) and conventional-till (CT) by crop.
Late
Early
Late
Early
Rice
Rice
Soybeans Soybeans Wheat
Corn
NT CT NT CT NT CT NT CT NT CT NT CT
-------------------------------$/acre-------------------------------Fertilizers
114 114 114 114 200 200 51 51 51 51 96 96
Fungicides
0
0
0
0
0
0
0
0
0
0
2
2
Herbicides
81 77 94 90 60 48 21 16 18 11 27 27
Insecticides
1
1
5
5
0
0
0
0
0
0
0
0
Irrigation Supplies
8
8
8
8
7
7
8
8
8
8
0
0
Crop Seed
59 59 22 22 72 72 43 43 43 43 18 18
Adjuvants
4
4
7
7
4
4
3
2
2
2
0
0
Custom Hire
42 42 46 46 46 40 24 16 22 17 30 30
Labor
13 18 13 18
6 11
6 12
6 12
4
9
Diesel Fuel
104 119 114 126 50 63 42 55 42 55
9 22
Repair/Maintenance 17 21 18 22 11 16 10 14 10 14
6
9
Interest
13 14 11 11 14 14
6
6
5
6
6
7
Direct Costs
Fixed Costs
456 476 453 471 469 474 216 224 209 218 198 220
74 92 74 92 50 71 52 71 52 71 22 41
Total Costs
530 569 528 563 519 545 268 294 261 288 220 261
Table 2. Summary statistics for simulated crop and key input prices.
Unit
Mean
Standard
Deviation
$/bu
$/bu
$/bu
$/bu
6.09
9.35
3.79
4.97
1.41
1.14
0.44
0.56
23.22
12.19
11.54
11.22
4.39
7.80
2.87
4.24
9.84
11.14
4.37
6.21
Input Prices
Potash
$/lb
Phosphate
$/lb
Urea
$/lb
Diesel
$/gal
Glyphosate
$/pt
0.38
0.33
0.25
2.59
4.69
0.32
0.11
0.04
0.61
0.61
83.4
32.7
15.5
23.5
13.0
0.17
0.22
0.19
1.61
3.64
1.30
0.57
0.33
3.74
5.83
Crop Prices
LG Rice
Soybeans
Corn
Wheat
1
CV
Minimum Maximum
1
Crop prices are Arkansas simulated prices.
Table 3. Summary statistics for simulated yields by cropping system and tillage
practice.
Cropping
System
Crop
Mean
Tillage
Standard
Deviation
CV
Minimum Maximum
-----------------------bu/acre----------------------Rice
Rice
Rice
NT
CT
151
160
15
11
10
7
130
146
182
182
Rice
Rice
Soybean
Soybean
NT
CT
NT
CT
179
183
50
49
13
13
8
14
7
7
16
29
165
162
38
17
209
198
64
72
Rice
Rice
Corn
Corn
NT
CT
NT
CT
175
182
81
111
11
14
29
30
7
8
35
27
157
159
38
77
201
208
135
187
Rice
Rice
Wheat
Wheat
NT
CT
NT
CT
111
124
22
32
32
24
23
26
29
19
102
81
64
72
0
0
164
158
64
64
NT
CT
125
122
30
29
24
24
68
47
175
154
1
NT
25
21
84
0
55
1
Wheat
Soybean
Soybean
CT
NT
CT
32
37
32
26
13
13
80
35
40
0
15
8
63
56
52
Wheat2
NT
34
28
83
0
67
CT
37
30
81
0
68
Rice-Soybean
Rice-Corn
Rice-Wheat
Rice-WheatSoybean-Wheat Rice
Rice
Wheat
2
Wheat
1
Wheat planted after rice in the rotation.
2
Wheat planted after soybeans in the rotation.
Table 4. Summary statistics of simulated net returns by cropping system and tillage
practice.
Rotation
Rice
Rice-Soybean
Rice-Corn
Rice-Wheat
Rice-WheatSoybean-Wheat
Prob. of
negative
Tillage returns
NT
CT
NT
CT
NT
CT
NT
CT
NT
CT
0.43
0.43
0.12
0.23
0.87
0.80
0.77
0.83
0.73
0.83
Standard
Deviation
Mean
CV
Minimum Maximum
---------------------------$/acre--------------------------62
158
256
-226
661
59
151
255
-220
591
110
104
94
-104
494
83
111
133
-182
452
-109
97
-89
-348
230
-89
104
-117
-364
241
-56
91
-164
-315
265
-70
82
-116
-295
223
-60
125
-209
-456
320
-120
128
-106
-533
235
Table 5. Cropping systems and tillage certainty equivalents and no-till risk
premium by various absolute risk aversion coefficients.
Rotation
Rice
Rice-Soybean
Rice-Corn
Rice-Wheat
Rice-Wheat-Soybean-Wheat
Rice
Rice-Soybean
Rice-Corn
Rice-Wheat
Rice-Wheat-Soybean-Wheat
Tillage
NT
CT
NT
CT
NT
CT
NT
CT
NT
CT
Absolute risk ave rsion coefficients
-0.15 -0.075
0 0.075
0.15
Certainty equivalents ($/acre)
619
580
62
-145
-185
550
511
59
-139
-178
453
412
110
-42
-69
411
371
83
-106
-142
190
153
-109
-279
-312
200
162
-89
-285
-323
223
184
-56
-234
-274
182
144
-70
-224
-257
282
249
-60
-374
-415
194
157
-120
-454
-492
No-till risk premiums ($/acre)
70
69
3
-6
-6
42
41
27
65
73
-10
-9
-20
6
12
41
40
15
-10
-17
88
93
60
80
77
Note: Positive risk premium is benefit to NT while negative value is benefit to CT.
1A: Continuous Rice Rotation (R)
1B: Rice-Soybean Rotation (RS)
$700
$500
$600
$400
$500
$300
$400
$300
$200
$200
$100
$100
$0
$0
-0.15
-0.1
-0.05
-$100
-0.15
0
0.05
-$200
ARAC
R-NT
0.1
-0.1
-0.05
0.15
0
0.05
0.1
0.15
-$100
-$200
ARAC
RS-NT
R-CT
1C: Rice-Corn Rotation (RC)
RS-CT
1D: Rice-Wheat Rotation (RW)
$300
$300
$200
$200
$100
$100
$0
-0.15
-0.1
-0.05
0
0.05
0.1
$0
0.15
-$100
-0.15
-0.1
-0.05
0
0.05
0.1
-$100
-$200
-$200
-$300
-$400
ARAC
RC-NT
-$300
ARAC
RW-NT
RW-CT
RC-CT
1E: Rice-Wheat-Soybean-Wheat Rotation (RWSW)
$300
$200
$100
$0
-0.15
-0.1
-0.05
0
0.05
0.1
0.15
-$100
-$200
-$300
-$400
-$500
ARAC
RWSW-NT
RWSW-CT
Figure 1. Certainty equivalents for net returns of no-till (NT) and conventional-till (CT)
cropping systems on the Arkansas Grand Prairie.
0.15
2A: No-tillage systems
$700
$500
$300
$100
-0.15
-0.1
-0.05
-$100
0
0.1
0.05
0.15
-$300
R-NT
RS-NT
-$500
ARAC
RC-NT
RW-NT
RWSW-NT
2B: Conventional-tillage systems
$600
$400
$200
$0
-0.15
-0.1
-0.05
0
0.05
0.1
0.15
-$200
-$400
R-CT
RS-CT
-$600
ARAC
RC-CT
RW-CT
RWSW-CT
Figure 2. Certainty equivalents for net returns of no-till (NT) and conventional-till (CT)
systems for five rotations on the Arkansas Grand Prairie. R, continuous rice; RS, ricesoybean; RC, rice-corn; RW, rice-wheat; RWSW, rice-wheat-soybean-wheat.