a-hedonic-analysis-of-the-impact-of-marine-aquaculture-on-coastal-housing-prices-in-maine
Bạn đang xem bản rút gọn của tài liệu. Xem và tải ngay bản đầy đủ của tài liệu tại đây (348.99 KB, 26 trang )
Downloaded from IP address: 171.225.146.107, on 25 Jan 2022 at 19:10:16, subject to the Cambridge Core terms of use, available at /> />
A Hedonic Analysis of the Impact of
Marine Aquaculture on Coastal
Housing Prices in Maine
Keith S. Evans, Xuan Chen, and Christina A. Robichaud
Converting coastal waters to farmed production of seafood may generate conflicts
with other resource users. This study explores the impact of marine aquaculture
development on coastal homeowners. Using single-family home sales from 2012–
2014 and spatial data on coastal aquaculture activity, we employ hedonics to
assess the impacts of mariculture development in three study areas of Maine,
USA. Our results suggest modest impacts on residential property values with
significant spatial variation across study areas. This spatial variation represents a
challenge for managers and highlights the potential benefits from coordinating
the development of aquaculture to balance resource users’ objectives with
industry growth.
Key Words: coastal waters, hedonic pricing model, marine aquaculture,
mariculture, property values
Aquaculture is an important source of fish protein. While wild-capture
production has flat-lined since the mid-1980s, due to excessive fishing
pressure and changing ocean conditions, world production from aquaculture
has grown exponentially to meet market demand (World Bank 2013, Food
and Agriculture Organization of the United Nations (FAO) 2016). Although
China has represented the majority of this growth, generating more than 60
percent of production by volume (FAO 2016), early research suggests that a
wide-range of marine production opportunities exist for the United States
(Knapp 2008, Valderrama and Anderson 2008, Kite-Powell, Rubino, and
Keith Evans is an Assistant Professor in the School of Economics and School of Marine Sciences,
University of Maine, Orono, ME 04469. Xuan Chen is an Assistant Professor in the School of
Economics, University of Maine, Orono, ME 04469. Christina Robichaud is a graduate student in
the School of Economics, University of Maine, Orono, ME 04469. Correspondence: Keith S. Evans
▪ School of Economics ▪ 5782 Winslow Hall, Room 206 ▪ Orono, ME 04469 ▪ Phone 207.581.3178 ▪
email:
The authors thank Maine Multiple Listings Service for providing access to the sales transactions
data. We would also like to thank the participants at the 2016 NAREA workshop and two
anonymous reviewers for helpful suggestions. This project was supported by the National
Science Foundation under EPSCoR award #IIA-1355457 and the USDA National Institute of
Food and Agriculture under Hatch projects #ME021603 and #ME021704.
The views expressed are the authors’ and do not necessarily represent the policies or views of
any sponsoring agencies.
Agricultural and Resource Economics Review 46/2 (August 2017) 242–267
© The Author(s) 2017. This is an Open Access article, distributed under the terms of the Creative
Commons Attribution licence ( which permits
unrestricted re-use, distribution, and reproduction in any medium, provided the original work is
properly cited.
Downloaded from IP address: 171.225.146.107, on 25 Jan 2022 at 19:10:16, subject to the Cambridge Core terms of use, available at /> />
Evans et al.
A Hedonic Analysis of the Impact of Marine Aquaculture 243
Morehead 2013). Recent work by Kapetsky, Aguilar-Manjarrez, and Jenness
(2013) ranks the United States as one of the top countries with potential for
profitable expansion of marine aquaculture, known as mariculture. Beyond
profit opportunities, increasing aquaculture production in the United States
can help reduce the U.S. seafood trade deficit, which has grown to over $14.5
billion annually (National Oceanic and Atmospheric Administration (NOAA)
2015), and create healthier oceans by reducing fishing pressure on wildstocks, providing habitat, and species restoration (Knapp and Rubino 2016,
NOAA 2016a).1 These opportunities have not been lost on U.S. policy makers.
In 2016, NOAA released its strategic plan for offshore aquaculture, calling for
a 50 percent increase in production by volume in the United States by 2020
(NOAA 2016b). Even at state and local levels, there has been interest in
increasing aquaculture production and coastal development: promoting working
waterfronts, providing alternate local marine employment opportunities, and
diversifying against uncertainty for struggling wild-capture fisheries and
resource-dependent coastal communities (Governor’s Task Force on the
Planning and Development of Marine Aquaculture in Maine 2004, Lapointe
2013, Knapp and Rubino 2016, Sustainable Ecological Aquaculture Network
2016). Together, this suggests a broad interest among policy makers for the
large-scale, nonmarginal development of marine aquaculture in the United States.
Despite interest in expanding coastal aquaculture among U.S. policy makers,
Knapp and Rubino (2016) and Knapp (2012) highlight challenges facing its
development. Marine aquaculture generates interactions with other coastal
and marine resource users. Converting public waters to the farmed
production of seafood alters the mixture of goods and services that coastal
ecosystems provide, thereby generating a new distribution of winners and
losers among resource users. The dual nature of externalities related to
mariculture further complicates coastal development and siting decisions
(Bhat and Bhatta 2004, Primavera 2006, Whitmarsh and Palmieri 2008);
externalities are generated by coastal activity and users (on aquaculture) and
from the production of aquaculture itself (on coastal activity and users).
Knapp and Rubino (2016) note that some users in this system, e.g., riparian
homeowners, recreationists, and commercial fishermen, may fear that the
potential negative impacts of marine aquaculture may not be offset by
private benefits. Bricknell and Langston (2013) suggest that researchers and
the aquaculture industry have failed to effectively communicate the positive
benefits of aquaculture. These tensions or perceptions of risk may emerge at
public lease hearings and through interactions in coastal real-estate markets;
property values may be influenced by proximity to aquaculture as it alters
viewscape and/or generates smell and noise.
Of course, some of these benefits may be mitigated by substitution of fishing pressure onto
prey species for carnivorous farmed-fish (e.g., salmon).
1
Downloaded from IP address: 171.225.146.107, on 25 Jan 2022 at 19:10:16, subject to the Cambridge Core terms of use, available at /> />
244 August 2017
Agricultural and Resource Economics Review
Addressing these challenges is a priority for policy makers and researchers.
Goal 4 of NOAA’s strategic plan aims to increase/improve public
understanding of marine aquaculture production to reduce barriers to its
development (Knapp and Rubino 2016, NOAA 2016b). Stakeholders,
especially those interested in the resiliency of coastal communities, are
interested in the potential risks and benefits of mariculture, evaluated
through the lenses of multiple disciplines (NOAA 2016b). A better
understanding of the impact of developing coastal mariculture on riparian
homeowners and other resource users is important for managers interested
in promoting the long-run health of this emerging industry.
Work to date has focused on describing coastal residents’ perceptions of
marine aquaculture (Mazur and Curtis 2008, Schlag 2010, McGinnis and
Collins 2013, D’Anna and Murray 2015). Shafer, Inglis, and Martin (2010)
explore these perceptions surrounding proposed marine farms on the Banks
Peninsula, New Zealand. Their results suggest that proximity of marine
development to residents is an important factor influencing acceptance.
Residents living closer to the proposed marine farms were more sensitive to
marine development and less accepting of them, despite acknowledging the
potential economic benefits to the local community. This is consistent with
the idea that marine aquaculture may be considered a locally undesirable
marine use. Efforts to quantify the impacts of mariculture and marine
development are limited (Jodice et al. 2015). Two examples related to
aquaculture are worth noting: first, an unpublished dissertation by
Sudhakaran (2015), which finds minimal impacts of shellfish aquaculture on
coastal property values in Rhode Island, USA; second, a technical
memorandum from Northern Economics (2010), which outlines a method for
a hedonic analysis of the impact of commercial shellfish operations in Puget
Sound, Washington, USA. However, as far as the authors can tell, the
empirical analysis was never published; nor has any other hedonic analysis of
mariculture.2
In this paper, we use a semiflexible form hedonic pricing model to quantify
the impacts of coastal mariculture development on residential property
values in Maine; we use three coastal regions along Maine’s coastline as our
study setting. We incorporate spatial information surrounding marine
aquaculture to explore two main research questions: (i) does marine
2
In the related industry of agriculture, economists have used the hedonic pricing model to
explore the impacts of agriculture production on nearby residential properties (Abeles-Allison
and Connor 1990, Palmquist, Roka, and Vukina 1997, Herriges, Secchi, and Babcock 2005, Kim
and Goldsmith 2009). This body of work suggests that the impact of agriculture on residential
properties may be complex, depending on more than proximity. For example, Ready and
Abdalla (2005) find potentially offsetting positive/negative impacts of farming activity near
residential property values; living near livestock farms may reduce residential property values,
while the open spaces associated with these farms may have the opposite effect. Le Goffe
(2000) and others find similar results.
Downloaded from IP address: 171.225.146.107, on 25 Jan 2022 at 19:10:16, subject to the Cambridge Core terms of use, available at /> />
Evans et al.
A Hedonic Analysis of the Impact of Marine Aquaculture 245
aquaculture capitalize into residential property values, and, if so, (ii) how does
this vary based on the spatial arrangement of leases (e.g., density of leases,
acreage of leases, proximity to residential properties). To this end we collect
transactions data (i.e., structural and neighborhood characteristics) for singlefamily homes sold in Maine from 2012–2014. These data are combined with
historical, spatial information on aquaculture production and leases issued in
Maine between 1981 and 2014, and localized information on attitudes
toward coastal development of aquaculture contained in transcripts from
public aquaculture lease hearings.
Our results suggest wide variation in how marine development of
aquaculture impacts property values, and therefore implicitly reveals insights
into local residents’ perceptions of marine aquaculture – as a coastal amenity
or disamenity. This spatial variation presents interesting challenges for
coastal resource managers, especially those at state and federal levels. It also
highlights the potential benefits from coordinating aquaculture site choices
designed to balance the competing objectives of diverse groups of coastal
resource users. This information is especially relevant when considering
future development of aquaculture in these shared waters. Resource planners
must evaluate whether smaller farms or large-scale industrial farms are more
appropriate for the cultural and ecological capacity of the coastal waters. To
answer such questions, the information on preferences from multiple groups
of users is critically important. Results of our hedonic pricing model help fill
knowledge gaps for these managers, providing information on preferences of
one group of users (coastal residents) surrounding aquaculture development
in coastal waters.
Background
Maine is one of the top marine producers of aquaculture in the United States,
with a farm-gate value in excess of $100 million (Maine Aquaculture
Association (MAA) 2015). With more than 5,000 miles of coastline, marine
farms in Maine produce an impressive variety of species, such as salmon, cod,
oysters, scallops, and sea vegetables (e.g., dulse and sugar kelp), using leases
on only 0.03 percent of the state’s public waters (MAA 2015, Maine
Department of Marine Resources (DMR) 2016). Management of aquaculture
in these coastal waters is divided between two state agencies: the Maine
DMR and the Maine Department of Environmental Protection (DEP). While
the Maine DEP is charged with ensuring that marine farms satisfy the
discharge standards specified under the Clean Water Act, the Maine DMR is
responsible for issuing aquaculture leases (East Coast Environmental Law
2014), and indirectly monitoring the development of marine aquaculture in
the state.
Much of the coastal development in Maine has occurred over the last 30 years,
as regulations streamlined the licensing process and lessened challenges
involved with monitoring water quality. Prior to 1973, marine farmers in
Downloaded from IP address: 171.225.146.107, on 25 Jan 2022 at 19:10:16, subject to the Cambridge Core terms of use, available at /> />
246 August 2017
Agricultural and Resource Economics Review
Maine were not guaranteed legal protection for their product (Maine DMR
2012). In 1983, Maine implemented Maine Revised Statutes Annotated
(MRSA) 12, Chapter 2, which defined the aquaculture lease regulations that
are in effect today, specifying the rights and legal protections of lease holders
(MRSA 2013). Under the current aquaculture leasing system, there are two
types of aquaculture leases and one type of license that provide an
aquaculturist with rights to grow in the state’s public waters: a standard
lease, an experimental lease, and a limited-purpose aquaculture (LPA)
license. Each type of lease/license specifies slightly different rights to its
holder. These rights specify which marine species can be grown, the duration
and renewability of the lease/license, etc. The major difference between
lease/license types in our analysis centers around the maximum acreage of
coastal waters that can be allocated to an individual for farming marine
species. Table 1 outlines some of the differences between lease and license
types.
The siting of marine farms in Maine is largely decentralized – affecting the
spatial pattern of coastal development. Unlike some U.S. states that use
marine aquaculture zones for siting leases in predefined growing areas (for
example, Aquaculture Enterprise Zones in Chesapeake Bay, Maryland, USA
(Maryland Natural Resource Code §4-11A-05 (2015)), in Maine, the initial
siting choice is made by the applicant. The final decision regarding issuing
this lease or license rests with the Maine DMR Commissioner. As part of the
application process, riparian landowners are notified if a proposed lease is
within 1,000 feet of their property (300 feet for LPAs), while the general
public is informed through public notices issued in the local newspaper and
the Maine DMR website. Proposed sites may draw considerable attention in
an area depending on its history with aquaculture (see Graves (2016) and
Table 1. Maine Aquaculture Lease and License Characteristics. Information
from Maine DMR (2012) and Maine Revised Statutes Annotated 12, Chapter 2
(2013).
Lease/
license type
Notice
distance
Scoping
session
Public
hearing
Size limit
Duration
Renewal
Standard
lease
1,000 feet
Yes
Yes
≤100 acres
10 years
Yes
Experimental
lease
1,000 feet
Maybe†
Maybe††
≤10 acres
1–3 years
No†††
Limited
purpose
license
300 feet
No
No
≤400 sq ft
Calendar
year
Yes
†
Scoping sessions are at the discretion of the Maine DMR.
Yes, if five or more comments are raised during the public comment period, or the Maine DMR requests
a hearing.
†††
Renewable if experimental lease is designated for research purposes.
††
Downloaded from IP address: 171.225.146.107, on 25 Jan 2022 at 19:10:16, subject to the Cambridge Core terms of use, available at /> />
Evans et al.
A Hedonic Analysis of the Impact of Marine Aquaculture 247
Mitterhoff (2016) for examples). Public comment periods and lease hearings
(town hall meetings) provide opportunities for other coastal users to give
testimony and raise concerns about the effects of siting aquaculture in their
community. Testimony at these meetings is restricted to the objective criteria
that the Maine DMR uses to evaluate a lease application; subjective issues
related to the lease (e.g., change in viewscape and effects on property values)
are beyond the scope of these criteria and generally do not effect the final
lease approval decision. Under the Maine DMR criteria, a lease may not
“unreasonably interfere” with riparian owners’ land access, navigation,
fishing or other uses, support of ecologically significant flora and fauna, or
public use or enjoyment within 1,000 feet of government managed or
conserved beaches, parks, docks, and land, and cannot have an “unreasonable
impact” due to noise or light (Maine DMR n.d.).
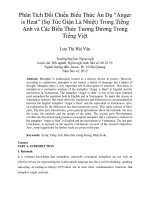
Our analysis focuses on the effects of marine aquaculture on the value of
single-family homes in three study areas along Maine’s coastline: Casco Bay,
the Damariscotta River region, and Penobscot Bay (Figure 1). Each study area
Figure 1. Casco Bay, Damariscotta River Region and Penobscot Bay. Inset
panel: Location of study areas along the Maine coastline. Greater panel: Housing
transactions of single-family homes sold between January 2012 and December
2014 (black triangles) and corresponding aquaculture leases (circled dots) in the
three study areas.
Downloaded from IP address: 171.225.146.107, on 25 Jan 2022 at 19:10:16, subject to the Cambridge Core terms of use, available at /> />
248 August 2017
Agricultural and Resource Economics Review
contains the municipalities designated as coastal by the Maine Coastal Program
(Maine Coastal Program 2013). These study areas provide useful focal points
and comparisons for our analysis. Their coastal waters vary in how they
provide important employment opportunities in wild-capture fisheries (e.g.,
lobster and soft-shell clams), whether or not they are popular areas for
recreation and tourism, and in the opportunities they provide for coastal
development of marine aquaculture.
There is considerable variation across these study areas with their connection
to their coastal waters. Penobscot Bay, located northeast of the other study
areas, is dominated by ecotourism and generates its wealth from the
“natural” environment. Alternatively, Casco Bay represents a heavily urban
region of Maine, containing two of the largest cities in the state, whose
waterfronts support shipping, recreation, and commercial fishing. Finally, the
Damariscotta River region, sandwiched between Casco Bay and Penobscot
Bay, has a long history of promoting development of marine aquaculture. It
contains almost 200 acres of coastal water designated for marine aquaculture
and produces more than 80 percent of the oysters grown in Maine
(Damariscotta River Association 2016). In addition to highlighting the
competing uses in these shared coastal waters, these study areas are data
rich, containing almost 200 lease sites (producing shellfish and sea
vegetables) and 8,500 transactions of single-family homes during 2012–2014.
Methods
Statistical Model
The hedonic pricing model, formalized by Griliches (1971) and Rosen (1974), is
a well-established method for eliciting nonmarket values for environmental
attributes connected with residential properties. This model posits that the
sales price for a home represents the equilibrium value for its bundle of
attributes. These attributes extend beyond the structural characteristics of
the property S (e.g., living space, bathrooms, and lot size), to also include
characteristics of the neighborhood in which the house is located N (e.g., local
school quality and crime rate) and localized environmental conditions Q (e.g.,
viewscape and air quality). Buyers and sellers compete across these
attributes generating the sales price for a home. The hedonic pricing function
describes this equilibrium relationship, mapping the attributes of home i in
neighborhood j at date t to its transaction price Pijt,
Pijt ¼ f (Si , Nij , Qi ) ỵ ijt
where ijt is a random error term. Variation in housing attributes and prices,
contained in observed transactions, can be used to recover information about
this unknown function.
Downloaded from IP address: 171.225.146.107, on 25 Jan 2022 at 19:10:16, subject to the Cambridge Core terms of use, available at /> />
Evans et al.
A Hedonic Analysis of the Impact of Marine Aquaculture 249
The implicit marginal price for an attribute, or marginal willingness-to-pay
(MWTP), can be recovered as the slope of f( · ). A positive (negative) value
suggests that homeowners perceive this attribute as an amenity (disamenity),
on the margin. This approach has been used in a variety of empirical settings
to recover the MWTP for environmental attributes, such as water quality
(Michael, Boyle, and Bouchard 2000, Gibbs et al. 2002, Poor, Pessagno, and
Paul 2007), dam removal (Lewis, Bohlen, and Wilson 2008, Bohlen and Lewis,
2009), and proximity to hydraulic fracturing well sites (Gopalakrishnan and
Klaiber 2014, Muehlenbachs, Spiller, and Timmins 2015). In this paper, we will
use this method to explore the effects of mariculture in coastal waters.
Because f( · ) has an unknown form, we employ a Box-Cox transformation on
sales price to incorporate flexibility in our selection of functional form (Box and
Cox 1964). Standard specifications, such as linear (λ ¼ 1), log-linear (λ ¼ 0), and
reciprocal (λ ¼ À1), are special cases of the Box-Cox specification and are tested
during the estimation process. Let P(λ) denote the Box-Cox transformed sales
price where
P(λ)
8
< Pλ À 1
if λ ≠ 0
¼
: λ
log P if λ ¼ 0:
We model the transformed sales price of home i in municipality j in year t as a
linear function of local conditions and an additive error term eijt ,
(1)
()
ẳ 0 ỵ 1 Si ỵ 2 Nij ỵ 3 Qi ỵ i ỵ j ỵ eijt
Pijt
where δj and δt are location (municipality) and sales-year fixed effects, and βm
captures the marginal influence of housing attribute m on the transformed
transaction price.
Data
Housing Transactions
Housing transaction data were obtained from Maine Multiple Listings Service
(MLS), a private company maintaining a near-complete database of real
estate information for realtors. These data span January 2012 through
December 2014 and contain a complete set of structural characteristics, sale
and location information for all single-family detached homes sold in Maine.
After removing transactions with missing information (i.e., sale or structural
characteristics), our sample consists of 5,698, 1,238 and 1,644 housing
transactions for the Casco Bay, Damariscotta River and Penobscot Bay
regions. Table 2 provides summary statistics for these attributes by study area.
Downloaded from IP address: 171.225.146.107, on 25 Jan 2022 at 19:10:16, subject to the Cambridge Core terms of use, available at /> />
250 August 2017
Agricultural and Resource Economics Review
Table 2. Sample Summary Statistics. Housing transactions data spans
January 2012 through December 2014 and contains all single-family detached
homes sold in Maine. Coastal aquaculture activity data includes all active leases
issued by the Maine DMR over the same study period.
Casco Bay
(N ¼ 5,698)
Home characteristics
Sales price ($1,000s)
Mean
Std. Dev.
327.84
288.32
Damariscotta
Penobscot Bay
(N ¼ 1,238)
(N ¼ 1,644)
Mean
Mean
292.13
Std. Dev.
283.92
273.19
Std. Dev.
318.04
Lot size (acres)
1.11
4.90
3.80
9.40
3.10
7.20
Living area (100s
square feet)
2.04
1.01
1.89
0.97
1.91
1.11
Bathrooms
1.73
0.84
1.70
0.91
1.70
0.94
Age (years)
63.22
89.34
76.36
132.38
79.51
127.51
Cabin (0/1)
0.01
0.08
0.02
0.13
0.02
0.14
Distance to water
(miles)
0.99
1.28
0.67
1.10
0.86
1.24
Homes with aquaculture
(2-mile)
13.97%
Coastal aquaculture
activity
Count
Acres†
Count
Acres†
Count
Standard lease
9
46.08
41
196.71
20
95.90
Experimental lease
8
24.86
6
2.18
7
8.03
Limited purpose
aquaculture
57
0.52
77
0.71
59
0.54
Public lease hearings
Count
Mean
Count
Mean
Count
Mean
Lease hearings
6
À
22
À
10
À
Concerns (all)††
25
4.17
62
2.82
75
7.50
Concerns (to riparian
users)†††
15
2.50
54
2.45
63
6.30
46.04%
14.77%
Acres†
Transactions by sale year (counts)
2012
1,641
359
492
2013
1,963
436
575
2014
2,094
443
577
†
Total number of acres in region.
Any recorded concern raised at the public lease hearing (e.g., access to broodstock or smell).
†††
Concerns raised at public lease hearings specific to the impacts on riparian homeowners and coastal
users (e.g., property values and change in viewscape).
††
Downloaded from IP address: 171.225.146.107, on 25 Jan 2022 at 19:10:16, subject to the Cambridge Core terms of use, available at /> />
Evans et al.
A Hedonic Analysis of the Impact of Marine Aquaculture 251
Transactions were geocoded using ArcGIS 10.3.1. Addresses were imported
into ArcMap and matched to road files obtained from the Maine Office of GIS
using the automatic match function. Unmatched addresses were manually
assigned using the best approximate location and cross-referenced using
Google maps.
Geocoded addresses were used to calculate spatial information related to
home sales and connect these transactions to coastal aquaculture activity. Of
particular importance was the location of a home in relation to coastal
waters. For example, living close to water is generally viewed as an amenity,
enhancing the value of the property. However, coastal aquaculture,
necessarily, takes place in coastal waters as well. Omitting this spatial
information will likely generate a positive bias on our estimate of the impact
of mariculture on residential property values. To this end, we calculated the
minimum distance from the home to the coastline and the percentage of
water within a buffer zone centered on the home. The percentage of water
acts as a proxy representing the view of the water for the home: a larger
percentage is suggestive of increased view of the water or waterfront
property. In addition, we also generated a dummy variable capturing whether
or not a home was within 1,000 feet of a government managed or conserved
beach, dock, park or land. Given the regulations on siting, being close to these
structures limits marine development near the home and may provide access
to additional amenities.3 Finally, we also included the elevation of the home
to proxy for other possible view effects.
Additional spatial information was collected to control for neighborhood
characteristics. While output-based measures are preferred (e.g., performance
of students on standardized tests), small populations throughout portions of
Maine limited data availability. Instead, expenditures per student for the
2014–2015 academic year was collected for each school district from the
Maine Department of Education to proxy for school quality. School quality
data were augmented with spatial information on the proportion of seasonal
housing units and median household income by census tract obtained from
the 2012, 2013 and 2014 estimates of the American Community Survey.
Coastal Aquaculture Activity
Historical spatial information on aquaculture leases in Maine, spanning 1981
through 2014, was obtained from the Maine Office of GIS. This data set
contains information on aquaculture leases, including data on location (i.e.,
shape of the lease, latitude, and longitude), scale of production (acreage),
3
The authors recognize that if there are omitted housing attributes that increase/decrease the
likelihood of aquaculture being sited near a home then this will introduce an endogeneity bias.
Repeat sales data, capturing sales prices before and after the siting of aquaculture, could be
used to explore this issue further.
Downloaded from IP address: 171.225.146.107, on 25 Jan 2022 at 19:10:16, subject to the Cambridge Core terms of use, available at /> />
252 August 2017
Agricultural and Resource Economics Review
target species (i.e., shellfish and sea vegetables), and lease type (i.e., standard,
experimental or LPA).4 These spatial data were linked to housing
transactions to capture information on coastal aquaculture production in
relation to residential homeowners.
To quantify the effects of coastal mariculture, we needed to incorporate this
information into the econometric model. One complication is that homes face
unique spatial arrangements of leases, such as different numbers of leases at
different distances with different scales of production. To capture the various
configurations, we generated an Aquaculture index variable Qi, which
combines this information to create a house-specific measure of aquaculture.
The form of this index was based on past research and intuition. Previous
literature suggests that homeowners prefer that aquaculture is sited further
from their home (Shafer, Inglis, and Martin 2010), but that these effects may
diminish nonlinearly with distance. Similarly, larger (and more) leases may
correspond with a larger visual impact (obscured and/or splintered
viewscape), potentially exacerbating issues of smell and noise, among other
types of concerns.
We explore two alternate forms for this index, to capture the density (number
of leases, Ki), scale (acreage, aik), and proximity (distance, dik) of aquaculture
sited near home i: a base case where Qi is defined as
(2)
Base: Qi ¼ Ki
X aik
k∈Ai
dik
where Ai denotes the set of active leases associated with home i at the time of
sale, and an alternate index that scales Qi by the portion of water contained
within a buffer zone wi.
Alternate: Qi ẳ wi ì Ki
X aik
kAi
dik
We hypothesize that the percentage of water within the buffer zone is linked to
the potential visibility of aquaculture production activity. Our indices are similar
in form to those used to explore the impact of hydraulic fracturing wells
(McCluskey and Rausser 2001, Gopalakrishnan and Klaiber 2014), but allow
more variation in spatial arrangements of leases.5
Data on finfish leases in Maine are also available. However, aquaculture production in our
study areas is exclusively shellfish and sea vegetables.
5
Alternative constructions of the index, e.g., separating by lease type, did not qualitatively
change the results.
4
Downloaded from IP address: 171.225.146.107, on 25 Jan 2022 at 19:10:16, subject to the Cambridge Core terms of use, available at /> />
Evans et al.
A Hedonic Analysis of the Impact of Marine Aquaculture 253
We use buffer zones, centered around each home, to define the spatial extent
of impacts from coastal aquaculture and thereby the set of leases associated
with each home, Ai. This approach is commonly used in the literature (Lewis,
Bohlen, and Wilson 2008, Gopalakrishnan and Klaiber 2014, Muehlenbachs,
Spiller, and Timmins 2015). Any lease/license outside this set is assumed to
have a negligible impact on the sales price of a home. We use an AIC statistic
to explore four potential radius distances for these buffer zones: 0.5, 1, 1.5,
and 2 miles. Our upper bound of 2 miles was selected through a mixture of
stakeholder feedback (aquaculturists, residents, and marine managers),
previous research in other settings, and the physical constraints of seeing
these marine structures (which for shellfish and sea vegetables are
approximately one foot above the surface of the water).6 Across all study
areas and models, a 2-mile radius distance was preferred (smallest AIC value).
Spatial data on leases were supplemented with qualitative information
surrounding public lease hearings. The leasing process in Maine falls under
the Administrative Procedures Act (APA) and requires public comments; all
standard leases (and some experimental leases) require public hearings
(Gericke and Sullivan 1994, MRSA 2013). Public aquaculture hearings offer
the public (e.g., riparian landowners, municipalities, interested government
agencies, and other interested parties) an opportunity to raise concerns
about the impacts of aquaculture in local waters. These hearings are
advertised 30 days prior in local newspapers and on the Maine DMR website,
and serve as an opportunity for resource users to raise concerns about
changes in the use of coastal waters surrounding the lease. Information from
these lease hearings often are released in local newspapers, with more
contentious hearings receiving additional print space (for example: Graves
(2016) and Mitterhoff (2016)).
Concerns raised at these hearings tend to be specific to the lease and focus on
localized changes in aesthetics and property values, and impacts on riparian
access, navigation, and fishing. This is in sharp contrast with the broad
concerns raised by the U.S. public toward aquaculture in general, which focus
on the effects on human health and the environment, the welfare of fish, and
a lack of regulatory structure and oversight (Schlag 2010, Claret et al. 2014).
Lease hearing information on localized attitudes (i.e., the subjective
information outside the criteria issued by the Maine DMR in the siting
decision) generally does not affect the leasing outcome and is therefore
treated as exogenous to siting decisions.
Hearing transcripts obtained from the Maine DMR were coded for the
frequency and type of concerns raised about each lease. These concerns were
6
These distances are within the range of those used in previous literature such as Lewis, Bohlen,
and Wilson (2008) , Gopalakrishnan and Klaiber (2014), and Muehlenbachs, Spiller, and Timmins
(2015) to identify localized environmental effects. Supplemental material contains a table of
distances and approaches used in other hedonic studies.
Downloaded from IP address: 171.225.146.107, on 25 Jan 2022 at 19:10:16, subject to the Cambridge Core terms of use, available at /> />
254 August 2017
Agricultural and Resource Economics Review
coded into five categories: public use and enjoyment (e.g., smell, noise, visual
impact, and property values), environmental impacts (e.g., water quality, flora
and fauna), conflicts with commercial fisheries, legal concerns with the lease
process, and practical concerns surrounding the lessee’s competency.
Separating comments from the public lease hearings into categories allowed
us to focus on the concerns most tightly connected with riparian
homeowners and housing prices. We focused on the information contained in
two categories: concerns about public use and enjoyment, explicitly including
property values and environmental impacts, for which a long literature in
environmental economics suggests should affect property values. We
combined this information to generate house-specific localized attitudes
toward aquaculture located in their coastal waters, labeled Neighborhood
attitudes (NAi) in our model. We interpret this combined set of concerns as
capturing the perceived effects of aquaculture on riparian homeowners and
coastal users. Neighborhood attitudes are calculated as the time-weighted
average number of concerns about the effects of aquaculture on riparian and
coastal users (e.g., public use and enjoyment and environmental impacts)
raised at public aquaculture lease hearings. Let
NAi ẳ
1 X Ck
Ki kA 1 ỵ tk
i
where Ck denotes the number of concerns raised about lease k and tk denote the
number of years between lease hearing and the sale year of the home. We
constrain the set of leases Ai used in the calculation of Neighborhood
attitudes to those that were active (in the water) when home i was sold. We
utilize a hyperbolic time-weighting function to place more weight on recent
information about local attitudes and significantly less weight on past
information. Alternate time-weighting functions were evaluated (i.e., equal
and linear time weighting) but had no qualitative effect on the results.
Decomposition of Marginal Effects
Our first research objective is to evaluate whether or not marine aquaculture
capitalizes into residential property values. Given the Box-Cox specification
for our hedonic model (equation (1)), our estimate of the MWTP for
aquaculture takes the form,
b
MWTP(Qi ) ¼ b
β3 Pi1Àλ
which is a function of two parameters of the model. The sign and significance
of b
β3 is sufficient to address our first research question. However, we are also
interested in exploring how these marginal impacts vary based on the spatial
Downloaded from IP address: 171.225.146.107, on 25 Jan 2022 at 19:10:16, subject to the Cambridge Core terms of use, available at /> />
Evans et al.
A Hedonic Analysis of the Impact of Marine Aquaculture 255
characteristics of mariculture, such as density of leases, acreage of lease, and
proximity to residential properties. That is, we are also interested in the
MWTP for each component of Qi. To this end, we follow the decomposition
outlined by Gopalakrishnan and Klaiber (2014), which makes use the total
differential of Qi and the chain rule to isolate these margins.7 In the
following, we will use the base case version of the Aquaculture index to
demonstrate.
Based on equation (2), the total differential for Qi takes the form,
(3)
dQi ẳ
X aik
kAi
dik
dKi ỵ Ki
X 1
X aik
daik Ki
ddik :
d
d2
k∈A ik
k∈A ik
i
i
Equation (3) suggests that the effect of a change in the house-specific
Aquaculture index can be decomposed into three pieces: the density effect
(holding acreage and proximity constant), the acreage effect (holding the
number of aquaculture sites and proximity constant), and the proximity
effect (holding the number of aquaculture sites and acreage constant). We
use the information from this decomposition to parse out the three margins
of interest.
Let qik denote an attribute of lease k associated with home i (e.g., acreage or
distance): one component of Qi. The MWTP for attribute qik is simply
MWTP(qik ) ¼
dPijt ∂Pijt ∂Qi
¼
dqik
∂Qi ∂qik
where ∂Qi/∂qik can be calculated using equation (3). However, we are not
interested in the effect of lease k, per se. We are more interested in the
“average” marginal effect on house i for a change in attribute q over all
the leases that fall within the buffer zone of a home. To this end, we calculate
the average marginal effect of a change in qi· on house i as,
MWTP(qiÁ ) ¼
1X
MWTP(qik ):
Ki k∈A
i
7
An anonymous referee suggested an alternate, two-stage approach, to ensure that the ceteris
paribus assumption holds: In the first stage, use the parameter estimates to predict nonmarginal
changes in sales prices (before and after the siting of leases); in the second stage, regress these
predicted price changes on the change in the number of leases, lease acreage, and the average
distance. Slope estimates from this second stage can be interpreted as a MWTP estimate for the
spatial arrangement of leases. Bootstrapping can be performed to ensure that the second-stage
standard errors capture the noise from first-stage estimates.
Downloaded from IP address: 171.225.146.107, on 25 Jan 2022 at 19:10:16, subject to the Cambridge Core terms of use, available at /> />
256 August 2017
Agricultural and Resource Economics Review
For simplicity, we will refer to this “average” marginal effect as the marginal
effect.
Due to the form of Qi, we restrict our calculations of MWTP(Qi) to the subset
of homes that contained aquaculture at the time of sale. For a house that did not
originally contain aquaculture, the MWTP is forced to zero by construction of
the Aquaculture index.
Results
The statistical models fit the data well (Table 3). The adjusted R2 values are
fairly high, ranging from 0.590 to 0.733. This, coupled with large model Fstatistics (35.260 to 307.754), suggests that the variables included in the
statistical models are jointly relevant and capture most of the variation in
housing prices. Finally, all models reject the linear, log-linear, and reciprocal
specifications in favor of the Box-Cox transformed models (all p-values are
less than 0.015).
All parameter estimates for the structural characteristics, except for the
variable Cabin, are statistically significant and have the expected signs. We
fail to find evidence that Cabin is significant in Casco Bay. This is
unsurprising, as these sales make up less than 0.5 percent of the observed
transactions in the Casco Bay housing market. As expected, distance from
water negatively impacts housing prices, with this effect dropping off
between 2–5 miles from shore. Joint tests suggest this variable is significant
across all models. Waterfront properties and those with larger views of water
also receive price premiums across all three markets. This supports our
expectation that water is perceived as an amenity. In addition, being close to
a government-managed or conserved beach, dock, park, or land has a positive
impact on prices in all regions except Damariscotta. Finally, our controls for
neighborhood characteristics provide mixed results.
Impact of Coastal Aquaculture Production
We incorporated home-specific information on localized attitudes to separate
the effect of neighborhood concerns toward aquaculture, which may depress
local property values, from the actual spatial arrangement of leases
experienced. Interestingly, we fail to find evidence that Neighborhood
attitudes affect property values. This does not mean that these localized
attitudes do not matter in coastal real-estate markets; rather, our proxy for
this fails to find evidence. This is potentially a limitation of using transcripts
from public lease hearings. These hearings only occur for standard leases and
some experimental leases (if sufficient comments are made during the public
comment period). This bounds the information that we can observe about
attitudes, which is compounded by the fact that LPAs, which are more
common in these study areas (Table 2), are implicitly assigned zero concerns.
Downloaded from IP address: 171.225.146.107, on 25 Jan 2022 at 19:10:16, subject to the Cambridge Core terms of use, available at /> />
Control variables
Bathrooms
Living Space (1,000s square feet)
Lot size (100s acres)
Age squared
Cabin (0/1)
Distance to water (miles)
Distance sq to water (miles)
View of water (% 2–mile buffer)
Waterfront (0/1)
Govt. Beach/Dock (0/1)
Damariscotta
Penobscot Bay
0.324***
(0.036)
1.092***
(0.033)
3.137***
0.323***
(0.036)
1.091***
(0.033)
3.133***
0.583***
(0.131)
1.247***
(0.139)
5.604***
0.584***
(0.132)
1.249***
(0.140)
5.609***
1.080***
(0.167)
1.338***
(0.221)
11.074***
1.110***
(0.171)
1.371***
(0.226)
11.376***
(0.580)
À0.218***
(0.023)
0.005***
(0.001)
À0.317
(0.250)
À0.171***
(0.579)
À0.218***
(0.023)
0.005***
(0.001)
À0.311
(0.249)
À0.171***
(0.686)
À0.270***
(0.051)
0.004***
(0.001)
0.717*
(0.368)
À0.237
(0.687)
À0.269***
(0.051)
0.004***
(0.001)
0.714*
(0.369)
À0.244
(1.563)
À0.589***
(0.076)
0.012***
(0.002)
1.685**
(0.783)
À0.396
(1.602)
À0.601***
(0.078)
0.012***
(0.002)
1.744**
(0.810)
À0.301
(0.041)
0.018***
(0.006)
2.282***
(0.141)
1.333***
(0.101)
0.221*
(0.041)
0.018***
(0.006)
2.289***
(0.142)
1.333***
(0.101)
0.219*
(0.172)
0.067**
(0.031)
3.396***
(0.473)
1.545***
(0.172)
0.118
(0.173)
0.068**
(0.031)
3.397***
(0.474)
1.549***
(0.172)
0.115
(0.252)
0.112***
(0.043)
5.458***
(0.751)
2.848***
(0.297)
0.865***
(0.259)
0.101**
(0.044)
6.140***
(0.789)
2.941***
(0.304)
0.886***
(0.121)
(0.121)
(0.269)
(0.270)
(0.309)
(0.316)
Continued
A Hedonic Analysis of the Impact of Marine Aquaculture 257
Age (50 years)
Casco Bay
Evans et al.
Table 3. Parameter Estimates from the Box-Cox Hedonic Pricing Model. Sales prices are transformed using the BoxCox transformation parameter λ. Robust standard errors are reported in parentheses. Parameter estimates for
municipality and year fixed effects are available upon request.
Downloaded from IP address: 171.225.146.107, on 25 Jan 2022 at 19:10:16, subject to the Cambridge Core terms of use, available at /> />
Control variables
Elevation (100s feet)
Seasonal homes (% census tract)
Median income† ($10,000s)
Spending per student ($1,000s)
Sale in winter (0/1)
Constant
Casco Bay
À0.328***
(0.122)
À0.024
À0.329***
(0.122)
À0.025
0.029
(0.081)
À0.068
0.038
(0.083)
À0.087
(0.003)
0.004
(0.015)
0.048
(0.032)
À0.144***
(0.041)
19.804***
(0.003)
0.005
(0.015)
0.049
(0.032)
À0.144***
(0.041)
19.778***
(0.057)
À1.245***
(0.450)
0.043
(0.049)
À0.065
(0.149)
29.587***
(0.057)
À1.241***
(0.451)
0.042
(0.049)
À0.067
(0.149)
29.613***
(0.063)
0.613*
(0.343)
0.141*
(0.073)
À0.054
(0.195)
25.349***
(0.067)
0.639*
(0.352)
0.136*
(0.074)
À0.060
(0.201)
25.787***
(2.639)
(2.643)
(1.852)
(1.916)
À0.778
(0.512)
0.694***
(0.215)
À0.770
(0.512)
0.000
(0.335)
À23.392**
(10.882)
À0.061
(0.336)
†
0.100***
(0.010)
5698
0.733
307.754
À7.894
(9.837)
0.099***
(0.010)
5698
0.733
307.968
Median household income ($10,000s) in the home’s census tract.
Significance levels: *** p < 0.01, ** p < 0.05, and * p < 0.10
0.110**
(0.022)
1238
0.598
39.255
4.342***
(1.367)
0.111**
(0.022)
1238
0.598
39.200
0.141***
(0.017)
1644
0.590
35.260
À57.609**
(24.721)
0.143***
(0.017)
1644
0.590
35.568
Agricultural and Resource Economics Review
À0.101***
(0.027)
À0.007**
Aquaculture index (alternate)
Number of observations
Adjusted R2
F–statistics (Wald)
Penobscot Bay
À0.101***
(0.027)
À0.007**
(0.203)
(0.203)
Aquaculture Variables and Transformation Parameter
Neighborhood attitudes
À0.005
0.012
(0.058)
(0.055)
Aquaculture index (base)
À0.885
(2.922)
Transformation parameter (λ)
Damariscotta
258 August 2017
Table 3. Continued
Downloaded from IP address: 171.225.146.107, on 25 Jan 2022 at 19:10:16, subject to the Cambridge Core terms of use, available at /> />
Evans et al.
A Hedonic Analysis of the Impact of Marine Aquaculture 259
We find more interesting patterns related to the Aquaculture index, which
captures the spatial arrangement of leases in relation to a home. Our results
suggest variation in the impact on housing prices across the three regions.
We fail to find evidence of any impact in Casco Bay, while we find statistically
significant evidence for the other study areas. This pattern is robust to our
specification of the Aquaculture index (base and alternate form). It is difficult
to directly compare the magnitude of coefficients across models, as each is
transformed using a different value for the Box-Cox transformation
parameter. Instead, the following focuses on differences in sign and
significance across regions.
For example, Aquaculture index is significant and positive for the
Damariscotta River region. That is, after controlling for structural and
neighborhood characteristics, and attitudes surrounding aquaculture, houses
with “more” coastal aquaculture command a higher price on average,
suggesting that aquaculture may be viewed as an amenity in the region. In
Penobscot Bay, we find the opposite result, with coastal aquaculture lowering
sales prices – coastal aquaculture may be viewed as a disamenity in this
housing market. This pattern is consistent with the information on concerns
raised at public lease hearings (Table 2). Note that, on average, there are
more than twice as many concerns raised about the development of
mariculture and how it affects riparian homeowners and coastal users in
Penobscot Bay.
Given the evidence that aquaculture capitalizes into residential property
values in two study areas, we explore the relative magnitude of these
marginal impacts – are they large or small in these study areas? That is,
while statistically significant, are these results economically significant? A
comparison of the marginal effects for the components of the Aquaculture
index will provide insight into this,and answer our second research question.
Based on the design of this index, there are three margins of interest: the
density effect, the acreage effect, and the proximity effect (equation 3). The
density effect measures the marginal impact of an additional lease sited near
a home, holding the number of acres of aquaculture production and
proximity constant.8 The acreage effect and proximity effect have similar
interpretations. Given the Box-Cox transformation and the form of the
Aquaculture index, these margins are nonlinear and depend on a combination
of parameter estimates, the Box-Cox transformation parameter, and,
importantly, the sales price of a home; this generates heterogeneity in the
marginal impacts across the sample. We calculate margins at the house-level
using sample values. Further, we restrict attention to houses with
aquaculture sited within a 2-mile buffer zone of the home. Given skewness in
prices (evident from the estimates of the Box-Cox transformation parameter),
8
This is similar in theme to the expected contribution of an additional bedroom, ceteris paribus,
to the sales price of home, which holds square footage of the home constant.
Downloaded from IP address: 171.225.146.107, on 25 Jan 2022 at 19:10:16, subject to the Cambridge Core terms of use, available at /> />
260 August 2017
Agricultural and Resource Economics Review
the margins will also be skewed, creating larger marginal effects on more
expensive homes. To address skewness, we focus on measures of the median
marginal impact. See Section 3.3 for more details on calculation of these
margins.
Table 4 depicts the median MWTP for our sample by study area and model:
including the density effect, acreage effect and proximity effect. In all cases, the
median MWTP is smaller (in absolute value) than the average MWTP (not
shown), suggesting a long tail to the house-level distribution of marginal
impacts – as expected, given the skew in prices. There are significant
differences in the scale of marginal effects across regions. For example, the
median MWTP for an increase in the density of aquaculture leases (its
implicit marginal price) in the Damariscotta River region range from $2 to $4
(across models) but are much larger and negative in Penobscot Bay (À$1,006
to À$1,589). Similar patterns exist for increasing the acreage of aquaculture
and moving leases closer to homes, with the median marginal impacts being
larger and negative in Penobscot Bay: between À$638 and À$705 per acre
and À$0.44 and À$0.78 per meter, respectively. Given the different units of
measure for these components, it is difficult to make comparison across
effects (e.g., proximity versus acreage). The smaller marginal impact on
proximity should not be inferred as smaller effect.
While statistically significant, the magnitude of the sample MWTPs for the
Damariscotta River region suggest they are not economically significant. That
is, relative to the sales price of a home, the MWTPs in this study area are
inconsequentially small: the median MWTP was less than 0.01 percent of the
sales price of a home across all margins and models. As such, the following
focuses on the larger MWTP estimates from Penobscot Bay. In the base
model, 95 percent of the sample estimates of the density effect, i.e., the MWTP
for an additional lease near a home, correspond with a reduction in sales
price of a home between less than 0.01 percent (very small) and 4.71 percent
(much larger). Within this sizable range of impacts, the median loss is only
1.06 percent of the sales price. Similar patterns exist for increasing acreage
and reducing proximity. In the alternate model, adjusting the Aquaculture
index to control for the portion of water in the buffer zone, our median loss
is smaller (0.51 percent), though the 95-percent interval is largely unchanged
(between less than 0.01 percent to 4.39 percent).
Discussion
Marine aquaculture could grow to be an important component of the “blue
economy” for the United States. It has the potential to help satisfy growing
demand for fish protein, reduce the U.S. seafood trade deficit, create healthier
oceans, and provide localized benefits to coastal communities. Despite the
potential economic and ecological benefits from expanding coastal
aquaculture, its expansion will alter the mixture of winners and losers,
potentially creating tensions among coastal resource users, regulators,
Downloaded from IP address: 171.225.146.107, on 25 Jan 2022 at 19:10:16, subject to the Cambridge Core terms of use, available at /> />
Evans et al.
Study area
Model
Casco Bay
Base
Alternate
Damariscottta
Penobscot Bay
Density
Acreage
Proximity
À39.64
À54.71
À0.01
À122.62
À228.04
À0.05
Base
1.69***
93.77***
0.01***
Alternate
3.59***
156.05***
0.01***
Base
À1,588.79**
À704.57**
À0.78***
Alternate
À1,006.27***
À637.75***
À0.44***
Significance levels: *** p < 0.01, ** p < 0.05, and * p < 0.10
A Hedonic Analysis of the Impact of Marine Aquaculture 261
Table 4. Median Marginal Willingness-to-Pay (MWTP) ($) for coastal aquaculture by study area and model. Estimates
calculated from the subset of observations that contained aquaculture within a 2-mile buffer zone. Density depicts the
margin for an additional lease holding the number of acres and distance of leases to houses constant – increasing the
density of leases contained in the existing acreage. Acreage depicts the margin for an additional acre of aquaculture,
holding the number of leases and distance from housing constant. Proximity depicts the margin for moving 1 meter closer
to aquaculture holding the number of leases and acres constant. One-tailed p-values simulated using 100,000 draws from
the parameters estimates (Table 3).
Downloaded from IP address: 171.225.146.107, on 25 Jan 2022 at 19:10:16, subject to the Cambridge Core terms of use, available at /> />
262 August 2017
Agricultural and Resource Economics Review
government agencies and other invested stakeholders (e.g., NGOs) (Knapp
2012, Knapp and Rubino 2016). Researchers argue that we could reduce
these tensions through improved availability of interdisciplinary research and
communication of the positive benefits of aquaculture to these groups of
users (Bricknell and Langston 2013, NOAA 2016b). These challenges
highlight the importance of acceptance by coastal resource users for the
successful expansion of mariculture. Resource managers and regulators with
a deeper understanding of the impacts of marine development (e.g.,
mariculture) could design spatial plans that balance concerns across a suite
of users and promote this emerging industry. To this end, quantifying the
impacts of mariculture development on coastal residential property values
provides resource managers with valuable information for integrative marine
spatial planning.
This paper presents an important addition to the literature and provides one
of the first empirical analyses of the effect of marine aquaculture on coastal,
residential property values. This revealed-preference study complements the
stated-preference work on public perceptions toward aquaculture (Shafer,
Inglis, and Martin 2010, D’Anna and Murray 2015, Jodice et al. 2015). Further,
the design of our hedonic model allows us to address questions of direct
interest to policy makers and land managers regarding the development of
mariculture. Specifically, we measure not just the impact from proximity to
aquaculture, but also from the spatial configuration of its siting, e.g., the
density and acreage of leases across the local seascape. The results from this
work provide insights into the impact of decentralized expansion of marine
aquaculture. Finally, our results can also inform future exploratory analyses
of transcripts from aquaculture lease hearings. For example, an exploration of
the patterns of concerns raised at these hearings, and how they vary by lease,
lessee, and community characteristics could be important for coastal
managers. This type of analysis could provide information about the efficacy
of public participation in the siting process, as well as provide insight into
designing a siting framework that improves social acceptance of mariculture.
While there is a rich body of work that has evaluated the impact of land-based
farming (Abeles-Allison and Connor 1990, Palmquist, Roka, and Vukina 1997,
Le Goffe 2000, Herriges, Secchi, and Babcock 2005, Ready and Abdalla 2005,
Kim and Goldsmith 2009), few studies have attempted to investigate the
impact of water-based farming on residential property values (Northern
Economics 2010, Jodice et al. 2015, Sudhakaran 2015). Our work fills this
hole in the research. Our results suggest wide variation in how marine
development of aquaculture impacts property values, both across and within
study areas. In Casco Bay, we fail to find statistical evidence of impacts from
marine aquaculture. Recall that this is an urban area for Maine, with an
active working waterfront for shipping, recreation, and commercial fishing. It
is possible that mariculture is insubstantial relative to these other coastal
uses. In the Damariscotta River region, we find statistically significant and
positive effects of the development of marine aquaculture. However, these
Downloaded from IP address: 171.225.146.107, on 25 Jan 2022 at 19:10:16, subject to the Cambridge Core terms of use, available at /> />
Evans et al.
A Hedonic Analysis of the Impact of Marine Aquaculture 263
effects are very small – economically insignificant. This region has a long history
of promoting aquaculture in its waters (Damariscotta River Association 2016).
Our results may suggest that these efforts have been largely successful so that
mariculture “blends” into the seascape. Finally, in Penobscot Bay, we find both
statistically and economically significant negative impacts. Within this region,
property values tend to fall as aquaculture leases become larger, denser, and
closer to coastal homeowners. There is considerable within-sample variation
of these impacts. Ninety-five percent of the observed transactions that had
aquaculture within two miles experienced reductions in sales price from as
low as less than 0.01 percent to as high as 4.7 percent (base model). For the
past 40 years, this region has grown dependent on ecotourism for its income,
relying on the natural quality of its environment (Penobscot Marine Museum
2012). Marine aquaculture could appear intrusive to the perception of this
natural environment. This would be consistent with past research (Shafer,
Inlgis, and Martin 2010, D’Anna and Murray 2015).
Despite the results that property values in two study areas are unaffected by
the current level of mariculture, this does not suggest that we should target
development in these areas. The hedonic model limits us to insights about
the effect of development on the margin – household location choices are
fixed. If we are to achieve the level of development suggested by NOAA’s
target (50-percent increase in marine production by volume), then this would
require large-scale, nonmarginal change in our coastal waters, which may
lead to substantially different results. For example, it is possible that while a
marginal increase in development of mariculture may reduce property values
in Penobscot Bay, large-scale development may increase property values if it
generates sufficient increases in local incomes through direct and indirect
economic spillovers. While understanding the effects of nonmarginal
development is important, it is beyond the scope of this paper. Future work
should consider incorporating estimators capable of predicting nonmarginal
impacts (e.g., equilibrium sorting models or other structural equation
models). An important component of this work should be identifying the
mechanisms through which aquaculture affects property values and the
distance at which these effects become negligible.
It is also unlikely that the uncoordinated development of marine aquaculture
will balance productive (e.g., profitable) growing of marine-based food with the
spatial variation of social acceptance. Instead, we may want to consider
adjustments to the leasing process to improve our awareness of these
potential tradeoffs. For example, if the state wants to maintain control over
the leasing process, it may consider the use of marine aquaculture zones.
These predefined lease areas could be evaluated for biological productivity
and social acceptance, coordinating development along the coastline.
Alternatively, fine-scale management may also be successful. A potential
candidate would be a co-managed process with municipalities, similar to how
Maine currently co-manages its soft-shell clam fishery, giving municipalities
power to govern access, fishing effort, and conservation activities in coastal
Downloaded from IP address: 171.225.146.107, on 25 Jan 2022 at 19:10:16, subject to the Cambridge Core terms of use, available at /> />
264 August 2017
Agricultural and Resource Economics Review
waters. This would allow leasing to capture the spatial heterogeneity of
preferences across the coastline, and designate acceptable lease areas.
Our work reveals interesting challenges for coastal resource managers. There
are potential benefits from coordinating aquaculture siting decisions to balance
the competing objectives of diverse groups of coastal resource users. Policy
makers could find this information especially relevant when considering
future development of aquaculture and coastal planning as coastal
development continues to accommodate growing populations and aging
communities. Questions about the scale of coastal development are becoming
more pressing as coastal populations grow (NOAA 2013). This requires
information on preferences from multiple groups of users, which is often
costly and difficult to obtain. The results from our hedonic pricing model aid
to fill knowledge gaps for these managers, providing information on
preferences toward the development of aquaculture in coastal waters by one
particular group of users, coastal residents. It is possible that although an
area may be biologically suitable for aquaculture development, failure to
consider the social suitability of siting decisions could lead to unintended
consequences that slow the long-run development of marine aquaculture.
Our findings provide empirical evidence that mariculture sometimes exerts
an externality that is often overlooked, but not always. Thus, it is worthwhile
for both stakeholders and policy makers to carefully consider the impacts.
Future planning and development can use these results and insights to
inform integrative coastal management.
Supplementary Material
To view supplementary material for this article, please visit />1017/age.2017.19.
References
Abeles-Allison, M., and L.J. Connor. 1990. “An Analysis of Local Benefits and Costs of Michigan
Hog Operations Experiencing Environmental Conflicts.” Agricultural Economic Report
Series 201396, Department of Agricultural, Food, and Resource Economics, Michigan
State University, East Lansing, MI.
Bhat, M., and R. Bhatta. 2004. “Considering Aquacultural Externality in Coastal Land
Allocation Decisions in India.” Environmental and Resource Economics 29(1): 1–20.
Bohlen, C., and L.L. Lewis. 2009. “Examining the Economic Impacts on Hydropower Dams on
Property Values using GIS.” Journal of Environmental Management 90(3): S258–S269.
Box, G.E.P., and D.R. Cox. 1964. “An Analysis of Transformations.” Journal of the Royal
Statistical Society 26(2): 211–252.
Bricknell, I., and A. Langston. 2013. “Aquaculture: It’s Not All About Atlantic Salmon.” Journal
of Fisheries and Livestock Production 1(1): 41–72.
Claret, A., L. Guerrero, R. Gines, A. Grau, M. Hernandez, E. Aguirre, J. Peleteiro, C. FernandezPato, and C. Rodriguez-Rodriguez. 2014. “Consumer Beliefs Regarding Farmed Versus
Wild Fish.” Appetite 79: 25–31.
Downloaded from IP address: 171.225.146.107, on 25 Jan 2022 at 19:10:16, subject to the Cambridge Core terms of use, available at /> />
Evans et al.
A Hedonic Analysis of the Impact of Marine Aquaculture 265
Damariscotta River Association. River Facts. Available at www.damariscottariver.org/aboutus/river-facts/ (accessed May 12, 2016).
D’Anna, L.M., and G.D. Murray. 2015. “Perceptions of Shellfish Aquaculture in British Columbia
and Implications for Well-Being in Marine Social-Ecological Systems.” Ecology and Society
20(1): 57–68.
East Coast Environmental Law. 2014. “Comparative Analysis of Aquaculture Regulatory
Frameworks in Maine and Nova Scotia.” Report for the Doelle-Lahey Panel:
Independent Aquaculture Regulatory Review for Nova Scotia.
Food and Agriculture Organization of the United Nations. 2016. “The State of World Fisheries
and Aquaculture 2016: Contributing to Food Security and Nutrition for All.” Technical
Report. Rome.
Gericke, K.L., and J. Sullivan. 1994. “Public Participation and Appeals of Forest Service Plans –
An Empirical Examination.” Society and Natural Resources 7(2): 125–135.
Gibbs, J., J. Halstead, K. Boyle, and J. Huang. 2002. “An Hedonic Analysis of the Effects of Lake
Water Clarity on New Hampshire Lakefront Properties.” Agricultural and Resource
Economics Review 31(1): 39–46.
Gopalakrishnan, S., and H.A. Klaiber. 2014. “Is the Shale Energy Boom a Bust for Nearby
Residents? Evidence from Housing Values in Pennsylvania.” American Journal of
Agricultural Economics 96(1): 43–66.
Graves, L. 2016. “Oyster farm drawing fire.” Mount Desert Islander, August 4.
Griliches, Z. 1971. “Hedonic Price Indexes of Automobiles: An Econometric Analysis of Quality
Change.” In Z. Griliches, ed., Price Indexes and Quality Change. Cambridge: Cambridge
University Press.
Herriges, J.A., S. Secchi, and B.A. Babcock. 2005. “Living with Hogs in Iowa: The Impact of
Livestock Facilities on Rural Residential Property Values. Land Economics 81(4), 530–
545.
Jodice, L.W., W.C. Norman, J. Davis, G. Coskun, and S. Kang. 2015. “Perceptions of Marine
Aquaculture in Coastal Tourist Destinations in the US Southeastern Region.” Technical
Report. Clemson University - South Carolina Sea Grant, Clemson, SC.
Kapetsky, J., J. Aguilar-Manjarrez, and J. Jenness. 2013. “A Global Assessment of Offshore
Mariculture Potential from a Spatial Perspective.” FAO Fisheries and Aquaculture
Technical Paper 549. Food and Agriculture Organization of the United Nations. Rome.
Kim, J., and P. Goldsmith. 2009. “A Spatial Hedonic Approach to Assess the Impact of Swine
Production on Residential Property Values.” Environmental and Resource Economics 42
(4): 509–534.
Kite-Powell, H.L., M.C. Rubino, and B. Morehead. 2013. “The Future of US Seafood Supply.”
Aquaculture Economics and Management 17(3): 228–250.
Knapp, G. 2008. “Offshore Aquaculture in the United States: Economic Considerations,
Implications and Opportunities.” In M. Rubino, ed., Economic Potential of US Offshore
Aquaculture. NOAA Technical Memorandum NMFS F/SPO-103.
——— 2012. “The Political Economics of United States Marine Aquaculture.” Bulletin of the
Fisheries Research Agency. 35: 51–63.
Knapp, G., and M.C. Rubino. 2016. “The Political Economics of Marine Aquaculture in the
United States.” Reviews in Fisheries Science and Aquaculture 24(3): 213–229.
Lapointe, G. 2013. “Overview of the Aquaculture Sector in New England” Northeast Regional
Ocean Council White Paper.
Le Goffe, P. 2000. “Hedonic Pricing of Agriculture and Forestry Externalities.” Environmental
and Resource Economics 15(4): 397–401.
Lewis, L.L., C. Bohlen, and S. Wilson. 2008. “Dams, Dam Removal, and River Restoration: A
Hedonic Property Value Analysis.” Contemporary Economic Policy 26(2): 175–186.
Maine Aquaculture Association (MAA). 2015. Maine aquaculture snapshot. Available at
(Accessed March
20, 2016).
Downloaded from IP address: 171.225.146.107, on 25 Jan 2022 at 19:10:16, subject to the Cambridge Core terms of use, available at /> />
266 August 2017
Agricultural and Resource Economics Review
Maine Coastal Program. 2013. Maine Coastal Zone Map. Available at />dacf/mcp/about/coastalzonemap.htm (Accessed December 28, 2015).
Maine Department of Marine Resources. n.d. Aquaculture in Maine. Available at http://www.
maine.gov/dmr/aquaculture/ (Accessed October 4, 2015).
———, 2016. Maine Aquaculture Harvest Data. Available at />aquaculture/harvestdata/index.html (Accessed October 4, 2015).
Maine Revised Statutes Annotated (MRSA) 12, Chapter 2. 2013. Aquaculture Lease
Regulations. Available at />documents/0202_101713.pdf (Accessed October 30, 2015).
Mazur, N.A., and A.L. Curtis. 2008. “Understanding Community Perceptions of Aquaculture:
Lessons from Australia.” Aquaculture International 16(6): 601–621.
McCluskey, J.J., and G.C. Rausser. 2001. “Estimation of Perceived Risk and its Effect on
Property Values.” Land Economics 77(1): 42–55.
McGinnis, M.V., and M. Collins. 2013. “A Race for Marine Space: Science, Values, and
Aquaculture Planning in New Zealand.” Coastal Management 41(5): 401–419.
Michael, H., K. Boyle, and R. Bouchard. 2000. “Does the Measurement of Environmental
Quality Affect Implicit Prices Estimated from Hedonic Models?” Land Economics 79(2):
283–598.
Mitterhoff, M. 2016. “Hearing on mussel farm lease to resume.” Mount Desert Islander, January
16.
Muehlenbachs, L., E. Spiller, and C. Timmins. 2015. “The Housing Market Impacts of Shale Gas
Development.” American Economic Review 105(12): 3633–3659.
National Oceanic and Atmospheric Administration (NOAA). 2013. “National Coastal
Population Report: Population trends from 1970 to 2020.” NOAA’s State of the Coast
Report Series. National Oceanic and Atmospheric Administration, Washington, DC.
Available at (Accessed
August 27, 2016).
———. 2015. “Imports and Exports of Fishery Products: Annual Summary, 2014 Revised.”
Technical Report. Current Fishery Statistics NO. 2014-2, National Oceanic and
Atmospheric Administration, Washington, DC.
———, 2016a. Aquaculture in the United States. Available at http:////www.nmfs.noaa.gov/
aquaculture/aquacultureaquaculture_inin_us.html (Accessed July 11, 2016).
———, 2016b. “Marine Aquaculture Strategic Plan: FY 2016-2020.” Technical Report,
National Oceanic and Atmospheric Administration (NOAA), Washington, DC. Available at
/>aquaculture_strategic_plan_fy_2016-2020.pdf (Accessed July 11, 2016).
Maryland Natural Resources Code §4-11A-05. 2015. Chesapeake Bay – Aquaculture
Enterprise Zone. Available at />title-4/subtitle-11a/section-4-11a-05/ (Accessed August 15, 2016).
Northern Economics. 2010. “Technical Memorandum: Property Value Study - NOAA Marine
Aquaculture Grant.” Technical memorandum. Anchorage, AK.
Palmquist, R.B., F.M. Roka, and T. Vukina. 1997. “Hog Operations, Environmental Effects, and
Residential Property Values.” Land Economics 73(1): 114–124.
Penobscot Marine Museum. 2012. Working the Bay. Available at http://www.
penobscotmarinemuseum.org/pbho-1/working-the-bay/changes-industries-and-risetourism (Accessed May 11, 2016).
Poor, P., K. Pessagno, and R. Paul. 2007. “Exploring the Hedonic Value of Ambient Water
Quality: A Local Watershed-based Study.” Ecological Economics 60(4): 797–806.
Primavera, J. 2006. “Overcoming the Impacts of Aquaculture on the Coastal Zone.” Ocean and
Coastal Management 49(9–10), 531–545.
Ready, R.C., and C.W. Abdalla. 2005. “The Amenity and Disamenity Impacts of Agriculture:
Estimates from a Hedonic Pricing Model.” American Journal of Agricultural Economics
87(2): 314–326.