ECONOMIC EVALUATION OF HEALTH IMPACTS DUE TO ROAD TRAFFIC-RELATED AIR POLLUTION pptx
Bạn đang xem bản rút gọn của tài liệu. Xem và tải ngay bản đầy đủ của tài liệu tại đây (239.42 KB, 29 trang )
1
ECONOMIC EVALUATION OF HEALTH IMPACTS DUE TO ROAD TRAFFIC-RELATED
AIR POLLUTION
An impact assessment project of Austria, France and Switzerland
by H.
SOMMER, N.
KÜNZLI, R. SEETHALER, O. CHANEL, M. HERRY, S. MASSON,
J-C. VERGNAUD, P. FILLIGER, F. HORAK Jr., R. KAISER, S. MEDINA,
V. PUYBONNIEUX-TEXIER, P. QUÉNEL, J. SCHNEIDER, M. STUDNICKA
Summary
In preparation for the Transport, Environment and Health Session of the WHO Ministerial Conference
on Environment and Health in London (June 1999) a tri-lateral project was carried out by Austria,
France and Switzerland.
The project assessed the health costs of road-traffic related air pollution in the three countries using a
common methodological framework.
Based on the average yearly population exposure to particulate matter with an aerodynamic diameter
of less than 10
µ
m (PM10) and the exposure-response function for a number of different health
outcomes, the number of cases attributable to (road traffic-related) air pollution was estimated.
Using the willingness-to-pay as a common methodological framework for the monetary valuation,
material costs such as medical costs and loss of production or consumption as well as the intangible
costs of pain, suffering, grief and loss in life quality were considered. The monetary valuation
provided the following results (see Summary Table).
All three countries together bear some 49’700 million EUR
1
of air pollution related health costs, of
which some 26’700 million EUR are road-traffic related. In each country, the mortality costs are
predominant, amounting to more than 70 %.
1
1 EUR ≈ 0.94 US $, April 2000
2
The annual national per capita costs of total air pollution related health effects result in a similar
range of values for all three countries. Considering the per capita health costs due to road
traffic-related air pollution, the differences between the countries are even lower with a range from
180-540 EUR for Austria (central value 360 EUR), 190-560 EUR for France (central value 370 EUR)
and 160-470 EUR for Switzerland (central value 304 EUR).
Summary Table. Health costs due to road traffic-related air pollution in Austria, France and
Switzerland based on the willingness-to-pay approach (1996)
Costs of mortality 5’000 2’200 28’500 15’900 3’000 1’600
(million EUR)
3’000 - 7’000 1’300 - 3’000 17’300 - 39’900 9’600 - 22’200 1’800 - 4’200 1’000 - 2’200
Costs of morbidity 1’700 700 10’300 5’700 1’200 600
(million EUR)
400 - 3’000 200 - 1’300 2’800 - 18’500 1’500 - 10’300 300 - 2’100 200 - 1’100
Total costs
6’700 2’900 38’800 21’600 4’200 2’200
(million EUR)
3’400 - 10’000 1’500 - 4’300 20’100 - 58’400 11’100 - 32’500 2’100 - 6’300 1’200 - 3’300
Costs of mortality 36’500 19’600
(million EUR)
22’100 - 51’100 11’900 - 27’500
Costs of morbidity 13’200 7’100
(million EUR)
3’500 - 23’700 1’900 - 12’800
Total costs 49’700 26’700
(million EUR)
25’600 - 74’900 13’700 - 40’200
Austria
France
Total costs
with road
traffic share
Costs
attributable
to road
Total costs
with road
traffic share
Costs
attributable
to road
Switzerland
Total costs
with road
traffic share
Costs
attributable
to road
all three countries
Total costs
with road
traffic share
Costs
attributable
to road
3
1. Introduction
The objective of this tri-lateral research project was to quantify the health costs due to road
traffic-related air pollution. The project was carried out by Austria, France and Switzerland. The
results of this co-operation provided an input for the WHO Ministerial Conference in June 1999.
2
The monetary evaluation of the health costs is based on an interdisciplinary co-operation in the fields
of air pollution, epidemiology and economy. Figure 1 presents an overview of the different tasks of the
three domains.
• Air pollution: Evaluation of the (traffic related) exposure to particulate matter: The starting point
of the study is the determination of the pollution level in 1996 to which the population was
exposed. The entire population of Austria, France and Switzerland is subdivided into categories of
exposure to different classes of pollution levels from a superposition of the mapping of ambient
concentration of particulate matter (average annual PM
10
) with the population distribution map. In
addition, a scenario without road traffic-related emissions is calculated and the exposure under
these theoretic conditions is estimated.
• Epidemiology: Evaluation of the exposure-response function between air pollution and health
impacts: The relationship between air pollution and health has to be assessed. Thereby it has to be
shown, to which extent different levels of air pollution affect a population’s morbidity and
mortality. This evaluation is based on the latest scientific state of the art presented in the
epidemiologic literature and comprehends the results of extensive cohort studies as well as time
series studies.
• Economics: Evaluation of the traffic-related health impacts and their monetarisation: Using
epidemiological data regarding the relation between air pollution and morbidity and premature
mortality, the number of cases of morbidity and/or premature mortality attributed to air pollution
is determined for each of the health outcomes separately, using specific exposure-response
functions. The same operations are carried out for the theoretical situation in which there is no
road traffic-related air pollution. The difference between the results of these two calculations
corresponds to the cases of morbidity and premature mortality due to road traffic-related air
pollution. The morbidity and mortality costs arising from road traffic-related air pollution are then
evaluated for each health outcome separately by multiplication of the number of cases with the
respective cost estimates (willingness-to-pay factors for the reduction of the different health risks).
2
Third WHO Ministerial Conference on Environment and Health, London, 16-18 June 1999.
4
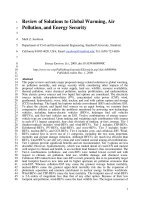
Figure 1. Methodological approach for the evaluation of mortality and morbidity due to road
traffic-related air pollution
Exposure-Response relation-
ship between air pollution and
number of mortality and
morbidity cases
Number of mortality
and morbidity cases
Exposure of the
population
Air pollution map
with traffic
Air pollution map
without traffic
Population map
Difference:
Number of mortality
and morbidity cases
due to road transport
External road traffic-
related health costs
Health costs per case
10 20 30 40 50 60
number of
cases
PM con-
centration
in g/m
10
µ
3
10 20 30 40 50 60
number of
cases
PM con-
centration
in g/m
10
µ
3
5
Throughout the entire project many assumptions and methodological decisions had to be made along
the various calculation steps in the domains of air pollution, epidemiology and economics. On each
level, the method of dealing with uncertainty had to be defined. The research group decided that the
main calculation ought to apply an “at least” approach, thus consistently selecting methodological
assumptions in a way to get a result which may be expected to be “at least” attributable to air
pollution. Accordingly, the overall impact of air pollution is expected to be greater than the final
estimates. To unambiguously communicate the uncertainty in the common methodological framework,
the final results will be reported as a range of impacts rather than as an exact point estimate.
2. Epidemiology - the air pollution attributable health effects
In the last 10-20 years epidemiology has dealt extensively with the effect of outdoor air pollution on
human health. A considerable number of case studies in different countries and under different
exposure situations have confirmed that air pollution is one of various risk-factors for morbidity and
mortality.
In general, air pollution is a mixture of many substances (particulates, nitrogen oxides, sulfur
dioxides). Knowing that several indicators of exposure (eg. NO
2
, CO, PM
10
, TSP etc.) are often highly
correlated, it is not accurate to establish the health impact by a pollutant-by-pollutant assessment,
because this would lead to a grossly overestimation of the health impact. The objective is therefore to
cover as best as possible the complex mixture of air pollution with one key indicator. Based on various
epidemiological studies, in the present study PM
10
(particulate matter with an aerodynamic diameter of
less than 10 µm) is considered to be a useful indicator for measuring the impact of several sources of
outdoor air pollution on human health. The derivation of air pollution attributable cases has been
described in a separate publication.
3
Thus, the key features of the epidemiology based assessment are
only summarized.
For the assessment of the health costs it was not possible to consider all health outcomes found to be
associated with air pollution. Only those meeting the following three criteria were considered:
− there is epidemiological evidence that the selected health outcomes are linked to air
pollution;
− the selected health outcomes are sufficiently different from each other so as to avoid
double counting of the resulting health costs (separate ICD
4
codes);
− the selected health outcomes can be expressed in financial terms.
3
Künzli N. et al (2000), Public Health Impact of Outdoor and Traffic-related Air Pollution: A
Tri-national European Assessment, in press.
4
ICD: International Classification of Diseases.
6
According to these selection criteria seven health outcomes were considered in this study (see
Table 2).
Table 2. Air pollution related health outcomes considered
Health outcome Age
Total mortality
Adults, ≥ 30 years of age
Respiratory hospital admissions All ages
Cardiovascular hospital admissions All ages
Acute bronchitis Children, < 15 years of age
Restricted activity days
Adults, ≥ 30 years of age
Asthmatics: asthma attacks
Children, < 15 years of age;
Adults, ≥ 15 years of age
The relation between exposure to air pollution and the frequency of health outcome is presented in
Figure 3 by graphical means. The number of mortality and morbidity cases due to air pollution can be
determined if the profile of the curve (exposure-response function) and its position (health outcome
frequency) are known. These two parameters were determined for each health outcome, separately.
Figure 3. Relation between air pollution exposure and cases of disease
Number
of cases
pollutant load
(
µ
g/m
3
)
∆
"without" with
Air Pollution (PM10)
Epidemiology based
exposure-response function
attributed
number of cases
7
The exposure-response function (quantitative variation of a health outcome per unit of pollutant
load) was derived by a meta-analytical assessment of various (international) studies selected from the
peer-reviewed epidemiological literature. The effect estimate (gradient) was calculated as the variance
weighted average across the results of all studies included in the meta-analysis.
In this project, the impact of air pollution on mortality is based on the long-term effect. This approach
is chosen because the impact of air pollution is a combination of acute short-term as well as
cumulative long-term effects. For example, lifetime air pollution exposure may lead to recurrent injury
and, in the long term, cause chronic morbidity and, as a consequence, reduce life expectancy. In these
cases, the occurrence of death may not be associated with the air pollution exposure on a particular
day (short-term effect) but rather with the course of the chronic morbidity, leading to shortening in
life.
Accordingly, for the purpose of impact assessment, it was decided not to use response functions from
daily mortality time-series studies to estimate the excess annual mortality but the change in the
long-term mortality rates associated with ambient air pollution.
5
Contrary to the exposure function which is assumed to be the same for all countries, the health
outcome frequency (frequency with which a health outcome appears in the population for a defined
time span) may differ across countries. These differences may result from a different age structure or
from other factors (i.e. drinking and eating habits, different health care systems in the three countries,
etc.). Therefore national or European data were used whenever possible to establish the countries’
specific health outcome frequency.
For each health outcome included in the trinational study, Table 4 presents the effect estimates in
terms of relative risks (column 2) and separately for each country the health outcome frequency
(column 3-5), and the attributable number of cases for 10 µg/m
3
PM
10
increment.
Reading example:
The relative risk of long-term mortality for a 10 µg/m
3
PM
10
increment is 1.043 (column 2), therefore
the number of premature fatalities increases by 4.3% for every 10 µg/m
3
PM
10
increment. Column 5
shows the number of deaths (adults ≥ 30 years) per 1 million inhabitants in Switzerland (8’260). With
an average PM
10
concentration of 7.5 µg/m3 a baseline frequency of 7’794 deaths would be expected.
This proportion depends on the age structure of the population ≥ 30 years and therefore is different for
each country.
The absolute number of fatalities (340 cases for Switzerland, column 8) per 10 µg/m
3
PM
10
increment
and per 1 million inhabitants corresponds to the 4.3% increase in mortality (column 2) applied to the
baseline frequency of 7’794 deaths.
5
Künzli N. et al (2000), Public Health Impact of Outdoor and Traffic-related Air Pollution: A
Tri-national European Assessment, in press.
8
Table 4. Additional cases per 1 million inhabitants and 10 µg/m
3
PM
10
increment
6
Effect estimate Observed population frequency, P
e
Fixed baseline increment per
relative risk Per 1 million inhabitants and per annum 10
µ
g/m
3
PM
10
and 1 million inhabitants
(±95%confidence (±95% confidence interval)
interval) Austria France Switzerland Austria France Switzerland
Long-term mortality (adults
≥
30 1.043 9'330 8'390 8'260 370 340 340
years; excluding violent death)
(1.026-1.061) (230-520) (210-480) (200-470)
Respiratory hospital admis- 1.0131 17'830 11'550 10'300 230 150 130
sions (all ages)
(1.001-1.025) (20-430) (20-280) (10-250)
Cardiovascular hospital ad- 1.0125 36'790 17'270 24'640 450 210 300
missions (all ages)
(1.007-1.019) (230-670) (110-320) (160-450)
Chronic bronchitis incidence 1.098 4'990 4'660 5'010 410 390 430
(adults
≥
25 years)
(1.009-1.194) (40-820) (40-780) (40-860)
Bronchitis (children < 15 1.306 16'370 23'530 21'550 3'200 4'830 4'620
years)
(1.135-1.502) (1’410-5’770) (2’130-8’730) (2’040-8’350)
Restricted activity days 1.094 2'597'300 3'221'200 3'373'000 208'400 263'700 281'000
(adults
≥
20 years)
a
(1.079-1.109) (175’400-241’800) (222’000-306’000) (236’500-326’000)
Asthmatics: asthma attacks 1.044 56'700 62'800 57'500 2'330 2'600 2'400
(children < 15 years)
b
(1.027-1.062) (1’430-3’230) (1’600-3’620) (1’480-3’340)
Asthmatics: asthma attacks 1.039 173'400 169'500 172'900 6'280 6'190 6'370
(adults
≥
15 years)
b
(1.019-1.059) (3’060-9’560) (3’020-9’430) (3’100-9’700)
a: Restricted activity days: total person-days per year
b: Asthma attacks: total person-days per year with asthma attacks
P : Frequency as observed at the current level of air pollution
6
Table printed with permission from Lancet, Künzli N. et al (2000), Public Health Impact of Outdoor
and Traffic-related Air Pollution: A Tri-national European Assessment, in press.
9
3. Air Pollution - the PM
10
population exposure
In addition to the epidemiological data need, information on the population’s exposure to PM
10
is a
further key element for the assessment of air pollution-related health effects. Information about the
sources and the spatial distribution of PM
10
is still sparse in Austria, France and Switzerland as it is in
many other European countries. Therefore it was necessary to calculate the spatial distribution of PM
10
by using empirical dispersion models or statistical methods. The general methodological framework
for the air pollution assessment consisted of four main steps:
• acquisition and analysis of the available data on ambient concentration of particulate matter (Black
Smoke BS, Total Suspended Particulate TSP and PM
10
) for model comparison or correlation
analysis between different particle measurement methods
− PM
10
mapping by spatial interpolation with statistical methods or empirical dispersion
modelling;
− estimation of the road traffic-related part of PM
10
(based on emission inventories for
primary particles and for the precursors of secondary particles);
− estimation of the population exposure from a superposition of the PM
10
map on the
population distribution map.
The differences between the countries concerning the procedures for measuring ambient particulate
matter and the availability of emission data led to an adaptation of the general framework to the
individual country specific case.
In Austria, particulate matter is measured in agreement with national legislation as Total Suspended
Particulate (TSP) at more than 110 sites, whereas PM
10
measurements are not yet available. It was
assumed that ambient air TSP levels can be attributed to the contribution of local sources and regional
background concentrations. Both of them were modelled separately. The starting point for the
modelling of local contributions was the availability of a spatially disaggregated emission inventory
for nitrogen oxides (NO
x
). An empirical dispersion model was established for NO
x
whose results could
be compared with an extended network of NO
x
monitors. The spatial distribution of NO
x
was
converted into TSP concentrations, using source specific TSP/NO
x
conversion factors. The regional
background TSP levels were estimated from measurements and superimposed on the contributions
from local sources. These results were compared to measured TSP data. Finally, PM
10
concentrations
were derived from TSP values by applying source specific TSP/PM
10
conversion factors. The model is
able to provide an estimate of the traffic-related part of PM
10
concentration.
10
The French work was based on the available Black Smoke (BS) data. A correlation analysis between
BS and PM
10
(TEOM method
7
) was first carried out. It was found that at urban background sites, BS
and PM
10
(TEOM) are about equal. Following this, linear relationships were sought between the BS
data and land use categories in the areas surrounding the measurement sites. Multiple regression
analysis was performed for three categories of sites: urban, suburban and rural. Based on these
regressions and using the land use data set, a PM
10
map was established. A correction factor for
secondary particles was defined using the European scale EMEP
8
model. This was necessary because
BS and TEOM considerably underestimate the amount of secondary particles in PM
10
. The percentage
of PM
10
caused by road traffic was determined in each grid cell using results from the Swiss PM
10
model.
The Swiss work was based on a provisional national PM
10
emission inventory. It was first
disaggregated to a km
2
grid. Dispersion functions for primary PM
10
emission were defined in an
empirical dispersion model which was used to calculate the concentration of primary PM
10
. The
contribution of secondary particles was modelled by using simple relationships between precursor and
particle concentration. The long-range transported fraction was taken from European scale models.
The PM
10
fractions were then summed to create the PM
10
map. The traffic related part was modelled
separately, using both the road-traffic related portion of PM
10
emission and the respective portion of
the precursor emission for secondary particles.
The determination of the regional PM
10
background was critical to the PM
10
mapping procedures.
The estimates of all three countries are in line with measured and modelled data from EMEP. The
large-scale transported fraction of PM
10
is considerable. At rural sites, over 50 % of PM
10
may
originate from large-scale transport. Furthermore, the contribution of traffic to PM
10
background
concentration is substantial and it may vary in space.
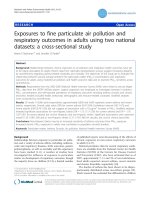
The population exposure to total PM
10
is presented in Figure 5. Around 50% of the population live
in areas with PM
10
values between 20 and 30 µg/m
3
(annual mean). About one third is living in areas
with values below 20 µg/m
3
. The rest is exposed to PM
10
concentrations above 30 µg/m
3
. The high
concentrations are found exclusively in large agglomerations.
7
TEOM: Tapered element oscillating microbalance. Method for measuring continuously particle
concentration.
8
EMEP: Co-operative Programme for the Monitoring and Evaluation of Long-Range Air Pollutants in
Europe.
11
Figure 5. Frequency distribution of total PM
10
population exposure
(with share attributable to road traffic)
9
0%
10%
20%
30%
40%
50%
60%
0 - 5 5 - 10 10 - 15 15 - 20 20 - 25 25 - 30 30 - 35 35 - 40 40 - 45 45 -50 > 50
PM10 concentration (
µ
g/m
3
, annual mean)
Population %
Austria France Sw itzerland
Figure 6. Frequency distribution of PM
10
population exposure without share attributable to
road traffic
10
0%
10%
20%
30%
40%
50%
60%
0 - 5 5 - 10 10 - 15 15 - 20 20 - 25 25 - 30 30 - 35 35 - 40 40 - 45 45 -50 > 50
PM10 concentration (
µ
g/m
3
, annual mean)
Population %
Austria France Sw itzerland
9
Filliger P., Puybonnieux-Texier V., Schneider J. (1999), Health Costs due to Road Traffic-related Air
Pollution, PM
10
Population Exposure, p. 10.
10
Filliger P., Puybonnieux-Texier V., Schneider J. (1999), Health Costs due to Road Traffic-related Air
Pollution, PM
10
Population Exposure, p. 10.
12
The population exposure without PM
10
fraction attributable to road traffic is shown in Figure 6.
Compared to total PM
10
, the frequency distribution changes considerably. Most people would live in
areas with PM
10
values less than 20 µg/m
3
. In France and Switzerland, less than 3% of the population
would live in areas with PM
10
greater than 20 µg/m
3
. In Austria, this portion is higher due to an
increased non-traffic caused regional PM
10
background. However, in all three countries, the reduction
of the percent values in higher PM
10
concentration classes is substantial and indicates that road traffic
contributes considerably to these PM
10
concentration classes.
Population weighted PM
10
averages are summarised in Table 7. Interpreting the figures one has to
be aware of the fact that PM
10
due to road traffic varies considerably spatially. In city centres, the
relative contribution of road traffic to total PM
10
is higher than in rural areas. Typical values, derived
from the Swiss model are: 40 - 60% in cities and < 30% in rural areas.
Table 7. Population weighted annual PM
10
averages for the three countries (calculated from the
original grid values of the PM
10
maps)
11
PM10 concentration in µg/m
3
(annual mean)
Austria France Switzerland
Total PM
10
26.0 23.5 21.4
PM10 without fraction attributable to road
traffic
18.0 14.6 14.0
PM10 due to road traffic 8.0 8.9 7.4
Despite the different methods used, the results of the three countries are similar, especially
concerning PM
10
levels caused by road traffic. The differences in total PM
10
can be explained by the
fact that (a) the background concentration is higher in Central and Eastern Europe than in the Western
parts of Europe and (b) for Switzerland, large areas at higher altitudes have significantly lower PM
10
levels. Furthermore, the sulphate fraction of the background concentration may increase from Western
to Eastern Europe, resulting in an increase of the non-traffic related PM
10
fraction. However, further
investigations including measurements of PM
10
as well as PM
10
components are needed to explore in
detail the significance of the differences found.
4. The monetary valuation of air pollution related health effects
Monetarising health effects or even fatalities is often criticised outside the community of economic
science. In the general public’s opinion it is argued, that human life cannot be expressed in monetary
terms. This criticism is based on a misunderstanding as the economic science does not try to assess the
value of a specific life. What is being measured is the benefit of a risk reduction due to a lower level of
air pollution leading to a decrease in frequency of the different health outcomes.
11
Filliger P., Puybonnieux-Texier V., Schneider J. (1999) Health Costs due to Road Traffic-related Air
Pollution, PM
10
Population Exposure, p. 11.
13
For this type of assessment, the term „value of preventing a statistical fatality” (VPF) is often used in
economic theory. It reflects the fact that a decrease in risk is valued before the negative results have
already taken place. Hence, it dos not value „ex post” a specific human being’s life lost due to an air
pollution related disease.
4.1 Monetary Evaluation of Mortality
There are two main different approaches to asses the monetary value of mortality
12
:
− The gross production / consumption loss: The costs of additional mortality cases are
assessed according to the loss in income / production or the loss of consumption. This
valuation concept - sometimes refered as discounted future earnings - is based on the loss
resulting from a premature death for the economy as a whole. It is a concept based on the
general society, without regarding the individual difference in valuing lower or higher
risks of mortality or fatal accidents. The measurement is limited to material aspects of
life only, it neglects the intangible costs such as pain, grief and suffering of the victims
and their relatives. The main advantage of this approach lies in its simple and
transparent calculation concept. Therefore it may be a suitable input for political
discussions on policy measures for a reduction of air pollution or other environmental
impacts.
However, the main disadvantages are the following:
− The individual aversion against premature death is not considered in this approach, since
it only covers material consequences of a fatality.
− Based on the loss for the society as a whole, the concept is in conflict with a basic
principle of (welfare-) economic theory according to which each valuation has to be
based on the variations in the utility of the concerned individuals.
− An appropriate discount rate has to be chosen which has major implications for the
valuation.
12
For a detailed discussion see: Sommer H., Seethaler R., Chanel O., Herry M., Masson S., Vergnaud
J Ch. (1999), Health Costs due to Road Traffic-related Air Pollution, p. 22-26.
14
− Willingness to pay (WTP) / Value of preventing a statistical fatality (VPF): This
approach attempts to estimate the demand (the willingness-to-pay) for an improved
environmental quality. The central question is, how much individuals are ready to pay to
improve their own security or the security of other people. Thus, the sum of individual
willingness-to-pay indicates how much value is attributed to an improvement in security
or a reduction of environmental impact by the society as a whole. The valuation of a risk
reduction in mortality or the value of preventing a “statistical” fatality is calculated by
dividing the individual willingness-to-pay values for a risk reduction by the observed
change in risk.
13
The main advantage of the willingness-to-pay approach lies in evaluating the individual preferences
for risk reductions of morbidity and premature fatalities. It therefore meets the requirements of welfare
economics, since it reflects the individual point of view.
However, a number of arguments against this method are often raised:
− The willingness-to-pay approach depends on the level of income which may pose ethical
problems when applied to very different countries (OECD vs. less developed countries).
− If part of income losses are borne by the social insurance system of the country, this loss
will not be considered by the individual, although it is part of the society’s costs.
− It is often difficult for the individual to be sufficiently aware of the risk level at stake and
the consequences on health. Individuals may not be familiar with small variations in risk
which may imply large discrepancies between individual valuations.
− The main difficulty of the WTP approach lies in obtaining reliable and correct empirical
estimations, because results are highly sensitive to the survey design.
Nevertheless, recent research provides promising results. The chosen WTP values for the present
study are based on a contingent valuation method, in which the direct comparison between money and
risk of mortality is replaced by a sequence of chained interviews.
14
Based on this discussion the Willingness-to-pay (WTP) for the Value of a Prevented Fatality (VPF)
was used as common methodological approach.
15
Unfortunately, so far no empirical studies have been carried out specifically for air pollution related
mortality risk. Furthermore, under the prevailing budget and time constraint it was out of scope to
conduct an empirical survey within this project. Therefore, empirical results of road accident related
WTP were used as a starting point.
13
Example: A policy measure is able to reduce the yearly risk of fatal road accidents from 4 cases per
10’000 to 3 cases per 10’000. For this risk reduction of 1 case per 10’000, the affected individuals are
ready to pay an average amount of 100 US $. In this case, the value of a statistical prevented fatality
amounts to 1 million US $ (100 US $ /0.0001 risk reduction). Again, it needs to be recognised that the
respondents are not asked about their willingness-to-pay for the avoidance of their own death but
about the willingness-to-pay for a change in risk.
14
See Sommer H., Seethaler R., Chanel O., Herry M., Massons S., Vergnaud J Ch. (1999), Health
Costs due to Road Traffic-related Air Pollution, Annex 7 p. 77-83.
15
According to the country specific needs, in addition to the WTP-approach an alternative partial
assessment approach was conducted, based on the loss of production or consumption (see
chapter 5.3).
15
The most recent studies from the 1990’s indicate a range of WTP values for the prevention of a
statistical fatality of 0.7 to 6.1 million EUR.
16
The latest empirical study, conducted by Jones-Lee
et al.
17
provides a VPF of 1.42 million EUR (range: 0.7-2.3 million EUR).
Based on these most recent results and the experience of former studies a starting value of
1.4 million EUR is adopted for the value of preventing a statistical fatality. This choice is supported
by the use of a similar starting value (1.2 million EUR) in a recent study on behalf of the UK
Department for Environment, Transport and Regions (DETR) and the fact that it lies in the lower part
of the range of the majority of recent empirical evaluations.
18
This choice is in line with the “at least”
approach prevailing throughout the entire project.
Road accident related fatal risk differs from air pollution related risk. The latter is to a large extent
involuntary and beyond the responsibility and control of those exposed to it. In addition, while taking
the risk of a traffic accident, driving itself offers a direct personal benefit. On the other hand, air
pollution related risk is less often connected to a direct personal benefit, although it is to some extent
transport induced. Because of this different risk context, air pollution related risk aversion is likely to
be higher than for fatal road accidents.
19
The impact of the contextual difference between road
accident and air pollution related risk on individual aversion is subject of several empirical studies and
has produced factors in the range of 1.5 to 2. However, the empirical evidence is not considered to be
sufficient and following the “at least” approach, the contextual adaptation of the WTP value is
abandoned in the present study.
Based on the available epidemiological literature, a direct conclusion about the age structure of the air
pollution related premature deaths is not yet possible. It is, however, known that these fatalities are
mostly related to respiratory and cardiovascular diseases and lung cancer. In Austria, France and
Switzerland, the average age of these respiratory and cardiovascular fatalities lies between 75 and
85 years (see Figure 8).
16
Viscusi W.K. (1993, The Value of Risks to Life and Health; Beattie J. et al (1998), Valuing Health
and Safety Controls: A Literature Review; Institute of Environmental Studies, Norwegian Institute for
Air Research, International Institute for Applied System Research (1997), Economic Evaluation of
quality targets for sulphur dioxide, nitrogen dioxide, fine and suspended particulate matter and lead;
ZEW / ISI (1997), External Quality Evaluation; ExternE (1995), Externalities of Energie, Vol 2:
Methodology.
17
Jones-Lee M. et al (1998), On the Contingent Valuation of Safety and the Safety of Contingent
Valuation: Part 2 - The CV/SG “Chained” Approach; Chilton S., Covey J., Lorraine H., Jones-Lee M.,
Loomes G., Pidgeon N., Spencer A. (1998), New Research Results on the Valuation of Preventing
Fatal Road accident Casualties.
18
For example, the ExternE-Project, a very extensive project on behalf of the European Community on
the external costs of energy use, is based on a meta-analytical value of 2.6 million Euro with a range
from 2.1 to 3.0 million Euro. See: ExternE (1995), Externalities of Energy, Vol. 2: Methodology.
19
This view is adopted by a number of authors. See: Jones-Lee et al (1998), On the Contingent
Valuation of Safety and the Safety of Contingent Valuation: Part 1 - Caveat Investigater and
Department of Health (1999), Economic Appraisal of the Health Effects of Air Pollution, p. 63-66.
16
Figure 8. Age structure of fatalities due to respiratory, cardiovascular diseases and lung cancer
in Austria
20
, France and Switzerland (1996)
0%
5%
10%
15%
20%
25%
30%
35%
40%
45%
< 1
1 - 4
5 - 9
10 - 14
15 - 19
20 - 24
25 - 29
30 - 34
35 - 39
40 - 44
45 - 49
50 - 54
55 - 59
60 - 64
65 - 69
70 - 74
75 - 79
80 - 84
85 +
A
F
CH
Number of
fatalities in %
Hence, the average age of the air pollution related fatalities is much higher than for victims of fatal
road accidents (30-40 years of age).
Theoretical as well as empirical evidence indicates a decreasing WTP with increasing age, with
reduced remaining life expectancy and with reduced quality of life. For the present study, the
relationship adopted is provided by the latest research of Jones-Lee.
21
Weighting the age structure of
the fatalities due to respiratory and cardiovascular disease and lung cancer in all three countries by the
age factor, an average adaptation factor of 61% is obtained for the present willingness-to-pay for a
prevented fatality value.
Based on the preceding discussion we used a value of 0.9 Mio. EUR (=61% x 1.4 Mio. EUR) for the
value of preventing a statistical fatality. Hence, the cost reducing adjustment for age is maintained,
meanwhile the cost increasing adjustment for the risk context is abandoned. This implies a very strict
application of the “at least” approach.
20
Only respiratory and cardiovascular diseases without lung cancer.
21
Several studies by Jones-Lee show a reversed U-shaped relationship between the age and the
willingness-to-pay. See: Department of Health (1999), Economic Appraisal of the Health Effects of
Air Pollution, p. 67 and direct information of M. Jones-Lee (1998).
17
4.2 Monetary valuation of morbidity
From an economic point of view, the costs of morbidity may be subdivided by two main criteria,
namely by the cost component and by the entity in charge of paying them. As shown in Figure 9, the
costs of illness, the costs of averting behaviour and the intangible costs are three different components.
They are either borne privately or in the case of cost of illness and costs of averting behaviour
collectively as well.
Figure 9. Overview on the costs of morbidity
Treatment costs
collectively borne
Treatment costs
indvidually borne
Loss of production
collectively borne
Loss of production
individually borne
Avertive expenditures
collectively borne
Avertive expenditures
individually borne
Intangible Costs
Disutility associated w ith
morbidity individually borne
Costs of illness
Costs of averting-
behaviour
Social Costs
(individually and collectively borne)
Private Costs (= individual WTP)
Market Prices available
Market Prices not available
Costs of illness (COI) contain the loss of production due to a possible incapacity to work and the
medical treatment costs. They determine the “material part” of the health costs and may be assessed on
the basis of real market prices (loss of earnings, costs for medicaments, costs per day in hospital, etc.).
Costs of averting-behaviour result from changes in behaviour due to air pollution. The abstention
from outdoor sport activities during a summer day with high ozone concentration, the installation of
air filters or a different choice of residential location to avoid high levels of air pollution are some
current examples. The higher the costs of avoidance measures, the smaller will probably be the
number of air pollution related morbidity cases. Considering the extent of avoidance measures taken
so far, neglecting the costs of averting-behaviour may result in a considerable underestimation of the
morbidity costs. However, for the assessment of these costs market prices are mostly non-existent.
The third essential component of morbidity costs are the intangible costs reflecting the individual loss
of the victims utility and consisting of pain, grief and suffering due to a disease. Based on empirical
evidence, the risk aversion of morbidity is mainly determined by these inconveniences (losses in
utility).
18
In order to draw a complete picture of the total morbidity costs, individually borne private costs and
the costs borne collectively, e.g. by a social security system, have to be considered. All components
together constitute the social costs of morbidity.
Similar to the methodological possibilities for the monetary valuation of mortality, the morbidity may
be assessed with different methodological approaches. For the costs of illness (COI) containing the
production loss and medical treatment costs, the damage cost approach is used. Based on market
prices, it assesses all individually as well as collectively borne material costs. However, for the costs
of averting-behaviour and the intangible costs, this approach is not suitable, since market prices are
mostly non-existent.
The willingness-to-pay approach focuses on the individually borne costs (private costs). It establishes
the individuals utility of a risk reduction in air pollution related morbidity and reflects all costs the
individual expects to bear in case of a disease, such as loss of earnings, costs of averting behaviour or
intangible costs.
As mentioned above, the advantage of the willingness-to-pay approach consists of its integration of
material and intangible costs, that cannot be measured by any other method but are often considerably
higher than material costs. However, the disadvantage is its limitation to individually borne costs,
especially when a large part of health costs is borne by collective means.
In spite of this limitation the willingness-to-pay approach is considered to be a better approximation of
social costs of morbidity than the COI approach. Therefore we used the WTP-approach as the main
common methodological framework to assess the morbidity costs.
Unfortunately, the literature on WTP based, air pollution related, morbidity costs is very rare in
Europe and most available studies refer to the US context. Their application to Europe is not
completely unproblematic, since a recent research study provide lower results for a European
country.
22
The different socio-cultural background and the difference in health care and insurance
systems ask for an application of country specific WTP results. In spite of this problem, the present
study had to be based on existing values since the available resources did not allow for an empirical
survey within this project.
Table 10 presents the WTP for avoiding different air pollution related health outcomes.
22
Navrud S. (1998), Valuing Health Impacts from Air Pollution in Europe - New Empirical Evidence on
Morbidity.
19
Table 10. TP for the avoidance of air pollution related health outcomes
Health indicator WTP-Value (EUR)
Respiratory Hospital Admission 7’870
per admission
23
Cardiovascular Hospital Admission 7’870
per admission
23
Chronic Bronchitis 209’000
per case
24
Bronchitis 131
per case
25
Restricted Activity Day 94
per day
25
Asthmatics: Asthma Attacks (person day) 31
per attack
26
5. Results
5.1 Quantitative results of PM
10
related health effects
From the epidemiological data (fixed base line increment per 10 µg/m
3
PM
10
per 1 million inhabitant)
on the one hand and the average exposure level of the population on the other hand, the number of
health outcomes can be determined.
These calculations may be done for the current exposure to particulate matter as well as for a
hypothetical situation without road traffic-related air pollution. The difference between the two results
corresponds to the number of morbidity and mortality cases attributable to road traffic-related air
pollution.
In Table 11 for Austria, France and Switzerland, the health effects considered are presented for the
average annual exposure to total air pollution and for the average annual exposure to road
traffic-related air pollution. According to the epidemiological foundations, for each health outcome the
respective age group is considered. Knowing the distribution of the different population groups across
exposure classes (chapter 3) and the parameters of the exposure-response function (chapter 2), the
absolute number of health outcomes may be established for each country with or without the road
traffic-related share of air pollution.
23
Based on ExternE (1995), Externalities of Energy, Volume 2, Methodology, Part II: Economic
Valuation, p. 519, adjusted for inflation according to Nilsson M., Gullberg M. (1998), Externalities of
Energy, Swedish Implementation of the ExternE Methodolgy.
24
Chestnut L.G. (1995), Human health benefits from sulfate reductions under Title IV of the 1990 clean
air act amendments, p. 5-20, WTP for an average chronic bronchitis case.
25
Maddison D. (1997), Valuing the morbidity effects of air pollution, p. 8.
26
Ostro B., Chestnut L. (1997), Assessing the Health Benefits of Reducing Particulate Matter Air
Pollution in The United States, p. 100.
20
It needs to be emphasized that the health effects are only considered from the exposure class of
5-10 µg/m
3
PM
10
onwards (average 7.5 µg/m
3
PM
10
). This restriction reflects the fact that
epidemiological studies have not yet included the exposure-response relationship below this level. In
addition, it needs to be considered that there is a natural background concentration level which is not
man made. For Austria, France and Switzerland this natural baseline pollutant level is estimated to be
<7.5 µg/m
3
PM
10
. For the further assessment of air pollution measures it is adequate to only consider
the air pollution of human activities.
In Table 11, the negative effects of air pollution are divided into the number of health outcomes
related to total air pollution and those related to the road traffic share only.
5.1.1 Mortality
In 1996, air pollution caused 5’600 cases of premature death in Austria, 31’700 cases in France and
3’300 cases in Switzerland. In Austria 2’400, in France 17’600 and in Switzerland 1’800 cases are
attributable to road traffic-related air pollution.
According to the epidemiological foundations, the increase in premature mortality is only considered
for adults ≥30 years of age and for the exposure class of 5-10 µg/m
3
PM
10
(class mean 7.5 µg/m
3
)
onwards.
21
Table 11. Additional cases of mortality and morbidity due to air pollution in Austria, France
and Switzerland
27
Health outcome
Long-term mortality (adults
≥
30
5’600 31’700 3’300 2’400 17’600 1’800
years; excluding violent death)
3’400 - 7’800 19’200 - 44’400 2’000 - 4’700 1’500 - 3’400 10’700 - 24’700 1’100 - 2’500
Respiratory hospital
3’400 13’800 1’300 1’500 7’700 700
admissions (all ages)
400 - 6’500 1’400 - 26’300 140 - 2’500 160 - 2’800 800 - 14’600 70 - 1’300
Cardiovascular hospital
6’700 19’800 3’000 2’900 11’000 1’600
admissions (all ages)
3’500 - 10’000 10’400 - 29’400 1’500 - 4’400 1’500 - 4’300 5’800 - 16’300 800 - 2’400
Chronic bronchitis incidence
6’200 36’700 4’200 2’700 20’400 2’300
(adults
≥
25 years)
600 - 12’000 3’300 - 73’100 370 - 8’400 240 - 5’300 1’800 - 40’700 200 - 4’500
Bronchitis
48’000 450’000 45’000 21’000 250’000 24’000
(children < 15 years)
21’000 - 86’000 198’500 - 813’600 20’000 - 82’000 9’000 - 37’000 110’000 - 453’000 11’000 - 44’000
Restricted activity days
3’100’000 24’600’000 2’800’000 1’300’000 13’700’000 1’500’000
(adults
≥
20 years)
2’600’000 - 3’600’000 20’700’000 - 28’500’000 2’400’000 - 3’200’000 1’100’000 - 1’600’000 11’500’000 - 15’900’000 1’200’000 - 1’700’000
Asthmatics: asthma attacks
35’000 243’000 24’000 15’000 135’000 13’000
(children < 15 years, person days)
21’000 - 48’000 149’000 - 337’000 15’000 - 33’000 9’000 - 21’000 83’000 - 188’000 8’000 - 17’000
Asthmatics: asthma attacks
94’000 577’000 63’000 40’000 321’000 33’000
(adults
≥
15 years, person days)
46’000 - 143’000 281’000 - 879’000 30’000 - 95’000 20’000 - 62’000 155’000 - 489’000 16’000 - 51’000
Austria France Switzerland
Cases or days attributable to
total air pollution
Austria France Switzerland
Cases or days attributable to
road traffic
27
Table printed with permission from Lancet, Künzli N. et al (2000), Public Health Impact of Outdoor
and Traffic-related Air Pollution: A Tri-national European Assessment, in press.
22
5.1.2 Morbidity
Within the additional morbidity cases, the highest incidence in all three countries is registered for
acute bronchitis in children younger than 15 years. Some 21’000 cases in Austria, some 250’000
cases in France and some 24’000 cases in Switzerland were attributable to road traffic-related air
pollution in 1996.
The second highest frequency is obtained for the incidence of chronic bronchitis in adults. In 1996,
the number attributable to road traffic-related air pollution amounts to ca 2’700 cases in Austria,
20’400 cases in France and 2’200 cases in Switzerland.
The additional cases of cardiovascular hospital admissions (all ages) due to road traffic-related air
pollution amount to 2’900 cases in Austria, 11’000 cases in France and 1’600 cases in Switzerland.
The smallest number of road traffic attributable cases is obtained for respiratory hospital admissions
(all ages). In 1996, it amounts to ca 1’500 cases in Austria, 7’700 cases in France and 700 cases in
Switzerland.
Concerning the additional days of air pollution related morbidity, a very large number of restricted
activity days for adults (≥ 20 years) results in all three countries. In 1996, in Austria, 1.3 million days,
in France 13.7 million days and in Switzerland 1.5 million days with restricted activity are attributed
due to road-traffic-related air pollution.
In 1996, for Austria 15’000 asthma attacks in children (<15 years) and 40’000 asthma attacks in
adults (≥ 15 years) are attributable to road traffic-related air pollution. France and Switzerland
attributed 135’000 and 13’000 asthma attacks in children and 321’000 and 33’000 asthma attacks in
adults to road traffic-related air pollution.
5.2 Health costs due to air pollution based on the willingness-to-pay approach
Based on the willingness-to-pay approach, in 1996 the total air pollution in Austria, France and
Switzerland caused a high level of health costs. The total air pollution related health costs across the
three countries amount to 49’700 million EUR (Table 12), of which 26’700 million EUR are
attributable to road traffic-related air pollution.
In Austria (6’700 million EUR) and Switzerland (4’200 million EUR) the total air pollution related
health costs reach a similar level. Due to the much larger population, the French costs amount to
38’800 million EUR.
23
Table 12. Health costs due to road traffic-related air pollution in Austria, France and
Switzerland based on the willingness-to-pay approach (1996)
Costs of mortality 5’000 2’200 28’500 15’900 3’000 1’600
(million EUR)
3’000 - 7’000 1’300 - 3’000 17’300 - 39’900 9’600 - 22’200 1’800 - 4’200 1’000 - 2’200
Costs of morbidity 1’700 700 10’300 5’700 1’200 600
(million EUR)
400 - 3’000 200 - 1’300 2’800 - 18’500 1’500 - 10’300 300 - 2’100 200 - 1’100
Total costs
6’700 2’900 38’800 21’600 4’200 2’200
(million EUR)
3’400 - 10’000 1’500 - 4’300 20’100 - 58’400 11’100 - 32’500 2’100 - 6’300 1’200 - 3’300
Costs of mortality 36’500 19’700
(million EUR)
22’100 - 51’100 11’900 - 27’400
Costs of morbidity 13’200 7’000
(million EUR)
3’500 - 23’600 1’900 - 12’700
Total costs
49’700 26’700
(million EUR)
25’600 - 74’700 13’800 - 40’100
Austria
France
Total costs
with road
traffic share
Costs
attributable
to road
Total costs
with road
traffic share
Costs
attributable
to road
Switzerland
Total costs
with road
traffic share
Costs
attributable
to road
all three countries
Total costs
with road
traffic share
Costs
attributable
to road
In all three countries, road traffic is a main source of air pollution related health costs. The absolute
level of the road traffic-related air pollution amounts to 8.9 µg/m
3
PM
10
in France, 8.0 µg/m
3
in
Austria and of 7.4 µg/m
3
in Switzerland (as population weighted annual averages). It needs to be
remembered that tailpipe exhaust is only responsible for part of the PM
10
concentration. The
considerable proportion of other emissions, such as tyre wear, other abrasion products and road dust
re-suspension are independent of the share of diesel engines.
The lower relative proportion of traffic-related health costs in Austria may be caused by a higher
background of PM
10
in 1996 which may contain a high sulphate amount (especially in Eastern
Austria).
24
Depending on the country, 72% to 75% of the health costs are related to mortality (see Figure 13). The
differences are mainly due to country specific differences in the baseline frequencies of the health
outcomes observed.
Figure 13. Breakdown of air pollution related costs by mortality and morbidity
Austria
Mortality
75%
Morbidity
25%
France
Morbidity
27%
Mortality
73%
Switzerland
Mortality
72%
Morbidity
28%
Comparing the total air pollution related health costs per capita (see Figure 14) the results of the
three countries stay within the same range, although the central estimates indicate differences between
the three countries. The highest per capita costs are shown for Austria.
For the road traffic-related health costs, the per capita results differ much less between the three
countries: The highest value is obtained in France with about 370 EUR per capita, followed by Austria
with about 360 EUR per capita and Switzerland with about 310 EUR per capita.
These differences are mainly due to air pollution levels (average level of population weighted total
PM
10
exposure and the traffic-related share) and the epidemiological results (different national
mortality and morbidity rates in general). However, the results of the three countries stay within the
same range. Therefore, the differences in per capita costs mentioned above should not be
overinterpreted.
25
Figure 14. Air pollution related health costs per capita based on the willingness-to-pay approach
(1996)
0
200
400
600
800
1’000
1’200
1’400
Health costs per capita due to air pollution
Health costs per capita due to road traffic-related air pollution
EUR
Austria
France Switzerland
360
670
370
590
830
310
830 Central estimate
5.3 Partial assessment approach: health costs due to air pollution based on gross production
loss approach / cost of illness (COI)
According to the country specific needs, in addition to the WTP-approach a partial assessment
approach has been used to evaluate the health costs:
− The mortality related health costs are based on the production/consumption loss. The
losses are determined on the potential years of life lost.
− The morbidity related health costs are based on the costs of illness, which consist of the
production loss due to a incapacity of work and the medical treatment costs.
The partial assessment approach is an extreme implementation of the “at least” approach in so far, as it
does not include a major aspect of mortality and morbidity risk related costs, namely the intangible
costs. In addition, for some health outcomes (chronic bronchitis, asthma attacks) only the medical
treatment costs are included, as for the production loss related to these health outcomes, no data is
presently available. In absence of empirical data, for the very great number of restricted activity days
no costs of production loss and medical treatment could be established at all.
The per capita costs of the partial assessment approach are shown in Table 15.