Rapid intercontinental air pollution transport associated with a meteorological bomb docx
Bạn đang xem bản rút gọn của tài liệu. Xem và tải ngay bản đầy đủ của tài liệu tại đây (2.66 MB, 17 trang )
Atmos. Chem. Phys., 3, 969–985, 2003
www.atmos-chem-phys.org/acp/3/969/
Atmospheric
Chemistry
and Physics
Rapid intercontinental air pollution transport associated with a
meteorological bomb
A. Stohl
1
, H. Huntrieser
2
, A. Richter
3
, S. Beirle
4
, O. R. Cooper
5
, S. Eckhardt
1
, C. Forster
1
, P. James
1
, N. Spichtinger
1
,
M. Wenig
6
, T. Wagner
4
, J. P. Burrows
3
, and U. Platt
4
1
Department of Ecology, Technical University of Munich, Germany
2
Institute for Atmospheric Physics, DLR, Oberpfaffenhofen, Germany
3
Institute of Environmental Physics, University of Bremen, Germany
4
Institute of Environmental Physics, Heidelberg University, Germany
5
Cooperative Institute for Research in Environmental Sciences (CIRES), University of Colorado/NOAA Aeronomy
Laboratory, Boulder, USA
6
NASA Goddard Space Flight Center, Code 916, Greenbelt, MD, USA
Received: 19 February 2003 – Published in Atmos. Chem. Phys. Discuss.: 16 April 2003
Revised: 20 June 2003 – Accepted: 8 July 2003 – Published: 9 July 2003
Abstract. Intercontinental transport (ICT) of trace sub-
stances normally occurs on timescales ranging from a few
days to several weeks. In this paper an extraordinary episode
in November 2001 is presented, where pollution transport
across the North Atlantic took only about one day. The trans-
port mechanism, termed here an intercontinental pollution
express highway because of the high wind speeds, was ex-
ceptional, as it involved an explosively generated cyclone,
a so-called meteorological “bomb”. To the authors’ knowl-
edge, this is the first study describing pollution transport in a
bomb. The discovery of this event was based on tracer trans-
port model calculations and satellite measurements of NO
2
,
a species with a relatively short lifetime in the atmosphere,
which could be transported that far only because of the high
wind speeds produced by the bomb. A 15-year transport cli-
matology shows that intercontinental express highways are
about four times more frequent in winter than in summer,
in agreement with bomb climatologies. The climatology
furthermore suggests that intercontinental express highways
may be important for the budget of short-lived substances in
the remote troposphere. For instance, for a substance with a
lifetime of 1 day, express highways may be responsible for
about two thirds of the total ICT. We roughly estimate that
express highways connecting North America with Europe
enhance the average NO
x
mixing ratios over Europe, due to
North American emissions, by about 2–3 pptv in winter.
Correspondence to: A. Stohl
()
1 Introduction
1.1 Meteorological bombs
Cyclones are a key element of the atmospheric circulation in
the midlatitudes (Carlson, 1998). Cyclogenesis, for which a
first conceptual model was presented by the Bergen school
(Bjerknes, 1910), occurs most frequently at the polar front.
The various ascending and descending airstreams typically
associated with these cyclones carry a range of different
chemical signatures (Cooper et al., 2002). The so-called
warm conveyor belt (WCB) – a strongly ascending airstream
ahead of a cyclone’s cold front (Browning et al., 1973) – is an
important mechanism to lift air pollutants emitted at the sur-
face into the upper troposphere, where the faster winds facil-
itate their intercontinental transport (ICT) (Stohl and Trickl,
1999). Thus, cyclones are important not only for the dynam-
ics of the atmosphere, but also for its chemistry.
Some cyclones develop so explosively that they became
known as meteorological “bombs” (Sanders and Gyakum,
1980). The characteristic features of a bomb are a rapid cen-
tral pressure reduction and an attendant increase in intensity.
Since the pioneering study of Sanders and Gyakum (1980),
henceforth referred to as SG1980, explosive cyclogenesis is
defined by a fall of more than 1 hPa/hour × (sin φ/ sin 60),
where φ is latitude, of a cyclone’s minimum sea-level pres-
sure, over a period of at least 24 hours.
Explosive cyclogenesis requires extremely high levels of
baroclinicity near the cyclone track (Ulbrich et al., 2001)
and/or extremely strong release of latent heat (Zhu and
Newell 2000; Wernli et al. 2002). Cold air encircling the
bomb’s center at low altitudes pushes the warmer air up in
a spiral-like way (Lema
ˆ
itre et al., 1999), which sometimes
c
European Geosciences Union 2003
970 A. Stohl et al.: Express highway associated with a bomb
leads to eye-like structures known from tropical cyclones
(SG1980). During their life-cycles, bombs can attain ex-
tremely low core sea-level pressures (SG1980), and, thus,
horizontal pressure gradients – and surface winds – can be
extreme. Their scales range from rather small-scale vortices
that do not change the large-scale circulation significantly
(Ulbrich et al., 2001) to larger-than-normal cyclones (Lim
and Simmonds, 2002).
Bombs are a great danger, especially for shipping. For in-
stance, the Sydney-Hobart yacht race cyclone in December
1998 resulted in the death of six race participants (Buckley
and Leslie, 2000). Like tropical cyclones, bombs weaken
after landfall, but to a much lesser extent. Surface wind
gusts above 50 m s
−1
have been reported over land. Exam-
ples of destructive bombs over Europe are the great storm
of October 1987 over southern England (Burt and Mansfield,
1988) and the Christmas storms of 1999, that claimed 130
lives and caused 13 billion Euros worth of total economic
losses in central Europe (Ulbrich et al., 2001). The danger
of bombs also comes from their explosive development and
their rapid motion, both of which are often not well predicted
by weather forecast models (Sanders et al., 2000).
Explosive cyclogenesis is a phenomenon occurring most
often in winter and almost exclusively over the oceans.
About 50 bombs per year are found on the Northern Hemi-
sphere (Lim and Simmonds, 2002), most of them over the
warm surface waters downstream of Asia and North Amer-
ica (SG1980), regions with frequent and intense WCBs and
corresponding strong latent heat release (Stohl, 2001). There
is a statistically significant upward trend of global bomb oc-
currence during the last two decades, which may be related
to global warming (Lim and Simmonds, 2002).
1.2 Long-range NO
x
transport
ICT of trace substances is a topic that currently receives
much attention, due to its implications both for air qual-
ity and climate. ICT is reasonably well documented (e.g.,
Jaffe et al. 1999; Stohl and Trickl 1999; Forster et al. 2001)
for moderately long-lived species (e.g., carbon monoxide,
ozone, aerosols), but so far has been considered insignificant
for species with lifetimes of hours to a few days. Among
these shorter-lived species, nitrogen oxides (NO
x
) – which
have a lifetime on the order of hours in the atmospheric
boundary layer (ABL) and a few days in the upper tropo-
sphere (Jaegl
´
e et al., 1998) – are of particular interest, be-
cause they are critical for photochemical formation of ozone
(O
3
) in the troposphere (Lin et al., 1988). Below a certain
concentration of nitric oxide (NO), O
3
is destroyed, whereas
above it is formed. Values of this so-called compensation
point vary, but are on the order of 10 to 30 ppt, with lower
values in the upper troposphere (e.g., Reeves et al., 2002).
Aircraft measurements show that NO
x
levels in the remote
free troposphere, particularly in the upper troposphere, of-
ten exceed this threshold (Bradshaw et al., 2000), leading to
substantial in-situ O
3
formation.
Strong filamentation of pollution plumes normally takes
place during ICT. The large surface/volume ratio of filaments
increases the probability of mixing of the polluted air with
the surrounding cleaner airmasses. If this process is fast
enough for NO
x
to be still contained in the plume, the ef-
ficiency of O
3
production (i.e., the number of molecules of
O
3
produced per molecule of NO
x
available) increases (Lin
et al., 1988), because of a higher hydrocarbon/NO
x
ratio in
the mixed airmass (note that sufficiently high levels of hydro-
carbons, e.g., methane, are contained in “background” air).
ICT of NO
x
also can occur in the form of reservoir species
(NO
y
, e.g., peroxy acetyl nitrate), which are products from
NO
x
oxidation, from which NO
x
can be re-cycled at a later
time. This is thought to be important for photochemical
O
3
formation in the background free troposphere (e.g., Wild
et al., 1996). However, even export of NO
y
from the ABL to
the free troposphere is very inefficient (Prados et al., 1999).
Model studies (Liang et al., 1998) suggest that only 15–25%
of the NO
x
emitted at the surface reaches the free tropo-
sphere, and observations show that only about 5-10% of the
originally emitted nitrogen remains in the atmosphere after
a few days (Stohl et al., 2002b). Models and measurements
agree that only a small fraction of the exported nitrogen is in
the form of NO
x
.
Given the inefficient vertical transport of boundary-layer
NO
x
, both aircraft (Ziereis et al., 2000) and, especially, light-
ning (Huntrieser et al. 2002; Jeker et al. 2000) emissions of
NO
x
are thought to play important roles in the free tropo-
sphere. Indeed, large-scale NO
x
plumes have been found in
the upper troposphere over North America (Brunner et al.,
1998), that possibly were produced by lightning.
Satellite data from the Global Ozone Monitoring Experi-
ment (GOME) (Burrows et al., 1999) confirm that, on a cli-
matological basis, NO
x
is highly concentrated in its major
source regions, implying an average NO
x
lifetime in the at-
mosphere of about 1 day (Leue et al., 2001). Nevertheless,
two episodes where GOME showed ICT of NO
x
were re-
cently described. One was due to boreal forest fire emis-
sions, where NO
x
was injected directly into the free tropo-
sphere and subsequently transported rapidly from Canada to
the west coast of Europe (Spichtinger et al., 2001). In the sec-
ond case, NO
x
from power plants in the South African High-
veld, again injecting NO
x
into the free troposphere, were
transported to the Indian Ocean and, presumably, to Australia
(Wenig et al., 2002). Furthermore, lightning NO
x
emissions
also played a role in this case.
In this paper, a third case of NO
x
ICT is reported, that
is, so far, the clearest example of its kind and does neither
involve direct deposition of emissions into the free tropo-
sphere, nor significant lightning emissions. Instead, average
advection speeds above 40 m s
−1
south of a bomb center al-
lowed ICT of NO
x
from anthropogenic surface sources to
occur within less than two days. Furthermore, in order to
Atmos. Chem. Phys., 3, 969–985, 2003 www.atmos-chem-phys.org/acp/3/969/
A. Stohl et al.: Express highway associated with a bomb 971
judge the relevance of events similar to the one observed, a
15-year climatology of fast ICT of anthropogenic emission
tracers is presented.
2 Methods
In November 2001, the first aircraft campaign of the CON-
TRACE (Convective Transport of Trace Gases into the Upper
Troposphere over Europe: Budget and Impact on Chemistry)
project took place in Germany. One aim of this project was to
make measurements in the outflow of polluted North Atlantic
WCBs. Due to successful tracer model forecasts (Lawrence
et al. 2003; Stohl et al. 2003), it was indeed possible to probe
pollution plumes from North America on three occasions, al-
lowing, for the first time, a detailed chemical characterisation
of such plumes over Europe (Huntrieser et al., 2003). Af-
ter the campaign, tropospheric NO
2
columns retrieved from
spectral data of the GOME satellite sensor (Burrows et al.,
1999) were used as supplementary information on the trans-
port of pollution plumes across the Atlantic. Unfortunately,
few GOME data were available during the aircraft campaign,
because the instrument was turned off for protection during
the Leonides meteor shower. However, immediately before
the first measurement flight, an episode of NO
2
transport
from North America to Europe was seen in the GOME data,
that agrees remarkably well with tracer model calculations,
and which is presented in this paper.
2.1 Tropospheric NO
2
columns from GOME
The Global Ozone Monitoring Experiment (GOME) (Bur-
rows et al., 1999) is a UV / visible spectrometer operating
on the ERS-2 satellite since July 1995. GOME observes the
solar radiance scattered in the atmosphere and reflected from
the surface in near nadir viewing geometry. Once per day, it
also takes an irradiance measurement of the sun providing an
absorption free background spectrum. The instrument covers
the spectral range from 240 to 790 nm in 4096 spectral chan-
nels at a resolution of 0.2–0.4 nm. The ERS-2 satellite is in
a sun-synchronous near polar orbit with an equator crossing-
time of 10:30. As a result, measurements at a given latitude
are always at the same local time. The GOME instrument
scans across the track from east to west taking three measure-
ments of 320×40 km
2
through its swath of 960km. With this
scan pattern, global coverage is achieved in three days at the
equator and in one day at 65
◦
.
From the nadir measurements and the irradiance back-
ground, integrated columns can be retrieved for a num-
ber of atmospheric trace species including O
3
, NO
2
, BrO,
SO
2
, HCHO, and H
2
O (Burrows et al., 1999) using the
well known Differential Optical Absorption Spectroscopy
(DOAS) method (Platt, 1994). Briefly, absorbers are iden-
tified by the “fingerprint” of the wavelength dependence of
their absorption structures, and the total amount of the ab-
sorber along the line of sight is determined using Lambert-
Beer’s law. In a second step, this column is converted to a
vertical column using airmass factors (Solomon et al., 1987)
derived with a radiative transport model (Rozanov et al.,
1997). Since, under clear sky conditions, a fraction of the
radiation received by GOME (in particular in the visible part
of the spectrum) is sunlight reflected by the surface, which
travelled through the entire atmosphere, GOME measure-
ments are sensitive to both stratospheric and tropospheric ab-
sorptions. If only the tropospheric column is of interest, the
stratospheric contribution to the signal has to be corrected
for, which in the case of NO
2
is usually done by subtract-
ing measurements taken on the same day at the same lati-
tude over a clean region (Leue et al. 2001; Richter and Bur-
rows 2002; Martin et al. 2002). This approach is based on
the assumptions that a) stratospheric NO
2
does not depend
on longitude, and that b) the reference region has a negligi-
ble tropospheric NO
2
burden. Tropospheric NO
2
columns
from GOME have been validated against independent mea-
surements (Heland et al., 2002), and have been extensively
compared to model results (Velders et al. 2001; Lauer et al.
2002; Martin et al. 2002).
The accuracy of tropospheric NO
2
columns from GOME
is mainly limited by problems associated with cloud con-
tamination, errors introduced by the correction of the strato-
spheric contribution, and uncertainties in the airmass factor
(Richter and Burrows, 2002). In the case study discussed
here, most of the relevant scenes were cloud free (see Fig. 8),
simplifying the data analysis. However, the shape of the ver-
tical distribution of NO
2
has to be taken into account for the
airmass factor calculation. In the standard analysis it is as-
sumed that the bulk of the NO
2
is situated in the ABL. In the
present case, however, NO
2
was transported to the free tropo-
sphere, where the retrieval is more sensitive to NO
2
. There-
fore, the standard airmass factors were used only for the
source regions over the continents, whereas over the ocean
it was assumed that the bulk of the NO
2
was situated be-
tween 3 and 5km, as indicated by the transport model results
presented in section 3. By this approach the NO
2
vertical
columns were reduced by roughly a factor of 2 over the ocean
compared to the standard scientific tropospheric NO
2
GOME
product, upon which the initial discovery of this event was
based. The discovery, thus, did benefit from an overesti-
mate of the NO
2
vertical columns over the ocean in the stan-
dard product, which overemphasized the ICT. However, as
the overall patterns were quite similar in both analyses, only
the results obtained with the modified, more realistic, airmass
factors yielding reduced NO
2
columns are presented here.
Since no correction is applied for thin clouds that may
have been present in the GOME pixels, the amount of NO
2
is
probably underestimated, as detailed in Velders et al. (2001)
and Richter and Burrows (2002). Even a cloud fraction of
10% can lead to an underestimation of up to 100% in the
GOME measurements if the cloud is above the NO
2
layer, or
an overestimation of 50% if it is below the layer. Therefore,
www.atmos-chem-phys.org/acp/3/969/ Atmos. Chem. Phys., 3, 969–985, 2003
972 A. Stohl et al.: Express highway associated with a bomb
GOME pixels with large cloud fractions (>50%) were ex-
cluded from the analysis.
When comparing GOME measurements and model re-
sults, it is also important to keep in mind that GOME can
only observe NO
2
, not NO
x
. Depending on altitude, temper-
ature, albedo and cloud coverage, the NO
2
/ NO
x
ratio varies
significantly in the troposphere, with most of the NO
x
being
in the form of NO
2
close to the surface and the significance
of NO increasing with altitude. Therefore, for a given NO
x
vertical column, the NO
2
column is smaller when the NO
x
is
located at higher altitudes. For the high solar zenith angles
encountered during this study and at temperatures typical for
the mid-troposphere, both NO and NO
2
contribute approxi-
mately 50% of the NO
x
.
2.2 Model simulations
To simulate the transport, the Lagrangian particle dispersion
model FLEXPART (version 4.4) (Stohl et al. 1998; Stohl
and Thomson 1999; />LST/METEO/stohl/) was used. FLEXPART was validated
with data from three large-scale tracer experiments in North
America and Europe (Stohl et al., 1998), and it was used pre-
viously for case studies (Stohl and Trickl 1999; Forster et al.
2001; Spichtinger et al. 2001) and a 1-year “climatology”
(Stohl et al., 2002a) of ICT.
For this study, FLEXPART was used with global data from
the European Centre for Medium-Range Weather Forecasts
(ECMWF, 1995) with a horizontal resolution of 1
◦
, 60 ver-
tical levels and a time resolution of 3 h (analyses at 0, 6, 12,
18 UTC; 3-hour forecasts at 3, 9, 15, 21 UTC). Data with 0.5
◦
resolution covering the domain 120
◦
W to 30
◦
E and 18
◦
N
to 66
◦
N were nested into the global data in order to achieve
higher spatial resolution over the region of main interest, i.e.,
North America, the North Atlantic, and Europe.
FLEXPART treats advection and turbulent diffusion by
calculating the trajectories of a multitude of particles.
Stochastic fluctuations, obtained by solving Langevin equa-
tions (Stohl and Thomson, 1999), are superimposed on the
grid-scale winds to represent transport by turbulent eddies,
which are not resolved in the ECMWF data. The ECMWF
data also do not resolve individual deep convective cells,
although they reproduce the large-scale effects of convec-
tion (e.g., the strong ascent within WCBs). To account for
sub-gridscale convective transport, FLEXPART was recently
equipped with the convection scheme developed by Emanuel
and
ˇ
Zivkovi
´
c-Rothman (1999), as described in Seibert et al.
(2001).
With FLEXPART the transport of a passive tracer was cal-
culated, representing NO
x
emissions from North America,
taken from the EDGAR version 3.2 inventory (Olivier and
Berdowski, 2001) (base year 1995, 1
◦
resolution). The sim-
ulation started on 28 October and ended on 28 November
2001. During this period, a total of 25 million particles were
released between the surface and 150 m above the ground
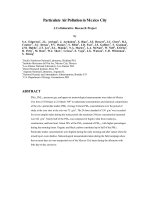
Fig. 1. GOES-East infrared satellite image of the hurricane on 3
November at 6 UTC.
at a constant rate, with the number of particles released in
a particular grid cell being proportional to the emissions in
that cell. An exponential decay with a time constant of two
days was assumed for the NO
x
tracer. This is longer than
the typical NO
x
lifetime in the ABL, but of the right order
of magnitude for NO
x
transport in the free troposphere. The
episode of interest started on 8 November 2001, allowing a
sufficiently long model spin-up of 11 days. The simulations
were described in more detail by Stohl et al. (2003). Note
that, because FLEXPART does not explicitly simulate chem-
ical processes, quantification of the NO
x
transported is diffi-
cult and must be constrained with the GOME measurements.
3 A case study
3.1 Meteorological overview
The “express highway” in which pollution was carried
rapidly from North America to Europe was created in a se-
ries of dynamical developments, which are described in this
section. The most important ingredient to this episode was
a bomb, which “exploded” on 7 November. This bomb it-
self had three precursor systems: First, a tropical depres-
sion started to develop in the Caribbean on 29 October and
intensified to a category four hurricane until 4 November.
In a GOES-East infrared satellite image on 3 November at
6 UTC, an eye can be seen clearly in the center of the hurri-
cane (Fig. 1). This hurricane occurred unusually late in the
season, but nevertheless was one of the strongest of the year.
When it made landfall in Cuba on 4 November, wind speeds
of up to 65 m s
−1
caused massive destruction.
On 6 November at 0 UTC, the hurricane can still be seen
as a minimum in the sea-level pressure, a map of which is
shown in Fig. 2a, where the hurricane’s position is marked
Atmos. Chem. Phys., 3, 969–985, 2003 www.atmos-chem-phys.org/acp/3/969/
A. Stohl et al.: Express highway associated with a bomb 973
c) 8 November 0 UTC
970
980
980
990
990
1000
1000
1000
1010
1010
1010
1010
020
1020
0
1020
1020
1020
1020
1020
1
20
1030
1030
−120 −90 −60 −30 0 30
30
50
70
90
b) 6 November 18 UTC
990
1000
1000
10
1000
1000
10
1010
1010
1010
1010
1010
20
1020
1020
1020
1020
20
1020
1020
1030
−120 −90 −60 −30 0 30
30
50
70
90
a) 6 November 0 UTC
990
9
1000
1000
1000
0
1000
1000
1010
1010
1010
1010
1010
1020
1020
1020
1020
1020
1020
102
1020
1020
1030
−120 −90 −60 −30 0 30
30
50
70
90
f) 10 November 12 UTC
950
960
970
9
980
990
1000
1000
1000
1000
1000
1000
1010
1010
1010
1010
1010
1020
1020
0
1020
1020
1020
1020
1020
1030
−120 −90 −60 −30 0 30
30
50
70
90
e) 9 November 18 UTC
970
980
980
990
990
990
990
1000
1000
1000
1000
1010
1010
1010
1010
1010
1010
20
20
1020
1020
1020
1030
1030
−120 −90 −60 −30 0 30
30
50
70
90
d) 8 November 18 UTC
970
980
990
990
990
1000
1000
1000
1000
1010
1010
1010
1010
1010
1010
1020
1020
1020
1020
020
1020
1020
1020
1020
1030
1030
−120 −90 −60 −30 0 30
30
50
70
90
450 470 490 510 530 550 570 590 610
Hu
C0
C1
C2
C0
Hu
C1
A
C1
B1
C2
B1
B1
B2
C2
B2
Geopotential at 500 hPa [gpdm]
A
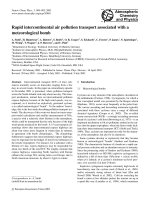
Fig. 2. Maps (120
◦
W–40
◦
E, 25
◦
N–90
◦
N) of the geopotential height at 500 hPa (color shading) and sea-level pressure (black contour lines
drawn every 5hPa) on 6 November 18 UTC (a), 8 November 0 UTC (b), 8 November 18 UTC (c), and 10 November 12 UTC (d), based on
ECMWF analyses with a resolution of 1
◦
. Continental outlines are shown as thick grey lines, and synoptic systems are labeled, as described
in the text, with bold white letters northeast of their center.
with “Hu”. Subsequently, the hurricane weakened, but con-
tinued heading north, carrying warm and moist tropical air
with it. On 6 November at 18 UTC (Fig. 2b) it merged
with the second bomb precursor, a cut-off low at 500 hPa (la-
beled “C0”) that had been almost stationary over the eastern
seaboard of Canada since 5 November (see Fig. 2a). Cut-
off low “C0” blocked continental outflow from the northern
parts of the U.S. and Canada from 5 to 8 November.
The third precursor was an extratropical moving cyclone
(“C1”) that formed northwest of the Hudson Bay on 5
November. On 6 November at 0 UTC, “C1” was located
northwest of the Hudson Bay (Fig. 2a), but reached it
18 hours later (Fig. 2b). “C1” connected to the cut-off cy-
clone “C0” on 7 November, and finally merged with it on 8
November (Fig. 2c–d). The mergers of both the hurricane
“Hu” approaching from the south and the mobile cyclone
www.atmos-chem-phys.org/acp/3/969/ Atmos. Chem. Phys., 3, 969–985, 2003
974 A. Stohl et al.: Express highway associated with a bomb
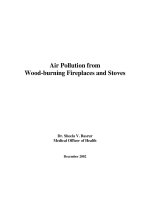
Fig. 3. Combined GOES-East and METEOSAT infrared satellite
image on 8 November at 18 UTC. White areas in the northern part
of the figure are regions without data.
“C1” approaching from the northwest with the cut-off cy-
clone “C0” in the middle, created an environment for explo-
sive development, generating bomb “B1” on 8 November at
0 UTC (Fig. 2c).
On 8 November at 18 UTC, “B1” was centered west of
Greenland (Fig. 2d). A combined GOES-East and ME-
TEOSAT infrared satellite image for 8 November at 18 UTC
(Fig. 3) documents the result of this explosive cyclogenesis.
It shows a truly giant bomb whose cold frontal cloud band
extended from Greenland all the way into the Caribbean, and
whose cloud head stretched from northern Greenland to Ice-
land. The total dimension of the cloud system was greater
than 7000 km.
One day later (Fig. 2e), the bomb split into two (“B1”
and “B2”) over Greenland. While the northern center “B1”
weakened, the southern center “B2” intensified, because of
cyclogenesis leewards of Greenland. On 10 November at
12 UTC (Fig. 2f), “B2” was centered northeast of Iceland
and had deepened to its minimum central sea-level pressure
of 948 hPa. 18 hours later, on 11 November at 6 UTC (not
shown), “B2” travelled into Scandinavia and subsequently
into Siberia, where its core pressure finally started to in-
crease. Due to the remoteness of northern Scandinavia, the
severe weather did not cause major damage, but heavy snow-
falls in the mountains and a wind speed of 43 m s
−1
were
reported in Lapland on 10 November. It is furthermore to be
noted that the bomb likely had triggered downstream Rossby
wave breaking, thus indirectly causing the catastrophic flood-
ing that occurred over Algeria on 10 and 11 November and
caused the death of almost a thousand people.
In order to confirm the classification of this system as a
bomb, Fig. 4 shows the development of the bomb’s minimum
sea-level pressure from 5 to 12 November. At any time, the
6.11. 7.11. 8.11. 9.11. 10.11. 11.11. 12.11.
940
950
960
970
980
990
1000
MSLP [hPa]
Fig. 4. Minimum sea-level pressure from ECMWF analyses in the
core of the bomb during the period 5–12 November 2001 at six-
hourly intervals.
minimum sea-level pressure was taken from the core of the
deepest of the four systems, “Hu”, “C0”, “B1”, and “B2”, re-
spectively (compare Fig. 2). During the 30-hour period from
6 November 18 UTC to 8 November 0 UTC, the bomb’s core
pressure decreased from about 995 hPa (in the center of the
remnant of “Hu”) to 961 hPa. This pressure drop of 34 hPa
/ 30 hours clearly exceeds the criterion (21 hPa / 24 hours at
50
◦
N) defined in SG1980 for explosive cyclogenesis. The
bomb criterion was also met according to the 6-hourly Avia-
tion (AVN) model analyses, obtained from the National Cen-
ter for Enviromental Prediction (NCEP), where the system’s
central pressure fell from about 997 hPa to 964hPa during
the same time period. The pressure rise on 9 November and
the subsequent further drop on 10 November (Fig. 4) are as-
sociated with the lysis of “B1” and the genesis of “B2”. If
pressure were not taken from the center of “B1”, “B2” it-
self would have been classified as a bomb. However, the two
systems are not truly independent, as the strong zonal flow
generated by “B1” over southern Greenland facilitated the
lee cyclogenesis of “B2”. Therefore, and for the sake of sim-
plicity, “B1” and “B2” are referred to here as a single bomb.
As will be seen later, the strong zonal flow south of the
bomb’s center on 9 (Fig. 2e) and 10 (Fig. 2f) November
was responsible for the extremely rapid transport of pollu-
tion from North America to Europe. Thus, the bomb created
an “express highway” for the pollution, visualized by the
dense contour lines of both sea-level pressure and 500 hPa
geopotential (Fig. 2e–f). It is also important that the bomb
itself travelled rapidly to the east, such that the highway was
“rolled out”, like a carpet, in front of the pollution plume,
and was “rolled in” after the plume’s passage, enabling rapid
transport across the entire Atlantic, even though the high-
way did not stretch across the entire Atlantic at any partic-
ular time. However, the initial export of the pollution from
the ABL over North America and its injection into the high-
way occurred through another system over the Great Lakes
region, upstream of the bomb.
Atmos. Chem. Phys., 3, 969–985, 2003 www.atmos-chem-phys.org/acp/3/969/
A. Stohl et al.: Express highway associated with a bomb 975
-100 -90 -80 -70 -60 -50 -40 -30 -20 -10 0 10 20 30 40
Latitude
20
30
40
50
60
70
80
-100 -90 -80 -70 -60 -50 -40 -30 -20 -10 0 10 20 30 40
Latitude
20
30
40
50
60
70
80
-100 -90 -80 -70 -60 -50 -40 -30 -20 -10 0 10 20 30 40
Latitude
20
30
40
50
60
70
80
-100 -90 -80 -70 -60 -50 -40 -30 -20 -10 0 10 20 30 40
Latitude
20
30
40
50
60
70
80
-100 -90 -80 -70 -60 -50 -40 -30 -20 -10 0 10 20 30 40
Longitude
Latitude
20
30
40
50
60
70
80
(a)
(b)
(c)
(d)
(e)
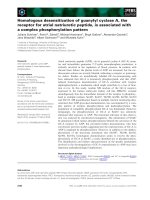
Fig. 5. Tropospheric verti-
cal columns of NO (in 10
molecules cm ), retrieved from
GOME spectral data on (a) 7,
(b) 8, (c) 9, (d) 10, and (e) 11
November 2001. White regions
indicate that data are missing ei-
ther because no GOME over-
pass was available, or because of
more than 50% cloud cover.
35
Fig. 5. Tropospheric vertical columns of NO
2
(in 10
15
molecules cm
−2
), retrieved from GOME spectral data on (a) 7, (b)
8, (c) 9, (d) 10, and (e) 11 November 2001. White regions indi-
cate that data are missing either because no GOME overpass was
available, or because of more than 50% cloud cover.
Fig. 6. Total vertical columns of the FLEXPART NO
x
tracer (in
10
15
molecules cm
−2
) on (a) 7, (b) 8, (c) 9, (d) 10, and (e) 11
November. The columns are averages over 1-hour periods ending
at 16, 16, 15, 11, and 8 UTC, respectively. Bold black lines mark
meridional sections shown in Fig. 7.
www.atmos-chem-phys.org/acp/3/969/ Atmos. Chem. Phys., 3, 969–985, 2003
976 A. Stohl et al.: Express highway associated with a bomb
During the days preceding the NO
x
export, eastern North
America was under the influence of an anticyclone, which
extended from Mexico north to the Hudson Bay. The anti-
cyclone weakened on 5 November, but can still be seen in
the pressure charts for 6 November at 0 UTC (Fig. 2a) and
18 UTC (Fig. 2b), where it is labeled “A”. Upstream of the
bomb “B1”, yet another, much weaker, cyclonic system “C2”
formed after the retreat of anticyclone “A”. On 8 November 0
UTC (Fig. 2c), this system appears as a weak minimum west
of the Great Lakes on the surface pressure analysis. 18 hours
later (Fig. 2d), “C2” had crossed the Great Lakes and had in-
tensified. The cold frontal cloud band associated with “C2”
extended from the Central United States to northeast of the
Great Lakes (see Fig. 3), and a sequence of radar images
shows a squall line progressing east. Trajectories started at
500 m above ground level southwest of the Great Lakes on
8 November 0 UTC ascended into the higher-level clouds
northeast of the Great Lakes at 18UTC (not shown). This in-
dicates northward and upward transport of air from the ABL
into the express highway that was just “rolled out” south of
the bomb on 8 November at 18 UTC (Fig. 2d).
3.2 NO
x
transport in the bomb
Fig. 5 shows daily tropospheric vertical columns of NO
2
dur-
ing the period 7–11 November, obtained from GOME spec-
tral data. Figure 6 shows corresponding atmospheric verti-
cal columns of the FLEXPART NO
x
tracer during the period
7-11 November, and Fig. 7 shows meridionally oriented ver-
tical sections through the NO
x
tracer field. The daily plots
of the model results are shown for times that, in the region
of main interest, coincide best with the GOME overpasses at
about 10:30 local time.
On 7 November, the FLEXPART model results indicate
that pollution outflow from North America was restricted to
the region south of the bomb (Fig. 6a). Over the continent,
the NO
x
tracer was capped at about 2 km by the subsidence
inversion of the retreating anticyclone “A” (Fig. 7a). Over
North America and downwind of it, the GOME tropospheric
NO
2
vertical columns (Fig. 5a) show a distribution very sim-
ilar to the FLEXPART results. In particular, no high val-
ues are seen over the ocean, except for a region south of
the bomb and close to the continent, where pollution out-
flow took place. However, this outflow did not reach Eu-
rope subsequently and is not discussed further here. Thus,
the situation on 7 November can be considered as typical,
similar to the NO
2
distributions seen in annually averaged
GOME results (Leue et al. 2001; Martin et al. 2002; Richter
and Burrows 2002). In contrast to GOME NO
2
, the model
NO
x
tracer shows no enhanced values over Europe, because
only North American NO
x
was simulated. Maximum GOME
NO
2
values over North America are on the order of 10
16
molecules cm
−2
(off the scale in Fig. 5a), somewhat less
but on a similar order of magnitude as the FLEXPART NO
x
tracer columns over North America. The overprediction is
expected, because FLEXPART simulates the sum of NO plus
NO
2
, and because the assumed lifetime of 2 days is too long
for conditions in the ABL.
On 8 November, the cyclone “C2” had intensified (Fig. 2d)
and a NO
x
plume ascended slantwise with the cyclone’s
WCB northeast of the Great Lakes (Fig. 7b). Note that, at
this time, the NO
x
was contained in the WCB clouds (com-
pare Fig. 6b with Fig. 3). Therefore, and because ERS-2 did
not overpass the entire critical region over the Great Lakes,
GOME observes little of the NO
2
transport (Fig. 5b) on 8
November.
On 9 November, a filament of enhanced NO
x
left North
America, with the leading edge of the filament south of
Greenland at 15 UTC (Fig. 6c). The corresponding verti-
cal section (Fig. 7c) shows that the main part of the NO
x
tracer plume was located between about 4 and 6 km. At that
time, the plume’s leading edge had already emerged from
the WCB (corresponding satellite images show clouds dis-
solving in this region), thus giving GOME the first clear
opportunity to monitor the NO
x
export from North Amer-
ica. As shown in Fig. 5c, GOME sees a maximum (about
3 × 10
15
molecules cm
−2
) northeast of Newfoundland, rel-
atively far from any significant source of NO
x
, but exactly
where FLEXPART suggested pollution injection into the ex-
press highway (Fig. 6c).
On 10 November, both GOME (Fig. 5d) and FLEXPART
(Fig. 6d) show a filament of enhanced NO
2
and NO
x
tracer,
respectively, stretching from Newfoundland across the At-
lantic almost to Scandinavia. According to FLEXPART,
the leading tip of the NO
x
tracer filament had travelled
from south of Greenland to Scandinavia, more than 50
◦
of
longitude (or almost 3000 km at 60
◦
N) in only 20 hours,
equivalent to average wind speeds above 40 m s
−1
. Age spec-
tra of the NO
x
tracer (see Stohl et al., 2003, for an explana-
tion how age spectra were obtained from FLEXPART) sug-
gest that most of the NO
x
in the leading part of the filament
northeast of Great Britain was emitted in North America 2–
3 days before, but a significant fraction was even younger
than 2 days.
Meridional cross-sections through the FLEXPART output
show that the filament was located at altitudes of 4-6 km at
40
◦
W (Fig. 7d) and 2–4 km at 10
◦
W (Fig. 7e). The plume,
thus, descended from its higher altitude on the previous day
(compare with Fig. 7c). Due to the descent clouds evapo-
rated, exposing the plume to the GOME instrument. An in-
frared satellite image (Fig. 8) confirms that clouds were thin
or absent at the plume’s location.
The highest NO
2
values observed by GOME in the
filament between Iceland and Scotland were 2.5 × 10
15
molecules cm
−2
. Assuming that the filament’s vertical exten-
sion was 2km (Fig. 7e), simple arithmetics yields an average
concentration of 1.0 µg m
−3
NO
2
, corresponding to almost
1 ppbv at about 4 km altitude, within the plume. Assuming
that NO contributes 50% to the NO
x
, average NO
x
concen-
trations in the plume can be estimated at nearly 2 ppbv, in
Atmos. Chem. Phys., 3, 969–985, 2003 www.atmos-chem-phys.org/acp/3/969/
A. Stohl et al.: Express highway associated with a bomb 977
Fig. 7. Meridional cross-sections through the FLEXPART NO
x
tracer (in ppbv) (a) along 80
◦
W on 7 November at 16 UTC, (b) along 80
◦
W on 8 November at 16 UTC, (c) along 48
◦
W on 9 November at 15 UTC, (d) along 40
◦
W on 10 November at 11 UTC, (e) along 10
◦
W
on 10 November at 11 UTC, (f) along 20
◦
E on 11 November at 8 UTC. Hatched areas indicate topography. Note the difference in the NO
x
scale between the left and right column of figures.
good agreement with the NO
x
tracer mixing ratios obtained
from the model simulation (Fig. 7e). These are very high
NO
x
mixing ratios in the free troposphere, which, given suf-
ficient supply with hydrocarbons (which are likely strongly
enhanced in the plume, too) and sunlight, can lead to consid-
erable O
3
production.
On 11 November, the main part of the FLEXPART fila-
ment extended from southern Greenland to Russia (Fig. 6e).
The maximum vertical columns were lower than before, both
because of the further decay of the NO
x
tracer, and because
the filament broadened, due to mixing with ambient air. Nev-
ertheless, GOME was still able to see the NO
2
signal, show-
ing a band of enhanced NO
2
values between Greenland and
the Baltic Sea (Fig. 5e). The maximum within the band
was detected over the Baltic Sea, at the same location where
FLEXPART suggested the NO
x
tracer maximum. The cross-
sections through the FLEXPART output (Fig. 7f) indicates
that the vertical extension of the plume had increased con-
siderably. In the simulation, some of the NO
x
tracer even
touched down to the Baltic Sea surface.
3.3 Cloud effects on the GOME observations
Considering the potential influence of clouds on the NO
2
ob-
servations by GOME (and, thus, uncertainties in the vertical
NO
2
columns retrieved), two major effects have to be con-
sidered: a) NO
2
below or deep inside the cloud is shielded,
and b) NO
2
(directly) above the cloud is enhanced. Thus, it
is not a priori clear whether clouds lead to an over- or un-
derestimation of the NO
2
. In order to correctly account for
these effects, the exact vertical distributions of both clouds
and NO
2
would have to be known at an accuracy that cannot
www.atmos-chem-phys.org/acp/3/969/ Atmos. Chem. Phys., 3, 969–985, 2003
978 A. Stohl et al.: Express highway associated with a bomb
Fig. 8. Combined GOES-East and METEOSAT infrared satellite
image on 10 November at 12 UTC. White areas in the northwest
corner are regions without data.
be achieved using the data at our disposal. Therefore, we
carried out a sensitivity study for a worst-cases scenario for
effect b), assuming a thin NO
2
layer immediately above a
layer of clouds at 3–5 km altitude. This scenario yields an
overestimate of NO
2
by our retrieval algorithm of less than a
factor of 2, not enough to explain the observed NO
2
plume.
Note also that, due to the cloud masking, maximum actual
cloud cover in the pixels shown is 50%, thus reducing this
maximum possible cloud effect. An independent argument
against a large NO
2
overestimate due to clouds is that the
strongest NO
2
signals are not seen above the densest clouds,
but over pixels with relatively little cloud cover.
Even though the exact vertical distribution of clouds and
NO
2
are both unknown, it is very likely that clouds formed
in the very same airmass that was lifted from the surface and
contained the NO
x
. Thus, most of the NO
x
would likely be
in-cloud, rather than above-cloud. In this case, effect a) could
even have lead to an underestimate of the NO
2
columns.
3.4 Confirmation of the anthropogenic origin of the NO
x
Many previous studies (e.g., Brunner et al. 1998; Wenig et
al. 2002) had difficulties with the unambiguous attribution of
observed upper tropospheric NO
x
plumes to anthropogenic
surface emissions, because the uplift of anthropogenic pol-
lution was associated with strong lightning activity, which
can produce additional NO
x
(e.g., Jeker et al., 2000). In this
case, too, the vertical transport in cyclone “C2” occurred in
precipitating clouds, where lightning is possible. However,
this episode occurred late in the year, when lightning activity
is close to its minimum in the middle latitudes. In order to
reliably exclude lightning as the source of the observed NO
x
,
access was obtained to the lightning data from the Canadian
Lightning Detection Network and the U.S. National Light-
ning Detection Network (NLDN) (Cummins et al., 1998).
These networks detect electromagnetic signals from cloud-
to-ground (CG) lightning discharges. The flash detection ef-
ficiency is about 80–90% over the continent (Cummins et al.,
1998), but decreases with distance from the coast over the
sea. Flash locations and times were obtained from the U.S.
NLDN for the region north of 40
◦
N and east of 100
◦
W, cov-
ering the region where the NO
x
was injected into the express
highway, for the period 7–10 November 2001. Furthermore,
a summary image showing all lightning flashes detected by
both the Canadian and the U.S. networks was received (T.
Turner, personal communication).
Few lightning flashes were detected over Canada, but a
lightning episode was observed over the U.S., and another
one off the coast of North America (Fig. 9). During the first
episode, from 7 November 12 UTC to 8 November 12 UTC,
807 lightning flashes were detected in the Great Lakes re-
gion, which were associated with a line of isolated convec-
tive cells seen in a corresponding satellite image. The second
lightning episode occurred off the coast of North America on
9 and 10 November, when 4097 lightning flashes were de-
tected north of 40
◦
N. Since the detection efficiency of the
NLDN decreases over the sea, the number of flashes in this
region may have been considerably underestimated. Further-
more, no data south of 40
◦
N were available.
The data shown in Fig. 9 were used to make an upper esti-
mate of the lightning NO
x
emissions on the basis of emission
factors reported in the literature. This estimate then served as
an input for a FLEXPART lightning NO
x
tracer simulation,
in order to judge whether lightning could have contributed
significantly to the NO
x
plume detected by GOME or not.
First it must be considered that the NLDN detects only CG
lightning discharges, but no intracloud (IC) flashes. The ratio
of IC/CG flashes over the Great Lakes region varies from 2
to 7 (Boccippio et al., 2001). Taking the higher value, it was
assumed that 5649 and 28679 IC flashes occurred in the two
lightning clusters (7 at each position of a CG flash).
Before estimating the NO
x
production, the vertical distri-
bution in the cloud of the lightning NO
x
must be considered.
Pickering et al. (1998) suggested that the downdrafts carry
about 23% of the total NO
x
produced from lightning, which
results mostly from CG flashes, while updrafts carry 77% of
the NO
x
, produced by both IC and CG flashes. Here it is
assumed that downdrafts released the NO
x
between the sur-
face and 1 km above, while updrafts released it between 6
and 10 km, the approximate altitude of the highest cloud tops
according to satellite infrared imagery.
Values reported in the literature for the NO
x
produced
per cloud-to-ground lightning flash vary considerably, for
instance 6.7×10
26
molecules flash
−1
(Price et al., 1997),
1.25–12.5×10
25
molecules flash
−1
(Stith et al., 1999), or
8.1×10
25
molecules flash
−1
(Huntrieser et al., 2002). De-
Caria et al. (2000) estimated that 3×10
26
molecules CG-
flash
−1
are carried by the downdrafts. Taking this last value,
which is at the upper range of the more recent values reported
in the literature, and assuming a 80% detection efficiency of
CG flashes (note that this value may be too low for the sec-
ond episode), it is estimated that 23.3 t NO
2
were produced
in the first lightning episode below 1 km, and 118 t NO
2
in
the second episode.
Atmos. Chem. Phys., 3, 969–985, 2003 www.atmos-chem-phys.org/acp/3/969/
A. Stohl et al.: Express highway associated with a bomb 979
Fig. 9. Locations of lightning flashes detected by the U.S. National Lightning Detection Network during the period from 7 November 0 UTC
to 11 November 0 UTC. The color of the plusses indicates the time of lightning.
IC flashes produce less NO
x
per flash than CG flashes
(Price et al., 1997). DeCaria et al. (2000) estimate that
1.4×10
26
molecules IC-flash
−1
and 3×10
26
molecules CG-
flash
−1
are carried in updrafts. Adopting these values results
in a NO
2
release between 6 and 10 km of 98 t NO
2
for the
first episode and 497 t NO
2
for the second episode, if again
80% detection efficiency for CG flashes is assumed.
These values can be compared to emissions of 49,000 t
NO
2
per day in the entire U.S., and 880t NO
2
per day in
a single 1
◦
× 1
◦
grid cell over Chicago, according to the
EDGAR inventory (Olivier and Berdowski, 2001). Thus,
both lightning episodes seem to be negligible sources of NO
x
compared to the anthropogenic source. However, as most of
the lightning NO
x
is transported to the anvil region, where
the NO
x
lifetimes are longer than in the ABL, a much larger
fraction than of the anthropogenic NO
x
may be available to
long-range transport. Therefore, two lightning NO
x
tracers
were simulated with FLEXPART, one for each of the two
episodes, assuming a NO
x
lifetime of 2 days.
Fig. 10 shows, for both lightning clusters, the total ver-
tical columns of the lightning NO
x
tracer at the time of
the GOME observations on 10 November. It is seen that a
part of the NO
x
produced by the first lightning cluster in-
deed travelled in the express highway (Fig. 10a), approxi-
mately where GOME detected the NO
2
filament. However,
the maximum vertical columns in this region were only about
5×10
12
molecules cm
−2
, or more than two orders of magni-
tude less than the observed NO
2
. Most of the lightning NO
x
tracer (it can be shown that it was the part released in the
anvil) was located over the central North Atlantic, but even
there NO
x
columns were too low to be detectable by GOME.
The maximum NO
x
tracer columns resulting from the sec-
ond lightning cluster (Fig. 10b) were much higher than those
from the first one, but on 10 November the plume was still
quite close to where it had been produced. Part of this plume
was injected into the express highway and travelled to Eu-
rope subsequently, but too late to explain more than the trail-
ing end of the GOME filament observed on 11 November.
Therefore, lightning NO
x
emissions from the second cluster
also cannot explain the GOME observations, especially not
on 10 November. Unfortunately, in this case, the NLDN may
have missed lightning further off-shore, because of the de-
crease in detection efficiency with distance from the coast.
Furthermore, no lightning data were available south of 40
◦
N. Therefore, we repeated the FLEXPART simulations two
times, first shifting the emissions 5
◦
to the east and, second,
5
◦
to the south. Neither of these sensitivity simulations could
explain the GOME observations.
Finally, it was explored whether the NO
x
could have been
produced by lightning in the hurricane, where the Lightning
Imaging Sensor (LIS) detected some lightning flashes. For
this, we released lightning tracers at the hurricane’s approx-
imate location in maps of sea-level pressure on 2, 3, and 4
November. In all three cases, the tracers were advected east-
wards across the Atlantic Ocean, but at latitudes of approxi-
mately 40–50
◦
N and rather slowly. GOME did not see en-
hanced NO
2
along these pathways. None of the three light-
ning tracers was transported in the express highway. Accord-
ing to LIS and NLDN data, no other major lightning activity
was observed close to the region of inflow into the express
highway during the days preceding the event. Therefore,
lightning can be ruled out to the best of our knowledge as
the main source of the NO
2
detected by GOME.
www.atmos-chem-phys.org/acp/3/969/ Atmos. Chem. Phys., 3, 969–985, 2003
980 A. Stohl et al.: Express highway associated with a bomb
Fig. 10. Total vertical columns of the FLEXPART lightning NO
x
tracer on 10 November at 11 UTC for (a) lightning cluster 1 (in 10
12
molecules cm
−2
), and (b) lightning cluster 2 (in 10
13
molecules cm
−2
).
4 Discussion and climatological considerations
In this paper it was shown, unambiguously for the first time,
that NO
x
from anthropogenic sources can be transported over
intercontinental distances. More than 1ppbv NO
x
arrived
over Europe within the North American plume, bearing sig-
nificant capacity for O
3
formation. The key transport mecha-
nism in this episode, strong zonal flow south of the center of a
meteorological bomb, was quite exceptional and has not yet
been studied in the context of atmospheric chemistry. The
question, thus, arises, whether this was just an interesting
event at the very extreme end of the spectrum of all transport
events, or whether similar episodes do indeed happen more
often. In other words: What is the climatological relevance
of air pollution transport in bombs?
It is not straightforward to use GOME data for answering
this question, because normally the upward transport of pol-
lution is accompanied by extensive cloud formation, shield-
ing NO
2
from the satellite’s view. In the case presented here
the clouds dissolved quickly after their formation, but this
is likely not a typical situation. Furthermore, the longer life-
time of NO
x
in winter than in summer favored the long-range
transport of NO
x
in this case, and the NO
x
partitioning be-
tween NO and NO
2
shifts towards NO
2
in winter, again fa-
voring the plume’s detection by GOME. In addition, light-
ning may sometimes contribute a large fraction of the NO
x
(at least in summer), rendering difficult the attribution of the
detected NO
x
to an anthropogenic source.
An answer to the above question can be given on the
basis of bomb climatologies. SG1980 identified 109 and
158 bombs in the North Atlantic and North Pacific in three
winter half years (maximum frequency in January), re-
spectively, but they note that, for several reasons, bombs
are underreported in their study. Similar frequencies were
also reported by Roebber (1984) for another 1-year period.
Using somewhat stronger criteria for bomb classification,
Atmos. Chem. Phys., 3, 969–985, 2003 www.atmos-chem-phys.org/acp/3/969/
A. Stohl et al.: Express highway associated with a bomb 981
Lim and Simmonds (2002) found 46 and 26 bomb events per
year in the Northern and Southern Hemisphere, respectively.
However, they only considered explosive developments start-
ing at 0 UTC, thus underestimating true bomb frequencies.
Furthermore, all three studies used coarse-resolution meteo-
rological data, where not all bombs could be detected. There-
fore, on a global scale bombs are quite frequent phenomena.
On average, a bomb event occurs about once a week on the
Northern Hemisphere, and this frequency increases to one
event every two days at the peak of the winter-time bomb
season.
Both SG1980 and Lim and Simmonds (2002) found the
highest bomb frequencies over the warm Kuroshio current
and Gulf stream east of Asia and North America, respec-
tively (see Fig. 3 in SG1980 and Fig. 12 in Lim and Sim-
monds, 2002), but detected few bombs over land. For the
Southern Hemisphere, Lim and Simmonds (2002) report the
highest bomb frequencies at about 60
◦
S, relatively remote
from pollution sources (albeit secondary maxima were de-
tected downwind of South America and Australia). Taking
this together with the lower overall bomb frequency, it seems
that bombs are not a particularly relevant factor for air pol-
lution transport on the Southern Hemisphere. On the North-
ern Hemisphere, however, bombs may influence transport of
Asian and North American pollution to a significant extent.
In contrast, bombs are negligible for transport of European
pollution.
Another way to estimate the climatological relevance of
bombs is to look at the frequency of express highways in
transport climatologies. While fast transport is not neces-
sarily associated with bombs only, it can be argued that a
large fraction of the fastest intercontinental transport events
is associated either with bombs or at least with cyclones that,
albeit not quite fulfilling the bomb criterion of rapid deepen-
ing, are of extreme intensity. Note, though, that fast trans-
port in the upper troposphere can also occur with a jet streak
without involving a bomb. Therefore, in order to avoid am-
biguities, the original question posed at the beginning of this
discussion can be changed to: What is the climatological rel-
evance of air pollution transport in intercontinental express
highways?
Stohl et al. (2002a) presented a 1-year climatology of the
pathways and timescales of ICT, which has been extended
recently by Eckhardt et al. (2003) to a 15-year period, and
which is used here to answer the above question. For the
climatology, FLEXPART was used to calculate the global
transport of six passive continental tracers. Tracer particles
were released over the continents according to the emission
distribution of carbon monoxide continuously throughout the
entire 15-year simulation (to convert to NO
x
, we have to as-
sume typical emission ratios for the two species, see below).
Particles were advected for 50 days, after which they were
removed from the simulations. The model output was orga-
nized in 12 age classes (denoting time after emission), the
first three ones being 0–2, 2–4, and 4–6days, and the last
one being 40–50days. An infinite tracer lifetime was used in
the simulations, but tracer decay can be approximately deter-
mined for any lifetime using the discrete age class informa-
tion available in the model output. For details of the transport
climatology, the reader is referred to the papers of Stohl et al.
(2002a) and Eckhardt et al. (2003).
Given the above age classes, a subjective definition for in-
tercontinental express highways is that the North America
tracer arrives over Europe within less than 4 days. Note that
in the case study, the bulk of the NO
x
would have fulfilled
this criterion. For transport from Asia to North America,
the greater dimension of the Pacific Ocean must be consid-
ered. Furthermore, it is not very likely for a cyclone (and
presumably also not for a bomb) to track across the whole
Pacific (Hoskins and Hodges, 2002). Therefore, 6 days are
used as the limit for an express highway between Asia and
North America.
Figure 11 shows cumulative age spectra of the concentra-
tions of the North America tracer and of the Asia tracer, av-
eraged over meridionally oriented vertical planes at the west
coasts of the respective downwind continent (Europe for the
North America tracer, North America for the Asia tracer).
It can be seen that the tracer concentrations increase by or-
ders of magnitude as transport time increases. This is a result
of increasingly slow transport mechanisms being capable of
delivering tracer to the downwind continent as the transport
time increases. In agreement with the climatology of bombs,
express highways are found to be much more important in
winter than in summer. On average, express highways, as de-
fined above, deliver about 0.16 µg m
−3
of tracer from North
America to Europe (0.14 µg m
−3
from Asia to North Amer-
ica) in winter, but only 0.05 µg m
−3
(0.03 µg m
−3
) in sum-
mer. In contrast, in both seasons and for both tracers, about
10 µg m
−3
of tracer are delivered to the downwind continent
up to a timescale of 50 days. Therefore, in winter express
highways contribute only about 1–2% of the tracer that is de-
livered within 50 days, and in summer even only 0.3–0.5%.
This makes it immediately clear that express highways bear
little climatological significance for trace substances with
lifetimes of the order of ten days or more.
The situation is different for trace substances with a shorter
lifetime. For instance, Fig. 12 shows the results if it is as-
sumed that the tracer has a lifetime of only 1 day (note that
the values reported are valid only approximately, as the tracer
decay had to be estimated from the discrete age spectra). In
this case, fast transport events dominate the budgets, and ex-
press highways from North America to Europe are responsi-
ble for about 65% of the total tracer transport in winter and
44% in summer. For express highways from Asia to North
America the respective numbers are 75% in winter and 60%
in summer. Twice as much North American 1-day lifetime
tracer arrives over Europe and four times more Asian tracer
arrives over North America in winter than in summer.
The absolute values of the tracers delivered with express
highways are relatively small, but nevertheless significant. If
www.atmos-chem-phys.org/acp/3/969/ Atmos. Chem. Phys., 3, 969–985, 2003
982 A. Stohl et al.: Express highway associated with a bomb
2 4 6 8 10 12 15 20 25 30 40 50
10
−3
10
−2
10
−1
10
0
Age [days]
10
−3
10
−2
10
−1
10
0
10
1
Concentration µg/m
3
a)
b)
Fig. 11. Cumulative age spectra, averaged over a meridionally ori-
ented vertical (up to 10 km) plane, in December, January and Febru-
ary (solid lines) and in June, July and August (dashed lines) of (a)
the North America tracer at 0
◦
W between 36
◦
N and 70
◦
N, and
(b) the Asia tracer at 125
◦
W between 20
◦
N and 70
◦
N. Values are
plotted at the end of the respective age class interval. Grey vertical
lines separate express highways (to the left) from slower modes of
transport (to the right).
we assume that NO
x
has an average lifetime of 1 day (note
that it may actually be longer in the free troposphere) and,
furthermore, the molar ratio of NO
x
and carbon monoxide
emissions is 0.16 (a value typical at least for the United States
(EPA, 2000), but with relatively large uncertainty (Parrish
et al., 2002)), we can use our climatology to estimate the
impact of express highways on NO
x
concentrations. Con-
verting carbon monoxide into NO
x
emissions and account-
ing for differences in molar weights, it can be determined
from Fig. 12a that in winter on average about 2.2ngm
−3
NO
x
arrives over Europe with express highways. Depend-
ing on the altitude, this translates into 2–3 pptv NO
x
, a very
significant fraction of the 10–30pptv required to push the
photochemical regime from O
3
destruction to O
3
production
in the upper troposphere (Reeves et al., 2002). Certainly, ex-
press highways are episodic events, and a mean contribution
to the NO
x
is misleading in terms of their impact on O
3
for-
mation. However, one can easily imagine that thin filaments,
2 4 6 8 10 12 15 20 25 30 40 50
0
0.5
1
1.5
2
Age [days]
2
4
6
8
10
12
14
Concentration ng/m
3
b)
a)
Fig. 12. Same as Fig. 11, but assuming a 1-day lifetime of the tracer.
Note that a linear scale is used here, in contrast to Fig. 11.
such as the one found in the case study – and as they are
typical for rapid transport events –, are mixed into the hemi-
spheric background over short time scales (note that, in the
case study, the model simulations actually suggested sub-
stantial dilution). Therefore, and because other ozone pre-
cursors would be significantly enhanced, too, it may well be
the case that air pollution express highways have a signifi-
cant influence on the chemical budget of the remote North-
ern Hemisphere troposphere in winter. To further explore this
hypothesis, simulations with chemistry transport models are
required.
5 Conclusions
The conclusions from this study are as follows:
– In a case study, very good agreement between NO
x
tracer plumes simulated by the FLEXPART tracer trans-
port model and GOME NO
2
measurements was found.
– For this case study it was shown, unambiguously for
the first time, that NO
x
from anthropogenic surface
sources can be transported over intercontinental dis-
tances. Lightning could definitely be ruled out as the
source of the NO
x
.
– Within the pollution plume originating from North
America, more than 1 ppb NO
x
arrived over western
Europe. The fact that NO
x
concentrations in the ppb
Atmos. Chem. Phys., 3, 969–985, 2003 www.atmos-chem-phys.org/acp/3/969/
A. Stohl et al.: Express highway associated with a bomb 983
range can occur so far downwind from the emission
source may have implications for the ozone production
in remote regions of the troposphere, particularly be-
cause they may be accompanied by high concentrations
of other substances, including short-lived ones such as
olefines and aldehydes.
– Meteorological bombs are a, so far unexplored, trans-
port mechanism of extremely fast long-range air pollu-
tion transport. The pathway was termed here an inter-
continental express highway.
– Air pollution transport in an intercontinental express
highway across the North Atlantic can take as little as
one day. The time from the emission of an air pollu-
tant at the surface in North America to its arrival over
Europe can be less than two days.
– A 15-year transport climatology shows that interconti-
nental express highways are by a factor 4 more frequent
in winter than in summer, in agreement with bomb cli-
matologies.
– The climatology furthermore indicates that interconti-
nental express highways bear little climatological rele-
vance for longer-lived substances (e.g., carbon monox-
ide), but may be important for some short-lived sub-
stances. For a substance with a lifetime of 1day, express
highways may account for about two thirds of the total
ICT.
– A rough calculation suggests that express highways
connecting North America with Europe enhance the cli-
matological mean NO
x
mixing ratio over Europe by
about 2–3pptv in winter. However, actual events are
highly episodic and, thus, enhancements vary strongly.
Acknowledgements. This study was part of the projects ATMO-
FAST, CONTRACE and NOXTRAM, all funded by the German
Federal Ministry for Education and Research within the Atmo-
spheric Research Program 2000 (AFO 2000). ECMWF and the
German Weather Service are acknowledged for permitting access
to the ECMWF archives. The GOES-EAST infrared images were
made available through the UNIDATA McIDAS data stream and
the METEOSAT images were released by EUMETSAT, and were
made available through the NASA Marshall Space Flight Center.
GOME lv1-spectra have been provided by ESA through DLR-DFD-
Oberpfaffenhofen. We express our gratitude to Vaisala-GAI Inc. (T.
Turner and R. Zaharescu) for providing data from the U.S. National
Lightning Detection Network and a figure showing lightning flashes
detected by both the Canadian and the U.S. National Lightning De-
tection Networks.
References
Bjerknes, V.: Synoptical representation of atmospheric motions, Q.
J. R. Meteorol. Soc., 36, 167–286, 1910.
Boccippio, D. J., Cummins, K. L., Christian, H. J., and Goodman,
S. J.: Combined satellite- and surface-based estimation of the
intracloud–cloud-to-ground lightning ratio over the continental
United States, Mon. Weather Rev., 129, 108–122, 2001.
Bradshaw, J., Davis, D., Grodzinsky, G., Smyth, S., Newell, R.,
Sandholm, S., and Liu, S.: Observed distributions of nitrogen ox-
ides in the remote free troposphere from the NASA global tropo-
spheric experiment programs, Rev. Geophys., 38, 61–116, 2000.
Browning, K. A., Hardman, M. E., Harrold, T. W., and Pardoe,
C. W.: Structure of rainbands within a mid-latitude depression,
Q. J. R. Meteorol. Soc., 99, 215–231, 1973.
Brunner, D., Staehelin, J., and Jeker, D.: Large-scale nitrogen ox-
ide plumes in the tropopause region and implications for ozone,
Science, 282, 1305–1309, 1998.
Buckley, B. W. and Leslie, L. M.: The Australian Boxing Day storm
of 1998 – Synoptic description and numerical simulations, Wea.
Forecasting, 15, 543–558, 2000.
Burrows, J. P., Weber, M. Buchwitz, M., Rozanov, V. V., Ladst
¨
atter,
A., Weißenmayer, Richter, A., DeBeek, R., Hoogen, R., Bram-
stedt, K., and Eichmann, K. U.: The Global Ozone Monitoring
Experiment (GOME): Mission concept and first scientific results,
J. Atmos. Sci., 56, 151–175, 1999.
Burt, S. D. and Mansfield, D. A.: The great storm of 15–16 October
1987, Weather, 43, 90–114, 1988.
Carlson, T. N.: Mid-Latitude Weather Systems, American Meteo-
rological Society, Boston, 507 p., 1998.
Cooper, O. R., Moody, J. L., Parrish, D. D., Trainer, M., Ryerson,
T. B., Holloway, J. S., H
¨
ubler, G., Fehsenfeld, F. C., and Evans,
M. J.: Trace gas composition of midlatitude cyclones over the
western North Atlantic Ocean: A conceptual model, J. Geophys.
Res., 107, doi: 10.1029/2001JD000901, 2002.
Cummins, K. L., Murphy, M. J., Bardo, E. A., Hiscox, W. L., Pyle,
R. B., and Pifer, A. E.: A combined TOA/MDF technology up-
grade of the U.S. National Lightning Detection Network, J. Geo-
phys. Res., 103, 9035–9044, 1998.
DeCaria, A. J., Pickering, K. E., Stenchikov, G. L., Scala, J. R.,
Stith, J. L, Dye, J. E., Ridley, B. A., and Laroche, P.: A cloud-
scale model study of lightning-generated NO
x
in an individ-
ual thunderstorm during STERAO-A, J. Geophys. Res., 105,
11 601–11616, 2000.
Eckhardt, S., Stohl, A., Beirle, S., Spichtinger, N., James, P.,
Forster, C., Junker, C., Wagner, T., Platt, U., and Jennings, S. G.:
The North Atlantic Oscillation controls air pollution transport to
the Arctic, submitted to Atmos. Chem. Phys
ECMWF: User Guide to ECMWF Products 2.1, Meteorological
Bulletin M3.2, ECMWF, Reading, UK, 1995.
Emanuel, K. A. and
ˇ
Zivkovi
´
c-Rothman, M.: Development and eval-
uation of a convection scheme for use in climate models, J. At-
mos. Sci. 56, 1766–1782, 1999.
EPA: National Air Quality and Emissions Trends Report, 1998,
EPA Report, EPA-454/R-00-003, EPA, 2000.
Forster, C., Wandinger, U., Wotawa, G., James, P., Mattis, I., Al-
thausen, D., Simmonds, P., O’Doherty, S., Kleefeld, C., Jen-
nings, S. G., Schneider, J., Trickl, T., Kreipl, S., J
¨
ager, H., and
Stohl, A.: Transport of boreal forest fire emissions from Canada
to Europe, J. Geophys. Res., 106, 22887–22 906, 2001.
www.atmos-chem-phys.org/acp/3/969/ Atmos. Chem. Phys., 3, 969–985, 2003
984 A. Stohl et al.: Express highway associated with a bomb
Heland, J., Schlager, H., Richter, A., and Burrows, J. P.: First
comparison of tropospheric NO
2
column densities retrieved from
GOME measurements and in situ aircraft profile measurements,
Geophys. Res. Lett., doi:10.1029/2002GL015528, 2002.
Hoskins, B. J. and Hodges, K. I.: New perspectives on the Northern
Hemisphere winter storm tracks, J. Atmos. Sci. 59, 1041–1061,
2002.
Huntrieser, H., Feigl, C., Schlager, H., et al.: Airborne measure-
ments of NO
x
, tracer species and small particles during the Eu-
ropean Lightning Nitrogen Oxides Experiment, J. Geophys. Res.,
107, 10.1029/2000JD000209, 2002.
Huntrieser, H., Heland, J., Stohl, A., et al.: Intercontinental trans-
port of pollution from North America to Europe: Airborne trace
gas measurements over central and northern Europe, in prepara-
tion for J. Geophys. Res., 2003.
Jaegl
´
e, L., Jacob, D. J., Wang, Y., et al.: Sources and chemistry of
NO
x
in the upper troposphere over the United States, Geophys.
Res. Lett., 25, 1705–1708, 1998.
Jaffe, D., Anderson, T., Covert, D., et al.: Transport of Asian air
pollution to North America, Geophys. Res. Lett., 26, 711–714,
1999.
Jeker, D. P., Pfister, L., Thompson, A. M., Brunner, D., Boccippio,
D., Pickering, K. E., Wernli, H., Kondo, Y., and Staehelin, J.:
Measurements of nitrogen oxides at the tropopause: Attribution
to convection and correlation with lightning, J. Geophys. Res.,
105, 3679–3700, 2000.
Lauer, A., Dameris, M., Richter, A., and Burrows, J. P.: Tropo-
spheric NO
2
columns: a comparison between model and re-
trieved data from GOME measurements, Atmos. Chem. Phys.,
2, 67–78, 2002.
Lawrence, M., Rasch, J. P., von Kuhlmann, R., et al.: An
operational global chemical weather forecast system for field
campaign support: Predictions and observations of large-scale
features during INDOEX, MINOS, and CONTRACE, Atmos.
Chem. Phys. Discuss., 2, 1545–1597, 2003.
Lema
ˆ
itre, Y., Protat, A., and Scialom, G.: Dynamics of a “bomb-
like” deepening secondary cyclone from airborne Doppler radar,
Q. J. R. Meteorol. Soc., 125, 2797–2818, 1999.
Leue, C., Wenig, M., Wagner, T., Klimm, O., Platt, U., and J
¨
ahne,
B.: Quantitative analysis of NO
x
emissions from Global Ozone
Monitoring Experiment satellite image sequences, J. Geophys.
Res., 106, 5493–5505, 2001.
Lim, E P. and Simmonds, I.: Explosive cyclone development in
the Southern Hemisphere and a comparison with Northern Hemi-
sphere events, Mon. Wea. Rev., 130, 2188–2209, 2002.
Liang, J. Y., Horowitz, L. W., Jacob, D. J., Wang, Y. H., Fiore,
A. M., Logan, J. A., Gardner, G. M., Munger, J. W.: Seasonal
budgets of reactive nitrogen species and ozone over the United
States, and export fluxes to the global atmosphere, J. Geophys.
Res., 103, 13 435–13450, 1998.
Lin, X., Trainer, M., and Liu, S. C.: On the nonlinearity of the tropo-
spheric ozone production, J. Geophys. Res., 93, 15 879–15888,
1988.
Martin, R. V., Chance, K., Jacob, D. J., Kurosu, T. P., Spurr, R. J. D.,
Bucsela, E., Gleason, J. F., Palmer, P. I., Bey, I., Fiore, A. M.,
Li, Q., Yantosca, R. M.: An Improved Retrieval of Tropospheric
Nitrogen Dioxide from GOME , J. Geophys. Res., 107, 4437,
doi:10.1029/2001JD001027, 2002.
Olivier, J. G. J. and Berdowski, J. J. .M.: Global emissions sources
and sinks. In: Berdowski, J., Guicherit, R. and B. J. Heij
(Eds.), The Climate System, pp. 33–78, A. A. Balkema Pub-
lishers/Swets and Zeitlinger Publishers, Lisse, The Netherlands.
ISBN 90 5809 255 0, 2001.
Parrish, D. D., Trainer, M., Hereid, D., Williams, E. J., Ol-
szyna, K. J., Harley, R. A., Meagher, J. F., and Fehsen-
feld, F. C.: Decadal change in carbon monoxide to nitro-
gen oxide ratio in U.S. vehicular emissions, J. Geophys. Res.,
10.1029/2001JD000720, 2002.
Pickering, K. E., Wang, Y., Tao, W K., Price, C., and M
¨
uller, J
F: Vertical distributions of lightning NO
x
for use in regional and
global chemical transport models, J. Geophys. Res., 103, 31 203–
31 216, 1998.
Platt, U.: Differential optical absorption spectroscopy (DOAS),
in Air Monitoring by Spectroscopic Techniques, M. W. Sigrist
(Ed.), Chemical Analysis Series Vol. 127, John Wiley, New York,
1994.
Prados, A. I., Dickerson, R. R., Doddridge, B. G., Milne, P. A.,
Moody, J. L., and Merrill, J. T.: Transport of ozone and pollutants
from North America to the North Atlantic Ocean during the 1996
Atmosphere/Ocean Chemistry Experiment (AEROCE) intensive,
J. Geophys. Res. 104, 26219–26 233, 1999.
Price, C., Penner, J., and Prather, M.: NO
x
from lightning - 1.
Global distribution based on lightning physics, J. Geophys. Res.
102, 5929–5941, 1997.
Reeves, C. E., Claire, E., Penkett, S. A., et al.: Potential for pho-
tochemical ozone formation in the troposphere over the North
Atlantic as derived from aircraft observations during ACSOE, J.
Geophys. Res., 107, 4707, doi: 10.1029/2002JD002415, 2002.
Richter, A. and Burrows, J. P.: Tropospheric NO2 from GOME
measurements, Adv. Space Res., 29, 1673–1683, 2002.
Roebber, P. J.: Statistical analysis and updated climatology of ex-
plosive cyclones, Mon. Wea. Rev., 112, 1577–1589, 1984.
Rozanov, V., Diebel, D., Spurr, R. J. D., and Burrows, J. P.: GOME-
TRAN: A radiative transfer model for the satellite project GOME
– the plane parallel version, J. Geophys. Res., 102, 16683–
16 696, 1997.
Sanders, F. and Gyakum, J. R.: Synoptic-dynamic climatology of
the “bomb”, Mon. Wea. Rev., 108, 1589–1606, 1980.
Sanders, F., Mullen, S. L., Baumhefner, D. P.: Ensemble simula-
tions of explosive cyclogenesis at ranges of 2–5 days, Mon. Wea.
Rev., 128, 2920–2934.
Seibert, P., Kr
¨
uger, B., and Frank, A.: Parametrisation of convective
mixing in a Lagrangian particle dispersion model, Proceedings of
the 5th GLOREAM Workshop, Wengen, Switzerland, Septem-
ber 24–26, 2001.
Solomon, S., Schmeltekopf, A. L., and Sanders, R. W.: On the in-
terpretation of zenith sky absorption measurements, J. Geophys.
Res, 92, 8311–8319, 1987.
Spichtinger, N., Wenig, M., James, P., Wagner, T., Platt, U., and
Stohl, A.: Satellite detection of a continental-scale plume of ni-
trogen oxides from boreal forest fires, Geophys. Res. Lett., 28,
4579–4582, 2001.
Stith, J., Dye, J., Ridley, B., Laroche, P., Defer, E., Baumann, K.,
H
¨
ubler, G., Zerr, R., and Venticinque, M.: NO signatures from
lightning flashes, J. Geophys. Res., 104, 16081–16 089, 1999.
Stohl, A.: A one-year Lagrangian “climatology” of airstreams in the
northern hemisphere troposphere and lowermost stratosphere, J.
Geophys. Res. 106, 7263–7279, 2001.
Atmos. Chem. Phys., 3, 969–985, 2003 www.atmos-chem-phys.org/acp/3/969/
A. Stohl et al.: Express highway associated with a bomb 985
Stohl, A., Eckhardt, S., Forster, C., James, P., and Spichtinger,
N.: On the pathways and timescales of intercontinental
air pollution transport, J. Geophys. Res., 107, 4684, doi:
10.1029/2001JD001396, 2002a.
Stohl, A., Trainer, M., Ryerson, T. B., Holloway, J. S., and Parrish,
D. D.: Export of NO
y
from the North American boundary layer
during 1996 and 1997 North Atlantic Regional Experiments, J.
Geophys. Res., 107, doi: 10.1029/2001JD000519, 2002b.
Stohl, A., Hittenberger, M., and Wotawa, G.: Validation of the
Lagrangian particle dispersion model FLEXPART against large
scale tracer experiment data, Atmos. Environ., 32, 4245–4264,
1998.
Stohl, A. and Trickl, T.: A textbook example of long-range trans-
port: Simultaneous observation of ozone maxima of strato-
spheric and North American origin in the free troposphere over
Europe, J. Geophys. Res., 104, 30445–30 462, 1999.
Stohl, A. and Thomson, D. J.: A density correction for Lagrangian
particle dispersion models, Boundary-Layer Meteorol., 90, 155–
167, 1999.
Stohl, A., Forster, C., Eckhardt, S., Spichtinger, N., Huntrieser, H.,
Heland, J., Schlager, H., Wilhelm, S., Arnold, F., and Cooper,
O.: A backward modeling study of intercontinental pollution
transport using aircraft measurements, J. Geophys. Res., in press,
2003
Ulbrich, U., Fink, A. H., Klawa, M., and Pinto, J. G.: Three ex-
treme storms over Europe in December 1999, Weather, 56, 70–
80, 2001.
Velders, G. J. M., Granier, C., Portmann, R. W., Pfeilsticker, K.,
Wenig, M., Wagner, T., Platt, U., Richter, A., and Burrows, J. P.:
Global tropospheric NO
2
column distributions: Comparing 3-D
model calculations with GOME measurements, J. Geophys. Res.,
106, 12 643–12660, 2001.
Wenig, M., Spichtinger, N., Stohl, A., Held, G., Beirle, S., Wagner,
T., J
¨
ahne, B., and Platt, U.: Intercontinental transport of nitrogen
oxide pollution plumes, Atmos. Chem. Phys. Discuss., 2, 2151–
2165, 2002.
Wernli, H., Dirren, S., Liniger, M. A., and Zillig, F.: Dynamical
aspects of the life cycle of the winter storm “Lothar” (24–26 De-
cember 1999), Q. J. R. Meteorol. Soc., 128, 405–429, 2002.
Wild, O., Law, K. S., McKenna, D. S., et al.: Photochemical trajec-
tory modeling studies of the North Atlantic region during August
1993, J. Geophys. Res., 101, 29269–29 288, 1996.
Zhu, Y. and Newell, R. E.: Atmospheric rivers and bombs, Geo-
phys. Res. Lett., 21, 1999–2002, 1994.
Ziereis, H., Schlager, H., Schulte, P., van Velthoven, P. F. J., and
Slemr, F.: Distributions of NO, NO
x
, and NO
y
in the upper tro-
posphere and lower stratosphere between 28
◦
and 61
◦
N during
POLINAT 2, J. Geophys. Res., 105, 3653–3664, 2000.
www.atmos-chem-phys.org/acp/3/969/ Atmos. Chem. Phys., 3, 969–985, 2003