Business resilience in an uncertain, resource-constrained world pot
Bạn đang xem bản rút gọn của tài liệu. Xem và tải ngay bản đầy đủ của tài liệu tại đây (2.09 MB, 60 trang )
1
Business resilience
in an uncertain,
resource-constrained
world
CDP Global 500 Climate Change Report 2012
On behalf of 655 investors
with assets of US$ 78 trillion
Global Advisor and Report Writer
2
ContentsContents
“Increasingly, our key
stakeholders – our people, clients,
shareholders and partners -
expect us to operate our business
in a way that is economically,
socially and environmentally
sustainable. Meeting these
expectations helps us to function
successfully as a business, attract
and keep high calibre people,
retain key contracts and take on
new challenges.”
Logica
CDP Foreword – Paul Simpson, CEO 3
Executive Summary 4
CDP Investor Members 2012 6
Investor Perspective – Alex Wynaendts, CEO Aegon 10
Key Themes & Highlights 11
Scale of global ambition 11
Drivers for action 12
CFO Perspective – Deirdre Mahlan, CFO Diageo 14
Unlocking investment 15
The emergence of a new ‘business as usual’ 16
Corporate Natural Capital Accounting – Malcolm Preston, Partner PwC 20
2012 Leaders 22
CDLI 23
CPLI 26
Sector Analysis 28
Key Statistics 35
Disclosure 35
Emissions 36
Performance 38
Appendix 40
Important Notice
The contents of this report may be used by anyone providing acknowledgement
is given to Carbon Disclosure Project (CDP). This does not represent a license
to repackage or resell any of the data reported to CDP or the contributing
authors and presented in this report. If you intend to repackage or resell any of
the contents of this report, you need to obtain express permission from CDP
before doing so.
CDP has prepared the data and analysis in this report based on responses
to the CDP 2012 information request. No representation or warranty (express
or implied) is given by CDP or any of its contributors as to the accuracy or
completeness of the information and opinions contained in this report. You
should not act upon the information contained in this publication without
obtaining specific professional advice. To the extent permitted by law, CDP
and its contributors do not accept or assume any liability, responsibility or duty
of care for any consequences of you or anyone else acting, or refraining to
act, in reliance on the information contained in this report or for any decision
based on it. All information and views expressed herein by CDP and any of
its contributors is based on their judgment at the time of this report and are
subject to change without notice due to economic, political, industry and firm-
specific factors. Guest commentaries where included in this report reflect the
views of their respective authors; their inclusion is not an endorsement of them.
CDP and its contributors, their affiliated member firms or companies, or their
respective shareholders, members, partners, principals, directors, officers
and/or employees, may have a position in the securities of the companies
discussed herein. The securities of the companies mentioned in this document
may not be eligible for sale in some states or countries, nor suitable for all types
of investors; their value and the income they produce may fluctuate and/or be
adversely affected by exchange rates.
‘Carbon Disclosure Project’ and ‘CDP’ refer to Carbon Disclosure Project,
a United Kingdom company limited by guarantee, registered as a United
Kingdom charity, number 1122330.
© 2012 Carbon Disclosure Project. All rights reserved.
3
The pressure is growing for companies to build long-term
resilience in their business. The unprecedented debt crisis
that has hit many parts of the world has sparked a growing
understanding that short-termism can bring an established
economic system to breaking point. As some national
economies have been brought to their knees in recent
months, we are reminded that nature’s system is under threat
through the depletion of the world’s finite natural resources
and the rise of greenhouse gas emissions.
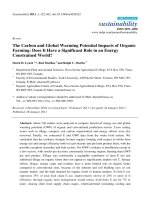
Business and economies globally have already been
impacted by the increased frequency and severity of extreme
weather events, which scientists are increasingly linking to
climate change
1
. Bad harvests due to unusual weather have
this year rocked the agricultural industry, with the price of
grain, corn and soybeans reaching an all time high. Last year,
Intel lost $1 billion in revenue and the Japanese automotive
industry were expected to lose around $450 million of profits
as a result of the business interruption floods caused to their
Thailand-based suppliers.
It is vital that we internalize the costs of future environmental
damage into today’s decisions by putting an effective price
on carbon. Whilst regulation is slow, a growing number of
jurisdictions have introduced carbon pricing with carbon taxes
or cap-and-trade schemes. The most established remains the
EU Emissions Trading Scheme but moves have also been made
in Australia, California, China and South Korea among others.
Enabling better decisions by providing investors, companies
and governments with high quality information on how
companies are managing their response to climate change
and mitigating the risks from natural resource constraints has
never been more important.
CDP has pioneered the only global system that collects
information about corporate behaviour on climate change
and water scarcity, on behalf of market forces, including
shareholders and purchasing corporations. CDP works to
accelerate action on climate change through disclosure and
more recently through its Carbon Action program. In 2012, on
behalf of its Carbon Action signatory investors CDP engaged
205 companies in the Global 500 to request they set an
emissions reduction target; 61 of these companies have now
done so.
CDP continues to evolve and respond to market needs. This
year we announced that the Global Canopy Programme’s
Forest Footprint Disclosure Project will merge with CDP over
the next two years. Bringing forests, which are critically linked
to both climate and water security, into the CDP system will
enable companies and investors to rely on one source of
primary data for this set of interrelated issues.
Accounting for and valuing the world’s natural capital is
fundamental to building economic stability and prosperity.
Companies that work to decouple greenhouse gas emissions
from financial returns have the potential for both short and
long-term cost savings, sustainable revenue generation and
a more resilient future.
Paul Simpson
CEO Carbon Disclosure Project
CEO Foreword
“CDP has pioneered
the only global
system that collects
information about
corporate behaviour
on climate change
and water scarcity,
on behalf of market
forces, including
shareholders
and purchasing
corporations.”
1: The State of the Climate in 2011 report, led by the National Oceanic and
Atmospheric Administration (NOAA) in the US and published as part of the Bulletin of
the American Meteorological Society (BAMS)
4
Executive Summary
Governments have reiterated their ambition to tackle climate
change but, in 2012, their focus is on economic growth.
Business faces a period of high uncertainty, subdued growth,
and volatile commodity prices. In this context, companies are
increasingly challenged by their shareholders to demonstrate
long-term resilience. It is for these reasons that, in 2012, the
Carbon Disclosure Project (CDP) sent its annual request to
the Global 500
2
companies on behalf of 655 investors with
US$78 trillion of assets, asking them to measure and report
what climate change means for their business.
This year 81% (405) of corporations from the Global 500
responded to the CDP questionnaire. These responses
provide a valuable insight into how companies are
operating in an uncertain world. This report is based on
analysis of 379 responses received by July 1st 2012
3
and
investigates whether companies are strategically focusing
on climate change and its long-term impact.
Overall we conclude that while some companies are
demonstrating an awareness of the strategic opportunities
associated with acting on climate change, few are setting
the necessary targets or making the investments required
to ensure their long-term resilience.
At the last UN climate summit in Durban
4
, all countries
agreed to raise their ambition on climate change with the
aim of limiting warming to 2°C. PwC analysis of current
emissions trends and pledges shows that absolute
emissions reductions of around 4% per year from 2020
to 2050 will be required if the objective agreed at COP17
is to be achieved. Corporate targets do not nearly match
this level of ambition. Although 82% of companies have
set absolute or intensity emissions targets, only 20% of
companies have set targets to 2020 and beyond. The
average of the longer-term absolute targets outlined by
CDP respondents is around only a 1% reduction per year.
Governments have not translated their declaration in
Durban into more ambitious legislation, or long-term
emissions targets, at the national level. The low level of
corporate ambition is probably a reflection of this. In their
responses to CDP, 49% of companies state that regulation
is an important driver of corporate action. Conversely,
some companies report that regulatory uncertainty is a
barrier to long-term investment in mitigation technology.
Overall, the credit crunch and subsequent downturn
has proved to be effective in reducing greenhouse gas
emissions: the right kind of results, for the wrong reasons.
Total reported Scope 1 emissions have fallen from 3.6
billion metric tons CO
2
e in 2009 to 3.1 billion metric tons
CO
2
e in 2012, although a part of this is linked to a fall in the
proportion of respondents to CDP from energy intensive
sectors. Only 40% of respondents note a decrease in their
emissions that was exclusively attributable to emissions
reduction activities. Others note that cost-cutting measures
and even staff redundancies have resulted in lower
emissions. Economic activity is still closely coupled with
emissions, raising the prospect of a rebound in emissions
when countries recover from the downturn.
In spite of the economic downturn, climate change hasn’t
dropped off the board’s agenda: 96% of respondents
report that they still have board or senior executive
oversight of climate change (2011: 93%) and most
5
Executive Summary
companies have integrated climate change into their wider
business strategy (78%, up from 68% in 2011).
Recent extreme weather and natural events have tested
companies’ business resilience and increased their level of
understanding of the timeframes of the physical risks they
associate with climate change. Physical risks are viewed
as tangible and present, impacting companies’ operations,
supply chains and business planning. The majority of
companies (81%) report physical risks and the percentage
of companies that view these risks as current has nearly
quadrupled from 10% in 2010 to 37% in 2012. Insurance
company Allianz reports that in 2011 it processed $2.2billion
in natural catastrophe (including non-weather related) claims,
the largest sum for natural catastrophes in its history.
Companies are aware that acting on climate change can
result in benefits beyond short-term financial returns
or savings. 68% of respondents (2011: 58%) note
opportunities associated with customer behavior changes,
enhancing their reputation, or both.
With capital hard to come by, companies are facing
challenges justifying the business case for low carbon
investment. Companies are more likely to be successful at
raising investment for emissions reduction activities with a
long-term payback (3 years or more) when they recognize
that their climate change strategy gives them a competitive
advantage. 65% of respondents showing at least one
investment with payback of more than 3 years believe they
have a strategic advantage over their competition. This
compares with 42% of companies without any investments
with paybacks of more than 3 years.
While nearly half of responding companies (48%) identify
the potential for new products and business services as
a response to climate change, just one-fifth of companies
report a dedicated budget for low carbon product research
and development (2012: 21%, 2011: 19%).
However, leading companies are thinking long term.
Nearly all (94%) of the companies listed on the 2012
Carbon Performance Leadership Index (CPLI) state that
their long-term strategy has been influenced by climate
change compared to just half (54%) of the Global 500.
Furthermore, the percentage of CPLI companies that can
identify climate-related risks beyond a 10 year timeframe
is almost double that of non-CPLI companies (55% vs.
29). It is therefore not surprising that a larger proportion
of CPLI companies (85% vs. 60% non-CPLI) are able to
raise investment for emissions reduction activities with a
payback of more than 3 years.
Analysis of the companies that have entered either the
CPLI or the Carbon Disclosure Leadership Index (CDLI)
in the past suggests that companies achieving leadership
positions on climate change generate superior stock
performance
5
. An investment in a basket of stocks of CDLI
companies following the publication of CDP’s global report
each year since 2006 and rebalanced on an annual basis
to reflect that year’s CDLI would have generated total
returns of 67.4%, more than double the 31.1% return of
the Global 500. Moreover, past CPLI companies generated
average total returns of 15.9% since 2010, more than
double the 6.4% return of the Global 500.
Company
Name
Sector
Disclosure
Score
Performance
Band
Bayer Healthcare 100 A
Nestlé Consumer Staples 100 A
BASF Materials 99 A
BMW Consumer Discretionary 99 A
Gas Natural
SDG
Utilities 99 A
Diageo Consumer Staples 98 A
Nokia Group Information Technology 98 A
Allianz Group Financials 97 A
UBS Financials 97 A
Panasonic Consumer Discretionary 96 A
1 TOP 10 COMPANIES BY DISCLOSURE
AND PERFORMANCE
2: The Global 500 are the largest companies by market capitalization included in
the FTSE Global Equity Index Series
3: Companies that submitted responses after the analysis cut off date of July 1,
2012 are marked AQ(L) in 2012 in the Appendix
4: 17th Conference of the Parties (COP17) to the United Nations Framework
Convention on Climate Change (UNFCCC)
5: Performance of CDLI and CPLI companies is calculated on an equally-
weighted basis relative to the FTSE Global Equity Index Series and re-balanced
annually on October 1st. Therefore the 2012 CDLI and CPLI companies are
not included in this analysis. Note Results presented should not and cannot be
viewed as an indicator of future performance.
6
CDP Investor Members 2012
Aegon
AKBANK T.A.Ş.
Allianz Global Investors
Aviva Investors
AXA Group
Bank of America Merrill
Lynch
Bendigo and Adelaide Bank
Blackrock
BP Investment
Management
California Public
Employees Retirement
System - CalPERS
California State Teachers
Retirement Fund -
CalSTRS
Calvert Asset Management
Company
Catholic Super
CCLA
Daiwa Asset Management
Co. Ltd.
Generation Investment
Management
HSBC Holdings
KLP
Legg Mason
London Pension Fund
Authority
Mongeral Aegon Seguros e
Previdência S/A
Morgan Stanley
National Australia Bank
NEI Investments
Neuberger Berman
Newton Investment
Management Ltd
Nordea Investment
Management
Norges Bank Investment
Management
PFA Pension
Robeco
Rockefeller & Co.
SAM Group
Sampension KP
Livsforsikring A/S
Schroders
Scottish Widows
Investment Partnership
SEB
Sompo Japan Insurance Inc
Standard Chartered
TD Asset Management Inc.
and TDAM USA Inc.
The RBS Group
The Wellcome Trust
CDP works with investors
globally to advance the
investment opportunities
and reduce the risks
posed by climate change
by asking almost 6,000
of the world’s largest
companies to report on
their climate strategies,
GHG emissions and
energy use in the
standardized Investor
CDP format. To learn
more about CDP’s
member offering and
becoming a member,
please contact us or visit
the CDP Investor Member
section at
roject.
net/investormembers
3 2012 SIGNATORY INVESTOR
BREAKDOWN
259 Asset Managers
220 Asset Owners
143 Banks
33 Insurance
13 Other
2 CDP INVESTOR SIGNATORIES & ASSETS
(US$ TRILLION) AGAINST TIME
• Investor CDP Signatories
• Investor CDP Signatory Assets
6
39%
33%
21%
5%
2%
1 CDP INVESTOR SIGNATORIES & ASSETS
(US$ TRILLION) AGAINST TIME
• Investor CDP Signatories
• Investor CDP Signatory Assets
35 95 155 225 315 385 475 534 551 655
4.5 10 21 31 41 57 55 64 71 78
2003 2004 2005 2006 2007 2008 2009 2010 2011 2012
700
600
500
400
300
200
100
0
80
70
60
50
40
30
20
10
0
Assets (US$ Trillions)
Number of Signatories
7
655 financial institutions with
assets of US$78 trillion were
signatories to the CDP 2012
information request dated
February 1st, 2012
Aberdeen Asset Managers
Aberdeen Immobilien KAG mbH
ABRAPP - Associação Brasileira das Entidades Fechadas
de Previdência Complementar
Achmea NV
Active Earth Investment Management
Acuity Investment Management
Addenda Capital Inc.
Advanced Investment Partners
AEGON N.V.
AEGON-INDUSTRIAL Fund Management Co., Ltd
AFP Integra
AIG Asset Management
AK Asset Management Inc.
AKBANK T.A.Ş.
Alberta Investment Management Corporation (AIMCo)
Alberta Teachers Retirement Fund
Alcyone Finance
AllenbridgeEpic Investment Advisers Limited
Allianz Elementar Versicherungs-AG
Allianz Global Investors Kapitalanlagegesellschaft mbH
Allianz Group
Altira Group
Amalgamated Bank
AMP Capital Investors
AmpegaGerling Investment GmbH
Amundi AM
ANBIMA – Associação Brasileira das Entidades dos
Mercados Financeiro e de Capitais
Antera Gestão de Recursos S.A.
APG
AQEX LLC
Aquila Capital
Arisaig Partners Asia Pte Ltd
Arma Portföy Yönetimi A.Ş.
ASM Administradora de Recursos S.A.
ASN Bank
Assicurazioni Generali Spa
ATI Asset Management
ATP Group
Australia and New Zealand Banking Group Limited
Australian Ethical Investment
AustralianSuper
Avaron Asset Management AS
Aviva Investors
Aviva plc
AXA Group
Baillie Gifford & Co.
BaltCap
BANCA CÍVICA S.A.
Banca Monte dei Paschi di Siena Group
Banco Bradesco S/A
Banco Comercial Português S.A.
Banco de Credito del Peru BCP
Banco de Galicia y Buenos Aires S.A.
Banco do Brasil S/A
Banco Espírito Santo, SA
Banco Nacional de Desenvolvimento Econômico e Social
- BNDES
Banco Popular Español
Banco Sabadell, S.A.
Banco Santander
Banesprev – Fundo Banespa de Seguridade Social
Banesto
Bank Handlowy w Warszawie S.A.
Bank of America Merrill Lynch
Bank of Montreal
Bank Vontobel
Bankhaus Schelhammer & Schattera
Kapitalanlagegesellschaft m.b.H.
BANKIA S.A.
BANKINTER
BankInvest
Banque Degroof
Banque Libano-Francaise
Barclays
Basellandschaftliche Kantonalbank
BASF Sociedade de Previdência Complementar
Basler Kantonalbank
Bâtirente
Baumann and Partners S.A.
Bayern LB
BayernInvest Kapitalanlagegesellschaft mbH
BBC Pension Trust Ltd
BBVA
Bedfordshire Pension Fund
Beetle Capital
BEFIMMO SCA
Bendigo & Adelaide Bank Limited
Bentall Kennedy
Berenberg Bank
Berti Investments
BioFinance Administração de Recursos de Terceiros Ltda
BlackRock
Blom Bank SAL
Blumenthal Foundation
BNP Paribas Investment Partners
BNY Mellon
BNY Mellon Service Kapitalanlage Gesellschaft
Boston Common Asset Management, LLC
BP Investment Management Limited
Brasilprev Seguros e Previdência S/A.
British Airways Pension Investment Management Limited
British Columbia Investment Management Corporation
(bcIMC)
BT Investment Management
Busan Bank
CAAT Pension Plan
Cadiz Holdings Limited
Caisse de dépôt et placement du Québec
Caisse des Dépôts
Caixa Beneficente dos Empregados da Companhia
Siderurgica Nacional - CBS
Caixa de Previdência dos Funcionários do Banco do
Nordeste do Brasil (CAPEF)
Caixa Econômica Federal
Caixa Geral de Depositos
CaixaBank, S.A
California Public Employees’ Retirement System
California State Teachers’ Retirement System
California State Treasurer
Calvert Investment Management, Inc
Canada Pension Plan Investment Board
Canadian Friends Service Committee (Quakers)
Canadian Imperial Bank of Commerce (CIBC)
Canadian Labour Congress Staff Pension Fund
CAPESESP
Capital Innovations, LLC
CARE Super
Carmignac Gestion
Catherine Donnelly Foundation
Catholic Super
CBF Church of England Funds
CBRE
Cbus Superannuation Fund
CCLA Investment Management Ltd
Celeste Funds Management Limited
Central Finance Board of the Methodist Church
Ceres
CERES-Fundação de Seguridade Social
Change Investment Management
Christian Brothers Investment Services
Christian Super
Christopher Reynolds Foundation
Church Commissioners for England
Church of England Pensions Board
CI Mutual Funds’ Signature Global Advisors
City Developments Limited
Clean Yield Asset Management
ClearBridge Advisors
Climate Change Capital Group Ltd
CM-CIC Asset Management
Colonial First State Global Asset Management
Comerica Incorporated
COMGEST
Commerzbank AG
CommInsure
Commonwealth Bank Australia
Commonwealth Superannuation Corporation
Compton Foundation
Concordia Versicherungsgruppe
Connecticut Retirement Plans and Trust Funds
Co-operative Financial Services (CFS)
Credit Suisse
Daegu Bank
Daesung Capital Management
Daiwa Asset Management Co. Ltd.
Daiwa Securities Group Inc.
Dalton Nicol Reid
de Pury Pictet Turrettini & Cie S.A.
DekaBank Deutsche Girozentrale
Delta Lloyd Asset Management
Deutsche Asset Management Investmentgesellschaft mbH
Deutsche Bank AG
Development Bank of Japan Inc.
Development Bank of the Philippines (DBP)
Dexia Asset Management
Dexus Property Group
DnB ASA
Domini Social Investments LLC
Dongbu Insurance
DWS Investment GmbH
Earth Capital Partners LLP
East Sussex Pension Fund
Ecclesiastical Investment Management
Ecofi Investissements - Groupe Credit Cooperatif
Edward W. Hazen Foundation
EEA Group Ltd
Elan Capital Partners
Element Investment Managers
ELETRA - Fundação Celg de Seguros e Previdência
Environment Agency Active Pension fund
Epworth Investment Management
Equilibrium Capital Group
equinet Bank AG
Erik Penser Fondkommission
Erste Asset Management
Erste Group Bank
Essex Investment Management Company, LLC
ESSSuper
Ethos Foundation
Etica Sgr
Eureka Funds Management
Eurizon Capital SGR
Evangelical Lutheran Church in Canada Pension Plan for
Clergy and Lay Workers
Evangelical Lutheran Foundation of Eastern Canada
Evli Bank Plc
F&C Investments
FACEB – FUNDAÇÃO DE PREVIDÊNCIA DOS
EMPREGADOS DA CEB
FAELCE – Fundacao Coelce de Seguridade Social
FAPERS- Fundação Assistencial e Previdenciária da
Extensão Rural do Rio Grande do Sul
FASERN - Fundação COSERN de Previdência
Complementar
Fédéris Gestion d’Actifs
FIDURA Capital Consult GmbH
FIM Asset Management Ltd
FIM Services
FIPECq - Fundação de Previdência Complementar dos
Empregados e Servidores da FINEP, do IPEA, do CNPq
FIRA. - Banco de Mexico
First Affirmative Financial Network, LLC
First Swedish National Pension Fund (AP1)
Firstrand Group Limited
Five Oceans Asset Management
Florida State Board of Administration (SBA)
Folketrygdfondet
Folksam
Fondaction CSN
Fondation de Luxembourg
Forma Futura Invest AG
Fourth Swedish National Pension Fund, (AP4)
FRANKFURT-TRUST Investment-Gesellschaft mbH
Fukoku Capital Management Inc
FUNCEF - Fundação dos Economiários Federais
Fundação AMPLA de Seguridade Social - Brasiletros
Fundação Atlântico de Seguridade Social
Fundação Attilio Francisco Xavier Fontana
Fundação Banrisul de Seguridade Social
Fundação BRDE de Previdência Complementar - ISBRE
Fundação Chesf de Assistência e Seguridade Social –
Fachesf
Fundação Corsan - dos Funcionários da Companhia
Riograndense de Saneamento
Fundação de Assistência e Previdência Social do BNDES
- FAPES
FUNDAÇÃO ELETROBRÁS DE SEGURIDADE SOCIAL -
ELETROS
Fundação Forluminas de Seguridade Social - FORLUZ
Fundação Itaipu BR - de Previdência e Assistência Social
FUNDAÇÃO ITAUBANCO
Fundação Itaúsa Industrial
Fundação Promon de Previdência Social
Fundação Rede Ferroviária de Seguridade Social - Refer
FUNDAÇÃO SANEPAR DE PREVIDÊNCIA E ASSISTÊNCIA
SOCIAL - FUSAN
CDP Signatory Investors 2012
8
Fundaỗóo Sistel de Seguridade Social (Sistel)
Fundaỗóo Vale do Rio Doce de Seguridade Social - VALIA
FUNDIGUA - FUNDAầO DE PREVIDENCIA
COMPLEMENTAR DA CAESB
Futuregrowth Asset Management
Garanti Bank
GEAP Fundaỗóo de Seguridade Social
Generali Deutschland Holding AG
Generation Investment Management
Genus Capital Management
Gjensidige Forsikring ASA
Global Forestry Capital SARL
GLS Gemeinschaftsbank eG
Goldman Sachs Group Inc.
GOOD GROWTH INSTITUT fỹr globale
Vermửgensentwicklung mbH
Governance for Owners
Government Employees Pension Fund (GEPF), Republic
of South Africa
GPT Group
Graubỹndner Kantonalbank
Greater Manchester Pension Fund
Green Cay Asset Management
Green Century Capital Management
GROUPAMA EMEKLILIK A..
GROUPAMA SIGORTA A..
Groupe Crộdit Coopộratif
Groupe Investissement Responsable Inc.
GROUPE OFI AM
Grupo Financiero Banorte SAB de CV
Grupo Santander Brasil
Gruppo Bancario Credito Valtellinese
Guardians of New Zealand Superannuation
Hanwha Asset Management Company
Harbour Asset Management
Harrington Investments, Inc
Hauck & Aufhọuser Asset Management GmbH
Hazel Capital LLP
HDFC Bank Ltd
Healthcare of Ontario Pension Plan (HOOPP)
Helaba Invest Kapitalanlagegesellschaft mbH
Henderson Global Investors
Hermes Fund Managers
HESTA Super
HIP Investor
Holden & Partners
HSBC Global Asset Management (Deutschland) GmbH
HSBC Holdings plc
HSBC INKA Internationale Kapitalanlagegesellschaft mbH
HUMANIS
Hyundai Marine & Fire Insurance. Co., Ltd.
Hyundai Securities Co., Ltd.
IBK Securities
IDBI Bank Ltd
Illinois State Board of Investment
Ilmarinen Mutual Pension Insurance Company
Impax Asset Management
IndusInd Bank Limited
Industrial Alliance Insurance and Financial Services Inc.
Industrial Bank (A)
Industrial Bank of Korea
Industrial Development Corporation
Industry Funds Management
Infrastructure Development Finance Company
ING Group N.V.
Insight Investment Management (Global) Ltd
Instituto de Seguridade Social dos Correios e Telộgrafos-
Postalis
Instituto Infraero de Seguridade Social - INFRAPREV
Instituto Sebrae De Seguridade Social - SEBRAEPREV
Insurance Australia Group
IntReal KAG
Investec Asset Management
Investing for Good CIC Ltd
Irish Life Investment Managers
Itau Asset Management
Itaỳ Unibanco Holding S A
Janus Capital Group Inc.
Jarislowsky Fraser Limited
JOHNSON & JOHNSON SOCIEDADE PREVIDENCIARIA
JPMorgan Chase & Co.
Jubitz Family Foundation
Jupiter Asset Management
Kaiser Ritter Partner (Schweiz) AG
KB Kookmin Bank
KBC Asset Management NV
KBC Group
KCPS Private Wealth Management
KDB Asset Management Co., Ltd.
KDB Daewoo Securities
KEPLER-FONDS Kapitalanlagegesellschaft m. b. H.
Keva
KfW Bankengruppe
Killik & Co LLP
Kiwi Income Property Trust
Kleinwort Benson Investors
KlimaINVEST
KLP
Korea Investment Management Co., Ltd.
Korea Technology Finance Corporation (KOTEC)
KPA Pension
Kyrkans pensionskassa
La Banque Postale Asset Management
La Financiere Responsable
Lampe Asset Management GmbH
Landsorganisationen i Sverige
LBBW - Landesbank Baden-Wỹrttemberg
LBBW Asset Management Investmentgesellschaft mbH
LD Lứnmodtagernes Dyrtidsfond
Legal & General Investment Management
Legg Mason Global Asset Management
LGT Capital Management Ltd.
LIG Insurance Co., Ltd
Light Green Advisors, LLC
Living Planet Fund Management Company S.A.
Lloyds Banking Group
Local Authority Pension Fund Forum
Local Government Super
Local Super
Logos portfửy Yửnetimi A..
London Pensions Fund Authority
Lothian Pension Fund
LUCRF Super
Lupus alpha Asset Management GmbH
Macquarie Group Limited
MagNet Magyar Kửzửssộgi Bank Zrt.
MainFirst Bank AG
MAMA Sustainable Incubation AG
Man
MAPFRE
Maple-Brown Abbott
Marc J. Lane Investment Management, Inc.
Maryland State Treasurer
Matrix Asset Management
MATRIX GROUP LTD
McLean Budden
MEAG MUNICH ERGO AssetManagement GmbH
Meeschaert Gestion Privộe
Meiji Yasuda Life Insurance Company
Mendesprev Sociedade Previdenciỏria
Merck Family Fund
Mercy Investment Services, Inc.
Mergence Investment Managers
Meritas Mutual Funds
MetallRente GmbH
Metrus Instituto de Seguridade Social
Metzler Asset Management Gmbh
MFS Investment Management
Midas International Asset Management
Miller/Howard Investments
Mirae Asset Global Investments Co. Ltd.
Mirae Asset Securities
Mirvac Group Ltd
Missionary Oblates of Mary Immaculate
Mistra, Foundation for Strategic Environmental Research
Mitsubishi UFJ Financial Group
Mitsui Sumitomo Insurance Co.,Ltd
Mizuho Financial Group, Inc.
Mn Services
Momentum Manager of Managers (Pty) Limited
Monega Kapitalanlagegesellschaft mbH
Mongeral Aegon Seguros e Previdờncia S/A
Morgan Stanley
Mountain Cleantech AG
MTAA Superannuation Fund
Mutual Insurance Company Pension-Fennia
Nanuk Asset Management
Natcan Investment Management
Nathan Cummings Foundation, The
National Australia Bank
National Bank of Canada
NATIONAL BANK OF GREECE S.A.
National Grid Electricity Group of the Electricity Supply
Pension Scheme
National Grid UK Pension Scheme
National Pensions Reserve Fund of Ireland
National Union of Public and General Employees (NUPGE)
NATIXIS
Nedbank Limited
Needmor Fund
NEI Investments
Nelson Capital Management, LLC
Neuberger Berman
New Alternatives Fund Inc.
New Amsterdam Partners LLC
New Mexico State Treasurer
New York City Employees Retirement System
New York City Teachers Retirement System
New York State Common Retirement Fund (NYSCRF)
Newton Investment Management Limited
NGS Super
NH-CA Asset Management
Nikko Asset Management Co., Ltd.
Nipponkoa Insurance Company, Ltd
Nissay Asset Management Corporation
NORD/LB Kapitalanlagegesellschaft AG
Nordea Investment Management
Norfolk Pension Fund
Norges Bank Investment Management
North Carolina Retirement System
Northern Ireland Local Government Ofcers Superannuation
Committee (NILGOSC)
NORTHERN STAR GROUP
Northern Trust
Northward Capital Pty Ltd
Nykredit
Oddo & Cie
OECO Capital Lebensversicherung AG
ệKOWORLD
Old Mutual plc
OMERS Administration Corporation
Ontario Teachers Pension Plan
OP Fund Management Company Ltd
Oppenheim & Co. Limited
Oppenheim Fonds Trust GmbH
Opplysningsvesenets fond (The Norwegian Church
Endowment)
OPTrust
Oregon State Treasurer
Orion Energy Systems
Osmosis Investment Management
Parnassus Investments
Pax World Funds
Pensioenfonds Vervoer
Pension Denmark
Pension Fund for Danish Lawyers and Economists
Pension Protection Fund
Pensionsmyndigheten
Perpetual Investments
PETROS - The Fundaỗóo Petrobras de Seguridade Social
PFA Pension
PGGM Vermogensbeheer
Phillips, Hager & North Investment Management Ltd.
PhiTrust Active Investors
Pictet Asset Management SA
Pioneer Investments
PIRAEUS BANK
PKA
Pluris Sustainable Investments SA
PNC Financial Services Group, Inc.
Pohjola Asset Management Ltd
Polden-Puckham Charitable Foundation
Portfolio 21 Investments
Porto Seguro S.A.
Power Finance Corporation Limited
PREVHAB PREVIDấNCIA COMPLEMENTAR
PREVI Caixa de Previdờncia dos Funcionỏrios do Banco
do Brasil
PREVIG Sociedade de Previdờncia Complementar
ProLogis
Provinzial Rheinland Holding
Prudential Investment Management
Prudential Plc
Psagot Investment House Ltd
PSP Investments
Q Capital Partners
QBE Insurance Group
Rabobank
Raiffeisen Fund Management Hungary Ltd.
Raiffeisen Kapitalanlage-Gesellschaft m.b.H.
Raiffeisen Schweiz Genossenschaft
Rathbones / Rathbone Greenbank Investments
RCM (Allianz Global Investors)
Real Grandeza Fundaỗóo de Previdờncia e Assistờncia
Social
Rei Super
Reliance Capital Ltd
9
Resolution
Resona Bank, Limited
Reynders McVeigh Capital Management
RLAM
Robeco
Robert & Patricia Switzer Foundation
Rockefeller Financial (trade name used by Rockefeller &
Co., Inc.)
Rose Foundation for Communities and the Environment
Rothschild
Royal Bank of Canada
Royal Bank of Scotland Group
RPMI Railpen Investments
RREEF Investment GmbH
Russell Investments
SAM Group
SAMPENSION KP LIVSFORSIKRING A/S
SAMSUNG FIRE & MARINE INSURANCE
Samsung Securities
Sanlam Life Insurance Ltd
Santa Fé Portfolios Ltda
Santam
Sarasin & Cie AG
SAS Trustee Corporation
Sauren Finanzdienstleistungen GmbH & Co. KG
Schroders
Scotiabank
Scottish Widows Investment Partnership
SEB
SEB Asset Management AG
Second Swedish National Pension Fund (AP2)
Seligson & Co Fund Management Plc
Sentinel Investments
SERPROS - Fundo Multipatrocinado
Service Employees International Union Pension Fund
Seventh Swedish National Pension Fund (AP7)
Shinhan Bank
Shinhan BNP Paribas Investment Trust Management Co., Ltd
Shinkin Asset Management Co., Ltd
Siemens Kapitalanlagegesellschaft mbH
Signet Capital Management Ltd
Smith Pierce, LLC
SNS Asset Management
Social(k)
Sociedade de Previdencia Complementar da Dataprev -
Prevdata
Socrates Fund Management
Solaris Investment Management Limited
Sompo Japan Insurance Inc.
Sopher Investment Management
SouthPeak Investment Management
SPF Beheer bv
Sprucegrove Investment Management Ltd
Standard Bank Group
Standard Chartered
Standard Chartered Korea Limited
Standard Life Investments
State Bank of India
State Street Corporation
StatewideSuper
StoreBrand ASA
Strathclyde Pension Fund
Stratus Group
Sumitomo Mitsui Financial Group
Sumitomo Mitsui Trust Holdings, Inc.
Sun Life Financial Inc.
Superfund Asset Management GmbH
SUSI Partners AG
Sustainable Capital
Sustainable Development Capital
Svenska Kyrkan, Church of Sweden
Swedbank AB
Swift Foundation
Swiss Re
Swisscanto Asset Management AG
Syntrus Achmea Asset Management
T. Rowe Price
T. SINAI KALKINMA BANKASI A.Ş.
Tata Capital Limited
TD Asset Management Inc. and TDAM USA Inc.
Teachers Insurance and Annuity Association – College
Retirement Equities Fund
Telluride Association
Tempis Asset Management Co. Ltd
Terra Forvaltning AS
TerraVerde Capital Management LLC
TfL Pension Fund
The ASB Community Trust
The Brainerd Foundation
The Bullitt Foundation
The Central Church Fund of Finland
The Children’s Investment Fund Management (UK) LLP
The Collins Foundation
The Co-operative Asset Management
The Co-operators Group Ltd
The Daly Foundation
The Environmental Investment Partnership LLP
The Hartford Financial Services Group, Inc.
The Joseph Rowntree Charitable Trust
The Korea Teachers Pension (KTP)
The Pension Plan For Employees of the Public Service
Alliance of Canada
The Pinch Group
The Presbyterian Church in Canada
The Russell Family Foundation
The Sandy River Charitable Foundation
The Shiga Bank, Ltd.
The Sisters of St. Ann
The United Church of Canada - General Council
The University of Edinburgh Endowment Fund
The Wellcome Trust
Third Swedish National Pension Fund (AP3)
Threadneedle Asset Management
TOBAM
Tokio Marine Holdings, Inc
Toronto Atmospheric Fund
Trillium Asset Management Corporation
Triodos Investment Management
Tri-State Coalition for Responsible Investment
Tryg
UBS
Unibail-Rodamco
UniCredit SpA
Union Asset Management Holding AG
Union Investment Privatfonds GmbH
Unione di Banche Italiane S.c.p.a.
Unionen
Unipension
UNISON staff pension scheme
UniSuper
Unitarian Universalist Association
United Methodist Church General Board of Pension and
Health Benefits
United Nations Foundation
Unity Trust Bank
Universities Superannuation Scheme (USS)
Vancity Group of Companies
VCH Vermögensverwaltung AG
Ventas, Inc.
Veris Wealth Partners
Veritas Investment Trust GmbH
Vermont State Treasurer
Vexiom Capital, L.P.
VicSuper
Victorian Funds Management Corporation
VietNam Holding Ltd.
Voigt & Coll. GmbH
VOLKSBANK INVESTMENTS
Waikato Community Trust Inc
Walden Asset Management, a division of Boston Trust &
Investment Management Company
WARBURG - HENDERSON Kapitalanlagegesellschaft für
Immobilien mbH
WARBURG INVEST KAPITALANLAGEGESELLSCHAFT MBH
Water Asset Management, LLC
Wells Fargo & Company
West Yorkshire Pension Fund
WestLB Mellon Asset Management (WMAM)
Westpac Banking Corporation
WHEB Asset Management
White Owl Capital AG
Winslow Management, A Brown Advisory Investment Group
Woori Bank
Woori Investment & Securities Co., Ltd.
YES BANK Limited
York University Pension Fund
Youville Provident Fund Inc.
Zegora Investment Management
Zevin Asset Management
Zurich Cantonal Bank
CalSTRS (California
State Teachers
Retirement System)
“CalSTRS’ board
has made climate
risk management
the signature issue
in our corporate
governance
engagement
program. CDP data
is an essential input
and is reviewed
prior to meeting
with companies on
any issue to ensure
that the discussion
covers climate
risk if warranted.
CDP data is also
very important to
CalSTRS as we
develop and execute
our shareholder
resolutions.”
Jack Ehnes, CEO
10
At the beginning of the last century, the world’s population
numbered 1.7 billion people. Today, it’s more than 7 billion.
By 2050, we expect it to exceed 9 billion. Such growth
is putting great strains on the planet’s resources. We’ve
seen significant climate change, an increase in extreme
weather events and growing concerns, in some places,
over the long-term availability of water, food and other
key commodities. Business is having to adapt to a new
world – a world where resources and raw materials can
no longer be taken for granted. Investors have a vital role
to play in identifying and managing these new risks, but
also in seizing the opportunity to create a new, sustainable
low-carbon economy, where growth does not come at the
expense of the Earth’s shrinking resources.
Many companies, of course, are already adapting. They
are reducing carbon emissions. Devising new, more
environmentally-friendly products or services. Creating
new business models that simply did not exist twenty
or thirty years ago. In doing so, they are winning over
customers – and driving profits. A number of large listed
companies in chemicals, food manufacturing, engineering,
power generation and electronics are leading the way with
innovations that are re-shaping our economy, and opening
up new opportunities for investors.
At AEGON, we have more than EUR 420 billion in revenue-
generating investments, and have a responsibility to our
investors and policyholders to take environmental risks into
account in our investment decisions. Where necessary, we
engage with companies on how they approach the issue
of climate change and resource management. Last year,
AEGON engaged with 227 companies worldwide – many
in the mining, manufacturing, transport and energy sectors,
where environmental issues have a very real and immediate
impact. And this is where the Carbon Disclosure Project
plays a vital role – in helping investors like AEGON compare
performance, assess risk and identify opportunities.
AEGON, like many other long-term investors, is exploring
opportunities to invest more in renewable energy or more
energy efficient projects. For this kind of investment to be
viable, investors need a supportive regulatory environment –
for example, solvency requirements that do not unjustifiably
penalize long-term investments and stable tax incentives
that do not change when political circumstances change.
It’s clear to me that, in the coming years, investors will
have to work more closely than ever with governments
and regulators. Public-private partnerships, such as the
Green Investment Bank currently being proposed in the
Netherlands could be one of the solutions.
Naturally, building a more sustainable economy won’t be
easy, in view of the magnitude of the required investments.
But there are reasons to be optimistic. Encouraged by our
stakeholders – customers, employees and shareholders –
large investors such as ourselves see both the necessity
and the opportunities of investing in cleaner, greener
technologies. Through these investments, will also come a
longer-term approach, a more sustainable global economy
and more effective management of our scarce resources.
Alex Wynaendts,
CEO AEGON
Investor
Perspective
“The Carbon
Disclosure Project
plays a vital role – in
helping investors like
AEGON compare
performance, assess
risk and identify
opportunities.
11
Key Themes and Highlights
of 2012 Responses
Scale of global ambition
The 17th Conference of the Parties (COP17) to the United
Nations Framework Convention on Climate Change
(UNFCCC) last year concluded with an agreement to
launch a new process called the Durban Platform for
Enhanced Action. This will aim “to develop a protocol,
another legal instrument or an agreed outcome with legal
force” and is expected to increase mitigation ambition
with a view to limiting global warming to 2°C or 1.5°C
above pre-industrial levels. According to this ‘roadmap’, all
countries are expected to sign up to targets in 2015 which
limit or reduce their emissions from 2020.
Fulfilling the objectives of the Durban Platform will
require governments to commit to, and deliver, significant
reductions in emissions from 2020. The PwC Low Carbon
Economy Index tracks the annual carbon reductions
required by G20 countries to achieve the UN ambition
to limit temperature rise to 2°C. Recent analysis by PwC
shows that, based on current emissions trends and
pledges, countries must reduce their absolute emissions
by around 4% every year from 2020 to 2050. This will
require a radical transformation of the global economy.
Corporate reduction targets disclosed to CDP are not
nearly this radical. Although 82% of companies set
absolute or intensity emissions targets, only 20% of
companies have set targets to 2020 and beyond. The
average of the longer-term absolute targets outlined by
CDP respondents is only around a 1% reduction per year,
which is well below the level of ambition needed to limit
the temperature rise to 2°C.
Corporate approaches to setting targets vary widely
– some are absolute, others relative to revenue or
production. The proportion of companies with targets has
stayed roughly constant over the years (2007: 76% of
companies had an emissions reduction target, 2011: 74%,
2012: 82%). Some targets are ambitious, such as Nokia’s
30% absolute emissions reduction target by 2020, but
most reported targets fall some way short of this.
Since 2009, as the repercussions of the global economic
slowdown began to surface, total reported Scope 1
emissions have fallen from 3.6 billion metric tons CO
2
e
to 3.1 billion metric tons CO
2
e in 2012 (see Figure KS5
on page 36). While a small part of this is linked to a fall
in the proportion of respondents to CDP from the energy
intensive sectors (2012: 25%, 2011: 26%, 2010: 27%),
the economic downturn may have helped indirectly to
accelerate emissions reductions, with companies seeking
to lower costs through reductions in business travel,
energy efficiency improvements, production cuts or even
staff reductions. Fewer than half (40%) of respondents
noted a decrease in their emissions which was exclusively
attributable to emissions reduction activities (see Figure
5). This suggests that emissions remain closely tied to
economic activity and unless businesses make wholesale
changes to their business models, emissions will rise
again once the economy recovers.
4 COMPANIES DISCLOSING TARGETS
69 Companies with absolute and intensity targets
117 Companies with absolute target
127 Companies with intensity target
66 Companies with no targets
5 REASONS FOR DECREASES IN EMISSIONS
152 Reductions exclusively due to emissions
reduction activities
117 No reductions
76 Reductions due to emissions reduction activities
and changes in business conditions
34 Reductions exclusively due to changes in
business conditions
11
18%
40%
31%
20%
9%
18%
31%
33%
12
The debate about the relationship between the
environment and the economy continued at COP17 and
at Rio+20
6
, where business was well represented at
both events. Despite the weakened global economy and
austerity measures imposed by many governments, there
are no clear indications that climate change is a lower
priority for companies.
Climate change hasn’t dropped off the board’s agenda
during the downturn. 96% reported that they have board
or senior executive oversight of climate change (2011:
93%). Most companies have integrated climate change
into their wider business strategy (78% of respondents,
up from 68% in 2011). Of these, 65% of companies
report that climate change is influencing their near-term
strategies (2011: 63%), while 54% report changes to their
long-term strategies (2011: 48%). Additionally, as in 2011,
two-thirds describe monetary incentives that they make
available to their staff for meeting climate change-related
targets (2011: 65%). This is encouraging as senior level
oversight and financial incentives for staff and directors
are important in driving and maintaining measures to
tackle emissions.
Drivers for action
There are a number of drivers other than a global deal
which can help achieve the scale of global ambition
required to mitigate climate change. Physical changes,
regulation, stakeholder pressure and customer behavior
are all drivers for companies to take action.
Recent extreme weather events are raising awareness
of climate risks
Recent extreme weather and natural events have tested com-
panies’ business resilience and increased their level of under-
standing of the timeframes of the physical risks they identify.
81% of companies now report physical risks (see Figure 8,
2011: 71%) and companies are increasingly able to define both
the immediate and long-term timeframes of these risks (see
Figure 7). For example, Gas Natural SDG reports how extreme
weather could cause damage to their infrastructure in the im-
mediate future and interrupt gas and energy supplies, while sea
level rise could, in the long term, affect their coastal facilities.
Physical risks are viewed as tangible and real: this includes
destructive weather events, the rise in temperature and sea
level and, increasingly, water scarcity. The percentage of
companies that view physical risks as current has jumped
from 10% in 2010 to 37% in 2012. The effect of climate
change on companies’ supply chains is increasingly being
reported, with a number of companies giving clear examples
of how this has affected their business planning. Nike notes
how temperature changes can support a business case for
systemic changes in their supply chain to manage climate-
sensitive materials. Other companies are managing the
risks of extreme weather events to their operations: Vale has
invested $8 million in implementing weather-monitoring radar.
Companies are increasingly reflecting on their past
resilience to weather events and some explain how they
assess the market impact of climate change and make
this available to customers and shareholders alike. This
level of transparency is designed to increase shareholder
confidence and support finance-raising.
6 INTEGRATION OF CLIMATE CHANGE INTO
CORPORATE GOVERNANCE
7 TIMEFRAME FOR EXPECTED PHYSICAL
RISK IMPACT (NUMBER OF COMPANIES)
• 2012
• 2011
• 2010
96% (364)
Board or senior executive
oversight.
(2011: 93%, 368)
55% (211)
Board or senior
executive oversight,
monetary incentives
and integrated strategy.
(2011: 49%, 195)
57% (217)
Monetary incentives and
integrated strategy.
(2011: 52%, 206)
63% (238)
Board or senior
executive oversight
and monetary
incentives.
64% (244)
Monetary incentives.
(2011: 65%, 259)
78% (297)
Integrated strategy.
(2011: 68%, 269)
76% (287)
Integrated strategy
and board or
senior executive
oversight.
40
35
30
25
20
15
10
5
0
Current
1-5 years
6-10 years
>10 years
Unknown
12
6: United Nations Conference on Sustainable Development
10%
8%
5%
9%
37%
30%
18%
15%
20%
32%
37%
24%
19%
25%
28%
13
Companies need clarity on regulation
While clear government regulations can drive action (Figure
10 shows that 49% see compliance with regulation as a
key driver), policy uncertainty is a barrier and can increase
costs. The lack of clarity surrounding regulation after UN
summits, whether in Copenhagen, Durban or Rio, is a real
barrier to action. Uncertainty about when or how politicians
will intervene hinders investment in emissions reductions.
The recent fall in the EU Allowance price and the potential
for government intervention is a good example of this.
Siemens notes how the lack of a ratified climate change
agreement and regional political uncertainty may lead to
higher energy and electricity prices.
Companies require a longer-term, stronger price signal
in order to make their return on investments more
predictable: for example, both AngloGold Ashanti and
Deutsche Bank note the effect of regulatory uncertainty on
delaying investment decisions.
Stakeholder pressure is driving companies to act
Reputation and positive stakeholder engagement are
seen as key drivers for action on climate change, with
companies aware of the benefits beyond short-term
financial returns or savings. 68% of respondents (2011:
58%) note the opportunities associated with customer
behavior changes, enhancing their reputation, or both.
Logica reports how its key stakeholders are increasingly
expecting it to operate in a way which is economically,
socially and environmentally sustainable. It notes that
meeting these expectations helps it to function more
successfully, attract and keep high caliber people and
retain key contracts.
This also shows that companies are aware of how
their revenue can be affected by customer behavior
and investor interest. Some see longer-term financial
opportunities in developing a ‘low carbon’ brand.
Beyond simply reducing their emissions, Nestlé and
Siemens describe their efforts to make a positive impact
through ‘creating shared value’, i.e. recognizing that their
competitiveness and the long-term prospects of society
are mutually dependent. Siemens, for instance, has
developed an environment portfolio which shows the net
environmental effect of all of its products. It states that
41% of revenue comes from products with a net positive
impact on the environment, relative to a benchmark.
Responses show that companies are regularly reporting
risks associated with their supply chain or with their
clients. For example, 17% of respondents note indirect
reputational and consumer behavior risks from climate
change (21% of all reputational and consumer behaviour
risks reported) and 34% report indirect physical risks
(30% of all physical risks reported). Understanding and
managing risks throughout the entire value chain is
necessary for true business resilience. Swiss Re notes the
high risk of losing socially-responsible investors if it did
not act in the spirit of its public stance on climate change.
Time Warner also highlights the importance of corporate
responsibility: acting as a responsible environmental
steward and working to reduce its overall emissions is part
of the effort to deliver superior returns to its stockholders
and exceptional value to its customers in a sustainable
and long-term way.
8 PERCENTAGE OF COMPANIES REPORTING
RISKS AND OPPORTUNITIES
• 2012 Respondents (379)
• 2011 Respondents (396)
9 PROPORTION OF DIRECT AND INDIRECT
RISKS & OPPORTUNITIES
• Direct
• Indirect (Client)
• Indirect (Supply chain)
100
80
60
40
20
0%
Risks Risks
Physical Physical
Regulatory Regulatory
Reputation & change in consumer behavior Reputation & change in consumer behavior
100 10080 80
60 6040 40
20 200%
Opportunities Opportunities
20
40
60
80
100
13
81%64%
71%
70%
80%
69%
78%
12%
11%
79%
18%
12%
79%
18%
9%
18% 3%
14%
10%
20% 1%
66%
76%
75%
65%
77%
76%
25%
21%
23%
27%
21%
23%
9%
4%
1%
8%
2%
1%
55%
83%80%
73%76%
63%
52%
58%
68%
2012
2012
2012
2011
2011
2011
14
The finance function is responsible for driving growth
across Diageo and is fundamental to successfully
embedding sustainability in the business in a robust and
efficient way for the long term. Key to this efficiency is the
environmental performance of our production assets – in
terms of carbon, water and waste performance – and our
ability to decouple the impact we have on the environment
from our continued increase in production to support
business growth. Our focus is less on payback periods
and more on targeting environmental investments to be
‘value positive’.
Some decisions on energy efficiency related capex are
straight forward as they meet traditional ROI criteria
– typically fewer than four years. Take the £700,000
we invested in a range of energy efficiency projects at
Cameronbridge distillery. This reduced carbon emissions
by 3,000 tonnes per year and drove annual savings of
£1.4m – a payback of six months.
In contrast, Roseisle distillery, the first major distillery to be
built in Scotland for 30 years, and we believe Scotland’s
most sustainable, cost £45m overall – and the bioenergy
plant which generates renewable energy from the co-
products of distilling cost £17m. This total investment
funded cutting edge green technology combined with
traditional distilling methods. Currently the distillery is
using 50% less fossil fuel than a comparable site. This
represents a £900,000 annual saving in energy costs to the
combined malting and distilling operations – approximately
12% of total energy costs and a 17 year payback based
on current fossil fuel prices.
The investment removes our exposure to future fossil fuel
price rises impacting on our unit cost. There is a focus
on calculating the net present value of the investment in a
discounted cash flow model rather than focusing solely
on the short term payback. If we can deliver a better
than value neutral outcome now, future fossil fuel price
trends will enhance that value going forward. While
the financial returns are longer in this case, the security
of energy supply in terms of both avoiding possible
intermittent disruptions and longer term supply issues,
together with the better management of our input costs
in the future are equally, if not more, important to the
long-term performance and growth of our business,
which is our ultimate goal.
Understanding and quantifying the benefits that aren’t
directly related to cost savings is the biggest challenge
to assessing the business case for environment related
investments. Factoring in possible future energy prices
and the potential cost to the business associated with
intermittent disruptions to energy supplies is an example
of this financing challenge. Traditional approaches
cannot always incorporate these important influencing
factors – therefore to understand the full implications
of an investment decision a more flexible approach is
required.
In my view, effective management is about making
choices that support the efficient growth of the
business over the long term. It is insufficient, and even
irresponsible, to consider only short term payback when
making investment decisions. This is entirely consistent
with embedding a business model that is genuinely long-
term and sustainable and reflects our commitment to
holistic management.
Deirdre Mahlan, CFO
Diageo
CFO Perspective
“It is insufficient,
and even
irresponsible,
to consider only
short term payback
when making
investment
decisions.”
14
15
Dedicated budget for energy efficiency
Compliance with regulatory requirements/standards
Employee engagement
Internal incentives/recognition programs
Financial optimization calculations
Dedicated budget for other emissions reduction activities
Dedicated budget for low carbon product R&D
Partnering with governments on technology development
Lower return on investment (ROI) specification
Internal finance mechanisms
Internal price of carbon
Marginal abatement cost curve
Other
Companies reporting an activity with payback > 3yrs (235)
Companies not reporting an activity with payback > 3yrs (145)
Unlocking investment
With capital hard to come by, companies are facing
challenges justifying the business case for low carbon
investment.
To tackle this, companies are adopting a number of
approaches to drive low carbon investment. These
include: setting aside a dedicated budget for energy
efficiency (50% of companies); complying with regulatory
requirements/standards (49% of companies); engaging
with employees (44%); and creating internal incentives/
recognition programs (30%) (see Figure 10).
Investments in emissions reduction activities with faster
paybacks (see Figure 12) should be easier to justify.
Companies are more likely to be successful at raising
investment for emissions reduction activities with a long-
term payback (3 years or more) when they recognize that
their climate change strategy gives them a competitive
advantage. 65% of respondents showing at least one
investment with payback of more than 3 years believe they
have a strategic advantage over their competition. This
compares with 42% of companies without any investments
with paybacks of more than 3 years (see Figure 11).
Some companies describe how providing high-quality, exter-
nally verified information, which they know will be reported to
investors and analysts, can facilitate internal investment deci-
sions. Repsol states that obtaining independent verification
against an approved assurance standard promotes the de-
velopment and implementation of greenhouse gas emissions
reduction opportunities throughout their company. 55% of
respondents obtained independent verification or assurance
of their emissions in 2012 (2011: 39%)
7
.
10 METHODS TO DRIVE INVESTMENTS IN
EMISSIONS REDUCTION ACTIVITIES
Percentage of responding companies (%)
11 LONG-TERM INVESTMENTS COMBINED WITH
STRATEGIC ADVANTAGE
• Proportion noting strategic advantage
• Proportion not noting strategic advantage
“In 2011 we invested $306 million in
research and development and we
have maintained that level of spend
despite the economic slowdown,
because we believe innovation
will drive our future success and
support our customers in their
sustainability goals.”
ArcelorMittal
15
65%
51%
49%
44%
30%
28%
23%
21%
20%
15%
14%
11%
11%
25%
42%
35%
58%
7: Refers to those companies gaining full points for verification of their Scope
1, Scope 2 or Scope 3 emissions (includes verification complete
and verification underway with last year’s statement available).
16
more green products for both business communication
and home entertainment. Investments in new, potentially
higher-risk, climate change mitigation projects can
generate a strong leadership position. For example, EDF
launched a new ‘managing consumption’ product line
which has attracted 120,000 new customers.
The emergence of a new business as usual?
A 2012 Harvard Business School paper suggests that
corporate short-termism is associated with greater
risk and stock market volatility
8
. The Kay Review
9
,
published earlier this year, found that short-termism is
a problem, negatively impacting the UK equity market’s
ability to “enhance the performance of UK companies
and to enable savers to benefit from the activity of
these businesses through returns to direct and indirect
ownership of shares in UK companies”. Achieving
business resilience to market changes is a greater
challenge for companies during times of uncertainty,
yet the need for companies to adopt a robust long-term
strategy is more crucial than ever.
Corporations listed on the Carbon Performance
Leadership Index (see Page 26) are recognized as having
maturity in climate change management. Further analysis
of these companies, however, reveals they may also be
more resilient through an awareness of long-term climate
change risks and opportunities and integration of these
considerations into their strategic thinking.
Nearly all (94%) of the companies listed on the 2012 CPLI
have a long-term strategy that has been influenced by
climate change. This figure is closer to half (54%) when
Companies which deliver products or services that
reduce carbon emissions are seeing distinct potential
growth opportunities. For example, Bayer notes that
climate change is a core element of its sustainable
business strategy, which sees it go beyond energy
savings by focusing on growth in climate-related product
lines. Chunghwa Telecom notes the increased business
opportunities for its products and services in providing
13 CDLI [2006-2012] RETURNS AGAINST OVERALL GLOBAL 500 POPULATION
10
• CDLI
• G500
-40
-20
0
20
40
60
80
100
23/07/12
02/04/12
02/01/12
03/10/11
01/07/11
01/04/11
03/01/11
01/10/10
01/07/10
01/04/10
01/01/10
01/10/09
30/06/09
01/04/09
01/01/09
01/10/08
01/07/08
01/04/08
01/01/08
01/10/07
02/07/07
02/04/07
01/01/07
02/10/06
03/07/06
03/04/06
02/01/06
03/10/05
<1 year
1-3 years
>3 years
Behavioral change 69% 15% 16%
Energy efficiency: building fabric 15% 33% 52%
Energy efficiency: building services 20% 45% 35%
Energy efficiency: processes 24% 44% 33%
Fugitive emissions reduction 13% 45% 42%
Low carbon energy installation 9% 18% 72%
Low carbon energy purchase 39% 21% 40%
Process emissions reduction 22% 20% 58%
Product design 34% 30% 36%
Transportation: fleet 41% 19% 39%
Transportation: use 50% 29% 21%
12 PAYBACKS BY EMISSIONS REDUCTION
ACTIVITIES
16
Total Return % (US$)
17
looking at the Global 500 sample as a whole, suggesting
that an effective and transparent climate change policy can
help companies to practice a long-term approach.
Similar patterns are noted when assessing other examples
of long-term thinking. The percentage of CPLI companies
that can identify climate-related risks beyond a 10 year
timeframe is almost double that of non-CPLI companies
(55% vs 29%). The same is true of identifying opportuni-
ties with timeframes of more than 10 years (30% vs 15%).
With a greater awareness of climate change risks and op-
portunities, a larger proportion of CPLI companies (85% vs
60%) are able to raise investment for emissions reduction
activities with a payback longer than 3 years.
Annual analysis of the companies that have achieved
leadership positions on either the CPLI or the Carbon
Disclosure Leadership Index (CDLI) in the past suggests
that companies that achieve leadership positions in climate
change generate superior stock performance (see Figures
13 & 14). Since 2006, CDLI companies delivered total
returns of 67.4%, more than double the 31.1% return of the
Global 500. Moreover, CPLI companies generated average
total returns of 15.9% since 2010, more than double the
6.4% return of the Global 500 index.
While equity market performance is influenced by a broad
range of quantitative factors, including country, sector and
financial performance, as well as qualitative considerations
such as company management, governance and risk
management, this analysis suggests a correlation,
although not a causality, between financial performance
and good climate change performance and disclosure.
“These [climate change] initiatives
are intended to develop a
competitive advantage by better
incorporating environmental
considerations into AXA’s
products, tap into new markets as
well as reduce operational risks
and enhance AXA’s image and
reputation.”
AXA Group
14 CPLI [2010-12] RETURNS AGAINST OVERALL GLOBAL 500 POPULATION
10
• CPLI
• G500
-15
-10
-5
0
5
10
15
20
25
30
35
02/07/12
01/06/12
01/05/12
02/04/12
01/03/12
01/02/12
02/01/12
01/12/11
01/11/11
03/10/11
01/09/11
01/08/11
01/07/11
01/06/11
02/05/11
01/04/11
01/03/11
01/02/11
03/01/11
01/12/10
01/11/10
01/10/10
8: Francois Brochet, Maria Loumioti and George Serafeim, Short-termism, Investor
Clientele, and Firm Risk, Harvard Business School (January 2012).
9: John Kay, The Kay Review of UK Equity Markets and Long-Term Decision Making,
Final Report (July 2012)
10: Total Return includes interest, capital gains, dividends and distributions realized over
a given period of time. Bloomberg, Carbon Disclosure Project. Note: Results presented
should not and cannot be viewed as an indicator of future performance. Performance of
CDLI and CPLI companies is calculated on an equally-weighted basis relative to the FTSE
Global Equity Index Series and re-balanced annually on October 1st. Therefore, the 2012
CDLI & CPLI companies are not included in this analysis. Please refer to the important
notices on the contents page of this report regarding its content and use in publications.
17
Total Return % (US$)
18
Average
Energy
Materials
Utilities
Some scientists are now linking severe weather events,
which have significant cost implications for companies
globally, to higher concentrations of greenhouse gases
11
.
Insurance company Allianz reports that in 2011 it processed
$2.2 billion [€1,764 million] in natural catastrophe (including
non-weather related) claims. This is the largest sum for
natural catastrophes in its history. The floods in Thailand
in that year caused significant physical damage and
major disruption to supply chains. Daimler references the
interruptions to the automotive supplier industry caused
by the floods, while Hewlett-Packard and Dell outline the
shortage of critical components and materials caused by
this natural disaster. Combined estimates from insurance
groups put the total cost of floods at $15bn to $20bn.
Unpredictable weather challenges companies in a variety
of ways. Samsung Electronics reports that potential tropical
cyclones pose a risk estimated at almost $80 million [90
billion KRW] per day as a result of the disruption to its
manufacturing processes. Iberdrola and Royal Dutch Shell
cite that more frequent tornadoes in the Gulf of Mexico
are likely to increase interruptions to business operations.
Swisscom notes that changes in mean and extreme
temperatures could lead to increases in energy-related
operational costs of $2.5 million [2.4 million CHF]. Aon report
that an extended bout of bitter cold and snow engulfed
Eastern Europe between the end of January and the first half
of February and cost an estimated $660 million
12
.
Reporting companies acknowledge the effect that a
depleting supply of natural resources, coupled with an
increasing demand, can have on commodity prices and
operating costs. GlaxoSmithKline states that low water
supplies could shut down manufacturing operations, with
a financial impact of around $800 million [£500 million].
Fluctuating fuel prices also present challenges for
companies. Figure 15 demonstrates that some sectors are
particularly exposed to risk related to rising energy costs,
with the utilities sector having four times higher fuel costs
than the average company. However, companies that
can successfully make the business case to reduce their
fuel use are making investments which yield high returns.
UPS, for example, has invested $1.2 billion in upgrading
its transportation fleet and is saving $400 million a year.
Air Liquide has optimized the way its gases are delivered
worldwide and expects to make annual savings of $500
million [€420 million].
Despite the high percentage of companies reporting
opportunities as a result of acting on climate change,
only a small number of companies are able to unlock
investment with long-term paybacks. For example, while
nearly half (48%) have identified the potential for new
products and business services as a response to climate
change, just one-fifth of companies report a dedicated
budget for low carbon product research & development
(2012: 21%, 2011: 19%).
Those companies that can identify value in investing in low
carbon products, however, report significant investments.
Dell is investing in developing new products designed to
reduce its customers’ emissions by more than 10 million
metric tons of CO
2
e per year and expects to save customers
just over $1billion per year as a result. Some companies are
successfully using low carbon products to reduce their own
emissions and implement dramatic cost savings.
15 PERCENTAGE OF OPERATING COSTS SPENT
ON ENERGY [HIGHEST 3 SECTORS]
13
0 5 10 15 20 25 30 35
9%
13.7%
17.3%
31.8%
18
19
In order to protect their investments, shareholders want to
understand the risk climate change presents to their port-
folios. Companies are expected to demonstrate long-term
resilience and in order to effectively respond to the risks
and opportunities related to climate change, businesses
need to be strategic, not reactive.
Fulfilling the mitigation objectives of the Durban Platform
for Enhanced Action will require a radical transformation
of the global economy. Companies will have to set and
achieve emissions reduction targets which are far more
ambitious than currently reported.
The risks associated with the physical effects of climate
change are increasingly perceived as immediate rather
than unknown. The cost of recent severe weather events
has been significant for companies and they will be
expected to understand the potential implications from
future events and show these are being mitigated.
Those companies that have an awareness of long-term
climate change risks and opportunities reflected in their
business strategy will gain strategic advantage over their
competitors. Increasingly companies are reporting that
they see opportunities as a result of acting on climate
change and this year’s responses provide evidence of
the growth in green product lines and investments in
emissions reduction activities which yield high returns.
“Changing temperatures and
precipitations patterns may lead
to decreased availability of critical
raw materials in the supply chain,
especially agricultural commodities.
These will lead to the increased
operational cost or even disrupt
the business operations along the
entire value chain of Nestlé.”
Nestlé
“[Reckitt Benckiser’s] target was
to reduce its global products
total carbon footprint by 20% per
unit dose by 2020 against 2007
baseline. In 2011, emissions had
been cut by 21%, achieving our
goal 8 years early.”
Reckitt Benckiser
19
11: Perception of climate change, James Hansen, Makiko Satoa and Reto
Ruedyb, published in the National Academy of Sciences’ Proceedings of the
National Academy of Sciences magazine (August 2012).
12: AON reference for $660million: benfield.com/
Documents/201202_if_monthly_cat_recap_february.pdf
13: The data on the proportion of operational spend is collected in bands. To
generate this figure, the mid range of each 5% band has been used.
20
Whatever you thought about the outcome of the UN
conference on sustainable development in June, one thing
was clear from Rio+20: natural capital accounting is the
next big thing in the world of sustainability. Governments
and NGOs are pushing for it, companies are interested in it
and a few leaders are even trying to implement it.
In a world where resource scarcity is becoming increas-
ingly important to companies – as outlined in this year’s
Global 500 CDP report – a strategic way of evaluating
environmental impact is critical.
But what is natural capital and how do we account for it?
Is this another short-term fad or will it help us save the
planet?
Background
PwC has been working with the global leaders in this field,
supporting initiatives such as TEEB, to help define and
measure natural capital. There are four natural capital ac-
counting categories (air, water, land and biodiversity) and
all are interdependent. These provide us with the crucial
renewable and non-renewable resources and environmen-
tal services which benefit society.
Our ability to account for these environmental assets and
their rate of depletion (commonly referred to as stocks
and flows) is variable. In a limited number of cases (such
as fossil fuels) our thinking is already advanced. However,
we are failing to account for many more environmental
services, especially those which are less visible. Why
should this be critically important to all of us?
Understanding overall stocks of natural capital and
monitoring stock changes is vital at a national level.
This informs policy interventions and highlights whether
countries are really creating new wealth and well-being, or
simply converting one form of capital (natural) into another
(e.g. financial or engineered).
Correctly undertaken, this identifies if ‘critical natural
capital’ is being lost – i.e. are our actions truly sustainable?
What is the corporate context?
Contrary to much current discussion, accounting for
natural capital stocks at a company level is generally of
little benefit.
Aside from agriculture and a few other primary industries
(such as forestry and extractive industries), the natural
capital under direct company control is typically a tiny
fraction of that under their indirect influence (e.g. via
supply chains). It is far more pertinent for companies to
look at their annual impact on both stocks and flows from
the four natural capital categories across their entire value
chain.
These impacts stem from a company’s net deficit when
comparing the resources it uses and the waste it creates
(including emissions/pollutants), with the benefits of
any remediation efforts it makes. These represent its
contribution to nature’s profit & loss account which,
in turn, drives changes in nature’s balance sheet. We
recently worked with Puma in developing the world’s
first corporate environmental profit & loss account,
valuing their operational and supply chain impact at
€145million. This analysis offered a real insight into the
environmental consequences of commercial decisions. It
also highlights the potential commercial consequences of
the environmental realities unfolding globally.
In short, corporate natural capital accounting is really
about making significant improvements to the scope
of company environmental accounting and reporting,
as opposed to an entirely new concept. Almost all
companies would benefit from measuring their impact
more effectively. In doing so, they will better understand
which impacts and which natural resources and services
are strategically important to their businesses in the short
and long term – and so be able to focus on them. We
know that 53 companies mentioned water scarcity as a
potential critical issue to their business continuity in their
2012 CDP responses: companies clearly know this is
important. Now is the time to take action.
How should we measure it?
Companies find the sheer number of environmental
indicators hard to keep up with, which makes it difficult
for them to define where they should focus their effort. For
example, which of these has the greater impact: producing
an extra ton of waste or using another cubic metre of
water? Without converting the data in to a common
unit of measure, direct comparison of relative impact is
impossible.
Valuing impacts in monetary terms delivers environmental
information in a form that executive boards and senior
decision makers understand. It puts hitherto poorly
understood metrics into a commonly understood currency
($, €, £, etc) and into a single unit of measurement, for
comparability.
And although some promising practical work is on-going,
much of the benefit of corporate natural capital accounting
is still being missed. Many companies are failing to see
how these additional insights can drive an improvement in
risk management or identification of areas for competitive
advantage. And many investors still appear to be paying
lip service to natural capital accounting. Thankfully,
despite this lack of interest, leading companies are already
changing the way they do business.
What should governments be doing?
Several governments have natural capital accounting
frameworks currently under development. The use of a
broader range of measures of growth, sometimes referred
to as “GDP+” (which the UK government has committed
to implementing by 2020), will measure not only a
country’s economic growth but also other indicators of its
well-being, such as its natural and social capital.
However, natural capital accounting frameworks will need
the flexibility to be broken down, so that links between
national, sector or even business level can be identified.
Corporate Natural
Capital Accounting
20
21
In this way, corporate activity can be linked to more
comprehensive measures of country level prosperity.
This, in turn, will enable national accounts to be validated
“bottom-up’’. Armed with this information, regulators will
be able to design better policies which will genuinely sup-
port the public and private sectors to limit their depletion,
or even support their replenishment, of our natural capital
stocks.
What should companies be doing?
Over time, we will see companies make radical changes
to their environmental accounting for emissions and
resource use along their entire value chain. This is likely
to be combined with the monetary valuation of the
associated impacts on society to provide the crucial link
between environmental metrics and human well-being.
Coupled with country level data on natural capital stocks,
companies will be able to prioritize what is of strategic
importance to them.
Companies that embrace natural capital accounting are
likely to come to grips earlier with the major challenges
and opportunities of the 21st century, as outlined by
company responses to CDP: climate change, resource
scarcity and energy security. The road to take is clear and
specific and global steps need to be taken now.
Malcolm Preston
Global Leader, Sustainability & Climate Change, PwC
“Over time, we will
see companies make
radical changes to
their environmental
accounting for
emissions and
resource use along
their entire value
chain.”
21
22
2012 Leaders
Introduction to the Carbon Disclosure Leadership
Index (CDLI) and the Carbon Performance Leadership
Index (CPLI)
Each year, company responses are reviewed, analyzed
and scored for the quality of disclosure and performance
on actions taken to mitigate climate change. The highest
scoring companies for disclosure and/or performance
enter the CDLI and the CPLI.
What are the CDLI and CPLI criteria?
To enter the CDLI, a company must:
• MaketheirresponsepublicandsubmititviaCDP’s
online response system
• Achieveascorewithinthetop10%ofthetotalGlobal
500 population (51 companies in 2012)
To enter the CPLI (Performance Band A), a company must:
• MaketheirresponsepublicandsubmititviaCDP’s
online response system
• Attainaperformancescoregreaterthan85
• Scoremaximumperformancepointsonquestion13.1a
(absolute emissions performance for GHG reductions
due to emissions reduction actions over the past year)
• DisclosegrossglobalScope1andScope2gures
• Scoremaximumperformancepointsforvericationof
Scope 1 and Scope 2 emissions
Note: Companies that achieve a performance score high
enough to warrant inclusion in the CPLI but do not meet all
of the other CPLI requirements are classed as Performance
Band A- but are not included in the CPLI.
Why are the CDLI and CPLI important to investors?
Analyses of the CDLI and CPLI provide insights into the
characteristics and common trends among the leading
companies on carbon disclosure and performance.
They highlight good practices in reporting, governance,
risk management, verification and emissions reduction
activities toward climate change adaptation and
mitigation.
Additionally, good carbon management and disclosure
may be an indicator of superior, forward-looking
management with a better understanding of their
risk profile. The relationship between CDLI and CPLI
companies shows how companies with better data can
drive value-adding activities.
Companies in the CDLI and CPLI typically show a deeper
understanding of, and address more pro-actively, the risks
and opportunities presented by climate change. Their
transparency and willingness to disclose information is
attractive to investors.
For further information on the CDLI and the CPLI and how
scores are determined, please visit roject.
net/guidance
23
Sector Company Name
Disclosure
Score
Consecutive
years in the
CDLI
Performance
Band
Consumer Discretionary BMW 99 2 A
Daimler 99 1 A-
Philips Electronics 98 2 A-
TJX Companies 97 1 B
Honda Motor Company 96 1 B
Panasonic 96 3 A
Home Depot 95 1 B
News Corporation 95 3 B
Consumer Staples Nestlé 100 3 A
Diageo 98 1 A
Danone 97 1 B
The Coca-Cola Company 96 1 B
L’Oreal 94 1 B
PepsiCo 94 2 B
Energy Repsol 98 1 A-
Hess 97 4 B
Spectra Energy 95 1 B
Financials Allianz Group 97 2 A
UBS 97 2 A
Goldman Sachs Group 95 1 B
Swiss Re 95 2 B
Wells Fargo 95 1 A
Ace 94 1 A
Health Care Bayer 100 5 A
Gilead Sciences 96 2 B
Industrials UPS 99 2 B
Siemens 98 5 A-
Deutsche Post 97 3 B
CSX 95 1 B
Saint-Gobain 95 3 B
Information Technology Microsoft 99 1 B
Nokia Group 98 1 A
Sony Corporation 97 2 B
Cisco Systems 96 5 B
Samsung Electronics 96 4 B
Google 95 1 B
Wipro 95 1 B
Materials BASF 99 5 A
Anglo Platinum 96 1 B
Air Products & Chemicals 95 2 B
Praxair 95 4 A-
Anglo American 94 1 A
E.I. du Pont de Nemours 94 1 B
POSCO 94 1 B
Telecommunication Services AT&T 95 1 B
Koninklijke KPN 94 1 A
Utilities Gas Natural SDG 99 1 A
Power Assets Holdings 99 1 B
Fortum 98 2 B
Centrica 96 5 B
Iberdrola 95 1 A
Exelon 94 1 A
2012 Leaders CDLI
16 THE GLOBAL 500 CDLI 2012
24
In order to enter the CDLI this year, companies needed a
disclosure score of 94 or above (2011: 90). Two companies
scored full marks for disclosure (Bayer and Nestlé). For
leaders, the high scores reflect their deep, long-term
understanding of how they manage the climate risks to
their business and disclose this to their stakeholders.
The majority (28 companies) of this year’s CDLI were
not in the CDLI last year. By improving their disclosures
so significantly, today’s leaders are learning from others
and are updating their strategies accordingly. This also
shows that no company can rest on its laurels: adapting to
climate change is as crucial and fast-moving as adapting
to other external elements. Geographically, 13 countries
are in this year’s CDLI. Germany and Finland are the most
over-represented countries in the CDLI relative to their
overall representation in the responding population (see
Figure 17). Only one of the 15 responding companies from
the BRICs region made it into the CDLI.
CDLI companies are prepared for climate change: they
state, almost without exception, that they have a strategic
advantage from climate change (CDLI: 90%, non-CDLI:
59%). For example, Google notes that securing stable
renewable electricity prices over the long term (more
than 20 years) lowers its operational costs relative to
competitors’ and protects it against future hikes in
baseline electricity prices. UPS believes its climate change
strategy results in gaining strategic advantages over its
competitors and, subsequently, will win customers who
desire to use more efficient, less carbon intensive logistics
services.
CDLI companies significantly outperform the rest in their
understanding of the risks and opportunities presented
by climate change and how they quantify and manage
these in their business (CDLI: 94%, non-CDLI 65%).
For example, Nestlé sees that changes in extreme
temperatures may favor the growth of certain agricultural
raw materials. To seize this opportunity, it works to ensure
the development of resilience among its suppliers and
makes significant contributions to smallholder farmers to
develop long-term relationships.
The vast majority (see Figure 18) are already verifying
their Scope 1 and 2 emissions (approximately double the
verification for non-CDLI companies). This ensures high
quality data is used to develop their long-term strategies.
94% of CDLI companies are also already measuring
some of their Scope 3 emissions to provide a better
understanding of their overall impact on the environment.
17 PERCENTAGE OF COMPANIES IN THE CDLI
BY COUNTRY
• CDLI %
• % of G500 Respondents
18 CDLI VS. NON-CDLI METRICS
• CDLI
• Non-CDLI
Finland
France
Germany
Disclose
Scope 1 + 2
Disclose
Scope 3
Verify
Scope 1+2
Verify
Scope 3
Hong Kong
India
Japan
Netherlands
South Africa
South Korea
Spain
Switzerland
United Kingdom
USA
40
35
30
25
20
15
10
5
0%
100
80
60
40
20
0%
24
100%
96%
94%
96%
45%
84%
23%
39%
25
16 of this year’s CDLI companies are also in the CPLI
(2011: 23). It is interesting to note the following areas,
which are not key criteria for disclosure scores, where
CDLI companies outperform non-CDLI companies.
• 96%ofCDLIcompanieshaveintegratedclimate
change into their strategy (non-CDLI: 76%)
• 92%havemonetaryincentivesinplacetomanage
climate change within the company (non-CDLI: 60%)
• 100%ofCDLIcompanieshaveemissionsreduction
targets (non-CDLI: 74%). CDLI companies are, on
average, reporting emissions reduction targets for 2020
and beyond almost twice as often as non-CDLI
companies (CDLI: 32%, non-CDLI: 18%)
The average (post-2020) absolute GHG emissions
reduction target of leading companies rounds to the
same as the overall responding population’s target (1%)
reduction per year but is actually slightly lower. This
re-affirms that company ambition, even for the CDLI
companies, is significantly below the target outlined by
PwC’s Low Carbon Economy Index (4% reduction every
year from 2020 to 2050) which is required to limit global
warming to 2°C by 2050
19 DISCLOSURE SCORES FOR CDLI AND
NON-CDLI COMPANIES BY CATEGORIES
• CDLI
• Non-CDLI
• All
“Bayer’s emissions reduction
targets are cascaded down
through the organization and
translated into energy efficiency
targets for energy/site managers.
These energy efficiency targets
form part of the performance
indicators within their variable
income component.”
Bayer
“Iberdrola integrates climate
change issues as a transversal
element of risk and opportunity in
its business plans”
Iberdrola
“Improved energy efficiency is
an important R&D theme for all
Honda products. In automobiles,
application of the original Honda
IMA hybrid system is expanding”
Honda Motor Company
Opportunities
Disclosure
Emissions
Management
Disclosure
Emissions
Reporting
Disclosure
Governance
and Strategy
Disclosure
Risks
Disclosure
Verification and
Stakeholder
Engagement
100
80
60
40
20
0
25
92
59
63
98
80
82
100
91
92
98
85
87
94
65
69
97
60
67