Arsenic mobility in groundwater surface water systems in carbonate rich pleistocene glacial drift aquife
Bạn đang xem bản rút gọn của tài liệu. Xem và tải ngay bản đầy đủ của tài liệu tại đây (964.67 KB, 19 trang )
Arsenic mobility in groundwater/surface water systems in
carbonate-rich Pleistocene glacial drift aquifers (Michigan)
Kathryn Szramek
a,
*, Lynn M. Walter
a
, Patti McCall
b
a
Department of Geological Sciences, 2534 C.C. Little Bldg., University of Michigan, Ann Arbor, MI 48109, USA
b
Insight Environmental Services, Inc., 5892 Sterling Drive, Howell, MI 48843, USA
Abstract
Within the Lower Peninsula of Michigan, groundwaters from the Marshall Formation (Mississippian) contain As
derived from As-rich pyrites, often exceeding the World Heath Organization drinking water limit of 10 mg/L. Many
Michigan watersheds, established on top of Pleistocene glacial drift derived from erosion of the underlying Marshall
Formation, also have waters with elevated As. The Huron River watershed in southeastern Lower Michigan is a well
characterized hydrogeochemical system of glacial drift deposits, proximate to the Marshall Fm. subcrop, which hosts
carbonate-rich groundwaters, streams, and wetlands (fens), and well-developed soil profiles. Aqueous and solid phase
geochemistry was determined for soils, soil waters, surface waters (streams and fens) and groundwaters from glacial
drift aquifers to better understand the hydrogeologic and chemical controls on As mobility. Soil profiles established on
the glacial drift exhibit enrichment in both Fe and As in the oxyhydroxide-rich zone of accumulation. The amounts of
Fe and As present as oxyhydroxides are comparable to those reported from bulk Marshall Fm. core samples by pre-
vious workers. However, the As host in core samples is largely unaltered pyrite and arsenopyrite. This suggests that the
transformation of Fe sulfides to Fe oxyhydroxides largely retains As and Fe at the oxidative weathering site.
Groundwaters have the highest As values of all the waters sampled, and many were at or above the World Health limit.
Most groundwaters are anaerobic, within the zones of Fe
3+
and As(V) reduction. Although reduction of Fe(III) oxy-
hydroxides is the probable source of As, there is no correlation between As and Fe concentrations. The As/Fe mole
ratios in drift groundwaters are about an order of magnitude greater than those in soil profiles, suggesting that As is
more mobile than Fe. This is consistent with the dominance of As(III) in these groundwaters and with the partitioning
of Fe
2+
into carbonate cements. Soil waters have very low As and Fe contents, consistent with the stability of oxy-
hydroxides under oxidizing vadose conditions. When CO
2
charged groundwaters discharge in streams and fens, dis-
solved As is effectively removed by adsorption onto Fe-oxides or carbonate marls. Although Fe does not display
conservative behavior with As in groundwaters, a strong positive correlation exists between As and Sr concentrations.
As water–rock interactions proceed, the As/Fe and Sr/Ca ratios would be expected to increase because both As and
Sr behave as incompatible elements. Comparisons with groundwater chemistries from other drift-hosted aquifers
proximate to the Marshall sandstone are consistent with these relations. Thus, the Sr content of carbonate-rich
groundwaters may provide useful constraints on the occurrence, origin and evolution of dissolved As in such systems.
# 2004 Elsevier Ltd. All rights reserved.
0883-2927/$ - see front matter # 2004 Elsevier Ltd. All rights reserved.
doi:10.1016/j.apgeochem.2004.01.012
Applied Geochemistry 19 (2004) 1137–1155
www.elsevier.com/locate/apgeochem
* Corresponding author.
E-mail addresses: (K. Szramek), (L.M. Walter).
1. Introduction
Elevated As levels in surface and groundwater systems
can be derived from both anthropogenic and natural
sources. Although anthropogenic As contamination
from mining operations, fossil fuel processing, and pes-
ticides/herbicides applications is typically local in extent,
contamination can reach levels thousands of times of
that from natural sources (e.g. Smedley and Kinniburgh,
2002). Natural As sources have recently received increas-
ing attention due to the discovery of regional-scale As
contamination of groundwaters, with As enrichment far
above the World Health Organization (WHO) max-
imum contamination limit (MCL) of 10 mg/L (0.13 mM)
in drinking water (Welch et al., 1999, 2000; Nordstrom,
2002; Smedley and Kinniburgh, 2002). Perhaps the most
widely known problem of naturally occurring As
enrichment of groundwater occurs in unconsolidated
deltaic sediments in Bangladesh. Here, potentially 30 Â
10
6
people have been exposed to levels of As up to 2500
mg/L in the groundwater (Nordstrom, 2002).
Arsenic is not an abundant element in the earth’s
continental crust (Wedepohl, 1995). It can, however, be
concentrated in sulfide-bearing minerals such as pyrite
(Savage et al., 2000). The most common sources of As in
the natural environment include volcanic rocks, specifi-
cally their weathering products and ash (Nicolli et al.,
1989; Smedley et al., 2002); marine sedimentary rocks
(Smedley and Kinniburgh, 2002); hydrothermal ore
deposits and associated geothermal waters (Korte and
Fernando, 1991); and fossil fuels, including coals and
petroleum (Korte and Fernando, 1991; Smedley and
Kinniburgh, 2002). Although igneous and metamorphic
rocks contain As, the average concentrations (1.5 and 5
mg kg
À1
, respectively) (Ure and Berrow, 1982; Smedley
and Kinniburgh, 2002) are lower than the average range
from sedimentary deposits (5–10 mg kg
À1
)(Webster,
1999). Typically the As concentrations in sedimentary
rocks increase with increasing amounts of sulfide
minerals, oxides, organic matter and clays (Smedley and
Kinniburgh, 2002).
Arsenic has 4 oxidation states in aquatic systems,
ÀIII, 0, +III and +V with the two main inorganic
species found in water being arsenite (III) and arsenate
(V) (e.g. Cullen and Reimer, 1989; Drever, 1997; Kim,
1999; Stollenwerk, 2003). Thermodynamics predicts that
arsenite is stable under reduced conditions and arsenate
is stable under oxidized conditions. However, both spe-
cies can be found regardless of the redox conditions,
suggesting that kinetic or microbial processes are impor-
tant controls on speciation (Smedley and Kinniburgh,
2002; Stollenwerk, 2003). The geochemical behavior of
arsenate is often compared to that of phosphate, while As
acid is comparable with boric acid (e.g. Drever, 1997).
Thus, arsenate is much less mobile under intermediate
pH conditions.
Arsenic contents in groundwaters depend on the
source of As, the geochemical evolution along the flow
path, and the redox state of the system. Many different
mechanisms of As release have been observed in natural
systems. Focusing on sedimentary occurrences, the
two main pathways are the reductive dissolution of
Fe oxyhydroxides (FeOOH) that releases adsorbed As
(Nickson et al., 1998, 2000; McArthur et al., 2001;
Dowling et al. 2002; Kolker et al., 2003) and the oxida-
tive dissolution of As-rich pyrite (Mallick and Rajagopal,
1996; Mandal et al., 1996; Chowdhury et al., 1999). In
anaerobic laboratory experiments, high HCO
3
À
con-
centrations promote release of As from sulfide minerals
(Kim, 1999; Kim et al., 2000). Both McArthur et al. (2001)
and Harvey et al. (2002) report that the reducing con-
ditions associated with organic matter decomposition may
increase As mobility. Similarly, Dowling et al. (2002)
observe that high levels of dissolved As and Fe are
positively correlated with NH
3
and CH
4
, suggesting that
microbial breakdown of FeOOH releases As. Taken
together, any or all of these processes could reasonably
influence the mobilization and transport of As in
groundwater systems.
The formation of the source FeOOH material under-
going oxidative dissolution in the subsurface commonly
occurs in oxidizing soil profiles. Here, As released by
oxidative weathering can be adsorbed to the product Fe
oxyhdroxides in the zone of accumulation. Some
researchers have examined soils developing on parent
materials rich in As and Fe from both anthropogenic
and natural As sources (Strawn et al. 2002; Courtin-
Nomade et al., 2003; Ne
´
el et al., 2003). These researchers
indicate that successive oxidation and re-precipitation
processes can also occur, with progressive loss of As in
the solid phase, i.e., Fe-oxides. This loss of As is a result
of the incomplete sorption of As back onto the FeOOH
as it is re-precipitated as a solid phase.
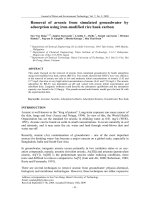
There has been increasing concern about elevated
As levels in the groundwaters of the glaciated mid-
continent region (Fig. 1 A). Arsenic levels exceeding the
WHO MCL have been observed in groundwaters from
bedrock and glacial aquifers in the southeastern Lower
Peninsula of the state of Michigan (Fig. 1B, C). The
source of As in the region is thought to be oxic weath-
ering of As-rich pyrite (as high as 8.5 wt.% As) from
the Marshall Fm. and Coldwater Shale, both of Mis-
sissippian age (Kolker et al., 2003). Iron oxyhydroxides
found in glacial deposits that contain rock fragments of
the Marshall Fm. and the Coldwater Shale have As
concentrations up to 0.7 wt.% (Kolker et al., 2003). The
highest value reported for Michigan groundwater comes
from the Marshall Fm. and is 220 mg/L (2.94 mM) (Kim,
1999, 2002; Kolker et al., 2003). Most prior studies of
As in Michigan groundwaters (Kim, 1999; Kim et al.,
2000, 2002; Welch et al., 2000; Kolker et al., 2003) have
focused on watersheds in the eastern-most part of the
1138 K. Szramek et al. /Applied Geochemistry 19 (2004) 1137–1155
state, locally known as the ‘‘Thumb’’ region (Fig. 1B).
Heterogeneity in As levels is to be expected, given the
complex interplay between Pleistocene glacial history,
erosion, deposition, and fluctuations in recharge rates to
drift and bedrock aquifers.
In this contribution, the authors explore the patterns
and causes of elevated As concentrations in ground-
waters from unconfined glacial drift aquifers in the
Lower Peninsula of Michigan (see Fig. 1) in proximity
to the Marshall Fm. To gain a fuller understanding of
Fig. 1. Hydrogeological framework of the upper Midwest (US) and Lower Peninsula of Michigan. (A) Average Pleistocene drift
thickness in the Midwest Region. The Lower Peninsula of the state of Michigan is marked with a box. (B) Middle to Upper Paleozoic
bedrock geology of the Lower Peninsula of Michigan. The Marshall Formation sub-crop forms a circle around the state. The two
main bedrock aquifers are in Devonian carbonates and sands of the Marshall Fm. (C) Shaded relief map of Michigan marked with
outlines of the 4 USGS reference watersheds identified by name. Each watershed is marked with a line of section referred to in Fig. 2.
K. Szramek et al. /Applied Geochemistry 19 (2004) 1137–1155 1139
the processes regulating the As contents of glacial drift
groundwater systems in Michigan, the authors investi-
gated the geochemical relations between As and other
geochemical variables in groundwater, surface water,
and soils in a well constrained portion of the Huron
River watershed in southeastern Michigan. This is part
of a larger study of C cycling and transformations in the
Huron watershed (Szramek, 2002). As shown in the
following section, the Huron River watershed is estab-
lished on top of heterogeneous glacial deposits and has
groundwaters which exhibit a large range of As con-
centrations, many above the WHO MCL of 0.13 mM.
2. Hydrogeologic framework of arsenic occurrence in
lower Michigan groundwaters
The Michigan Basin is a cratonic depression filled
with mainly Paleozoic era sedimentary bedrock and
mantled by Pleistocene glacial deposits (Dorr and
Eschman, 1970). As shown in Fig. 1B, the principal
bedrock aquifers in the basin are Devonian carbonates,
Mississippian and Pennsylvanian units, including the
Marshall Fm., and the glacial deposits (Rheaume,
1991). A major aquitard, the Coldwater Shale, underlies
the Marshall Fm. sandstones. Due to the bowl-like
shape of the basin the sub-crops of the Marshall Fm.
and the Coldwater Shale form a nearly concentric ring
within the Michigan Basin. Bedrock is mantled by a
sequence of Pleistocene glacial deposits up to 300 m
thick which show the record of 2 Ma of Pleistocene ice
sheet advances and retreats (e.g. Dorr and Eschman,
1970). These glacial sequences exhibit a range of
hydrologic properties and include permeable sands and
gravels in outwash deposits, less permeable tills, and
highly impermeable lakebed clays. The glacial deposits
are also the primary control on the topography of the
state, and glacial depositional features commonly define
watersheds (Fig. 1C).
Of special interest in framing this study were areas
where glacial drift aquifers overlie the Marshall Fm. In
Fig. 1C, the locations of 4 watersheds (Thumb region,
Huron River, Kalamazoo River, and Manistee River)
established on top of the Marshall Fm. subcrop are
displayed. Groundwater chemical data including As
concentrations are available for each of these 4 water-
sheds from the United States Geological Survey NWIS
Web database (2001) and Kim (1999). Schematic
hydrogeologic cross-sections (Fig. 2 A–D) show that the
watersheds fall along a continuum between highly
permeable open systems to those with significant per-
meability contrasts within the drift aquifer materials to
those with virtually no permeability. The Thumb area is
primarily covered with lakebed clay deposits, reducing
contact between surface flow systems and the underlying
bedrock aquifer. The Thumb area is part of a regional
groundwater discharge system and saline water is
commonly encountered within 60 m of the surface
(Rheaume, 1991). This situation is unusual for Michigan
because most other areas have significant communi-
cation between surface waters and groundwater flow
systems as exemplified by the Huron, Manistee and
Kalamazoo watersheds.
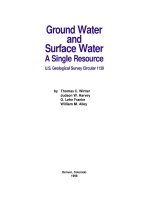
The groundwater As concentrations in each of the
4 watersheds are displayed in Fig. 3. Although the
Marshall Fm. is located within each of these reference
areas, As concentrations vary widely. Differences in
the permeability and transmissivity of the glacial drift
deposits would be expected to play a large role in the
variability of As levels. These factors encourage or
inhibit the oxidization and reduction processes known
to mobilize As from sulfide and oxide minerals.
Groundwater from the Thumb region has the max-
imum As value reported in the Lower Michigan area
(2.94 mM As) and 70% of the 100 wells sampled have As
concentrations in excess of the WHO MCL of 0.13 mM
(Kolker et al., 2003). The median As concentrations in
groundwaters from the 4 watersheds are, from lowest to
highest: 0.010 mM in the Manistee watershed, 0.0134
mM in the Kalamazoo, 0.029 mM in the Huron, and
0.121 mM in the Thumb region. The hydrogeology of
the Huron watershed study site is similar in many
ways to the Manistee and Kalamazoo watersheds and
offers an interesting counterpoint to prior geochemical
investigations of the Thumb region.
3. Materials and methods
3.1. Study location
The Portage Creek catchment is located in the wes-
tern portion of the Huron watershed (Fig. 4A), where
the Marshall Formation sub-crops beneath glacial drift
(Fig. 1B). The groundwater in the Huron watershed is
mainly hosted in glacial drift aquifers (Twenter et al.,
1976). The area has high topographic gradients as it is
one of the headwater catchments of the Huron River.
The mean annual temperature for the region is 10
C
and the average annual precipitation is 80 cm. The
drainage area for Portage Creek is approximately 205
km
2
and is mainly comprised of hardwood forests, with
limited urban development. Portage Creek flows
through lakes and wetlands on its course toward the
main stem of the Huron River.
The work focused on the Hell Fen area (Fig. 4B). The
fen is located along Tiplady Road near Hell, Michigan
(W83
59
0
08
00
and N42
26
00
36
000
). Fens are ground-
water-fed wetlands that have high concentrations of
Ca
2+
and HCO
3
À
and circum-neutral pH (Glaser et al.,
1990, Komor, 1994; Almendinger and Leete, 1998).
Fig. 4A shows the surface drainage in the fen with small
1140 K. Szramek et al. /Applied Geochemistry 19 (2004) 1137–1155
creeks flowing along the surface. The fen is surrounded
by topographic highs allowing for the discharge of
shallow groundwaters. The groundwater discharges at
this point because of the drift impermeability and
heterogeneity in the location of the fen (Fig. 5).
3.2. Sample sites
Groundwater wells are all producing from glacial
drift. Well sites were chosen based on their proximity to
Hell Fen (shown in Fig. 4B) and on the availability of
well driller’s information. As seen in Fig. 5, the hetero-
geneity of the drift allowed for waters being drawn
from different drift types. Sampled wells were mainly
unconfined and varied from 16 to 60 m deep.
A sequence of shallow groundwaters that discharge
into the fen were sampled using 5 PVC piezometers
transecting the fen to cover aerial variability (Fig. 4C).
Care was taken to prevent surface water contamination
by packing swelling clay around the outside of the upper
half of the set pipe. The piezometers sampled water at a
depth of approximately 90 cm.
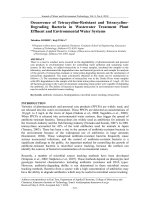
Fig. 2. Schematic bedrock geologic and glacial drift cross-sections for the four reference watersheds in the Lower Peninsula of
Michigan. In each case, the Marshall Formation aquifer is confined on either side by shale aquitards. However, glacial drift thickness,
lithology and permeability differ markedly among the 4 watersheds. (A) Manistee River watershed has the thickest and most
permeable drift section comprised of outwash sands and gravels, with till in moraine deposits. (B) ‘‘Thumb’’ area has the lowest
drift permeability and the thinnest cover over bedrock, as lakebed clays comprise most of the Pleistocene section. (C) Kalamazoo
River watershed has drift comprised of permeable sands and gravels but is a relatively thin cover such that the eastern side of the
area has Paleozoic bedrock very near the surface. (D) Huron River watershed has a relatively thick drift section characterized by
impermeable lenses of till spread throughout sandy outwash and moraine deposits.
K. Szramek et al. /Applied Geochemistry 19 (2004) 1137–1155 1141
Surface water samples were collected in conjunction
with a larger study on the C systematics of the Huron
River watershed. The surface sampling locations
(Fig. 4A) were selected based on their relationship to
confluences with the main stream, at points before and
after the stream passed through a lake system. Care was
taken to collect upstream of large roads and develop-
ments to limit potential contamination from local runoff.
The soil water sample sites are all located in upland
areas that surround the fen. The sites H-1, H-2, and H-3
are shown in Fig. 4B. Ceramic-cup tension lysimeters
(Soil Moisture Corp.) were installed in these sites for the
collection of waters at depths ranging from 23 to 100 cm.
Soil samples were collected from two locations, H-1
and H-2. The soils were sampled every 10 cm to a depth
of 1.5 m using a large-diameter auger. Samples were
taken from the center of the augured material to limit
contamination from adjacent soil layers. All samples
were bagged in air tight Bitran bags and then frozen. A
representative subsample of this material was ground to
pass a 63 mm mesh prior to geochemical analyses.
3.3. Water collection
Well water was generally collected from the well
owner’s outdoor tap. A laminar flow of water was
allowed to run into the collecting vessel until temper-
ature and dissolved O
2
were stabilized, typically taking
around 20 min, depending on distance to the well-head
and presence and size of the holding tank for the
household. Samples were only taken after temperature
and dissolved O
2
levels stabililized, indicating that the
water sample was representative of in situ conditions.
Aliquots were immediately taken and transferred into
crimp sealed glass bottles filled with no headspace to
limit O
2
contamination.
Shallow groundwater was collected from the piezo-
meters using a peristaltic pump. Pumping was main-
tained on the wells for approximately 15 min to allow
for the removal of stagnant water.
Stream and fen water samples were collected over 3
seasons (10/00, 5/01, and 6/01) to capture variability in
the system. Base flow of the streams in the Huron
watershed is during the summer months, however, fre-
quent thunderstorms can interfere with capturing the
stream at base flow.
Soil waters were collected from 3 nests of ceramic-cup
tension lysimeters (Soil Moisture Corp.). Approximately
48 h before sample collection, tension was pulled on the
lysimeters to 30 cbars to draw water into the ceramic-
cup. If soil water was present, it was extracted using acid
washed syringes.
3.4. Field measurements and sample preservation
Temperature, conductivity, dissolved O
2
(DO), and
pH were determined at the field location. Temperature
and DO was measured using a YSI model 58 meter and
Fig. 3. Range of groundwater As concentrations in the 4 reference watersheds (Kim, 1999; USGS, 2001). Number of samples and
median As concentrations are as follows: n=13; 0.01 mM (Manistee); n=24, 0.0134 (Kalamazoo); n=18, 0.029 (Huron); and n=25,
0.121 (‘‘Thumb’’). The minimum As concentration is constrained at 0.01 mM, the As detection limit for these data sets. The World
Health Organization MCL of 0.13 mM is indicated.
1142 K. Szramek et al. /Applied Geochemistry 19 (2004) 1137–1155
Fig. 4. Location of the Huron Watershed field study sites showing elevation and physiography. (A) Portage Creek catchment at the
northeastern edge of the Huron Watershed (shown as small inset map). Surface water sampling locations are shown in the gray circles.
The indicated sample numbers correspond to those in Table 1. The Huron River was sampled after the Portage Creek confluence at
the USGS gage station 4173000 (Huron R. near Dexter, MI). (B) Topography of the study area at the town of Hell, MI. An extensive
wetland area studied is indicated as ‘‘Hell Fen’’ on the map. Groundwater and surface water locations are indicated by black and
white circles, respectively. Soil water and soil profile sampling sites are located at H-1 and H-2. The line shown from H-1 to H-2 sites
indicates the location of the driller log lithologic sections shown in Fig. 5. (C) Expanded scale view of Hell Fen with fen surface
drainage sample locations indicated by the open circles. The dashed line across the fen is the location of the piezometers, locations are
numbered from 1 through 5, spaced roughly equally, going from west to east.
K. Szramek et al. /Applied Geochemistry 19 (2004) 1137–1155 1143
a YSI 5239 DO probe with high sensitivity membrane,
directly at the source, either in the stream or at the
groundwater well. Conductivity was observed in the
field using a Corning 316 meter with a two point cali-
bration 0 and 1413 mS, mostly to provide a rapid geo-
chemical reference point. Dissolved O
2
measurements
were precise to Æ 5% saturation and conductivity
measurements to within Æ 5%.
A Corning 315 high sensitivity pH meter with an
Orion Ross combination pH electrode calibrated with
low ionic strength buffers of 4.1 and 6.97 were used to
measure pH in the field as close to the water temper-
ature as possible. The pH of a sample can change due to
degassing and warming; therefore, the samples were
placed in a large volume airtight container and mea-
sured at least twice to ascertain electrode stability. The
precision of pH determinations is Æ0.01 pH units.
Samples for later chemical analysis in the lab were
collected in HDPE bottles. The bottles and filters used
for the As samples underwent a 3-step acid wash proce-
dure and were dried in a laminar flow hood. Aliquots
for analyses were filtered through a 0.45-mm nylon filter
into their respective bottles while still in the field and
refrigerated until analyzed. Samples collected for total
dissolved As analyses were acidified down to approxi-
mately a pH of 2 with optima grade HNO
3
(Fisher
Scientific). Samples intended for As speciation (As
III/As V) determinations were filtered into dark glass
bottles, filled with no headspace, and were not acidified.
Dissolved inorganic C (DIC) and ICP–AES aliquots
were preserved in the field with CuCl
2
, and HNO
3
,
respectively. The DIC aliquots were placed in serum
vials, filled with no headspace, and then crimp-capped
using Teflon-lined septa. Aliquots for titration alkalinity
and ion chromatographic analyses were placed in
HDPE bottles filled with no headspace without any
acid treatment. Refrigeration on site and rapid analysis
back at the University laboratory was essential for
As speciation and for alkalinity titrations to prevent
oxidation and carbonate/hydroxide precipitation.
3.5. Geochemical analyses
Arsenic was measured on a Thermo-Finnigan Ele-
ment 2 mass spectrometer using a modified method of
hydride generation (Klaue and Blum, 1999). Most ana-
lyses were for total As concentrations. Here, all species
of As in aqueous solutions are oxidized to As(V) using
10% (v/v) HNO
3
and ultraviolet oxidation in a con-
tinuous-flow reaction vessel. A small suite of samples
were collected for determination of As speciation. The
same method of hydride generation was used (e.g. Klaue
and Blum, 1999), but the aqueous sample is passed
through column pretreatment to separate the As (III)
from As(V) prior to the oxidation step. As(V) is then
reduced with 1% (w/v) NaBH
4
in 0.1 M NaOH to form
AsH
3
gas. The AsH
3
gas is then swept with Ar into the
mass spectrometer after passing through a liquid/vapor
separator (Klaue and Blum, 1999). A few of the samples
were run without hydride generation on a Finnigan
Element 1 ICP–MS. The detection limit for As run on
high resolution is about 0.004 mM.
Major element chemistry on waters was measured by
ICP-AES for cations and ion chromatography for
anions. A Leeman Labs, Inc., Plasma-Spec ICP-AES
2.5 was used to analyze for Ca, Mg, Na, Sr, and Fe with
a precision of Æ 2% for major and Æ 5% for minor ele-
ments. Anions (Cl
À
and SO
4
2À
) were analyzed on a
Dionex 4000I series ion chromatograph (IC) with an
AS14 column to a precision of Æ 2%. Aliqouts of soil
leaches were analyzed using a Finnigan Element 1 ICP–
MS at a precision of Æ 1.5 to 2%.
Total alkalinity was measured within 24 h of sample
collection by electrometric endpoint titration using a
Radiometer TitraLab automated titration system with a
TIM900 titration manager and ABU91 or ABU93
autoburette. Due to the given measurement precision
(Æ 0.01 meq/kg), the pH range of the samples, and the
ionic composition of the solutions, HCO
3
À
was calcu-
lated as equivalent to total alkalinity. Charge balance
calculations performed on water chemistry data to
check for internal analytical consistency were within
5%.
3.6. Solid soil collection and analysis
Soils were extracted for hydroxide and carbonate
bound metals using a modified strong acid leach descri-
bed by Hossner (1996). In a study by Chen and Ma
Fig. 5. Lithologic heterogeneity of the drift is shown in this
schematic cross-section of the Hell Fen area. Driller well log
records for private wells were used to construct the cross-
section. The locations of the two soil profiles and lysimeter
sites are shown as H-1 and H-2.
1144 K. Szramek et al. / Applied Geochemistry 19 (2004) 1137–1155
(2001), a similar method was tested on 20 different soils
and shown to be an effective way to determine total As.
The extraction method uses approximately 0.5–0.8 g of
soil ground to finer than 63 mm which is treated with 5 ml
of ‘‘aqua regia’’ (3 HCl:1 HNO
3
) in an acid-cleaned 125-
ml polypropylene bottle. The soils were reacted for 3 h
on a shaker table at room temperature. After that time,
the reaction was stopped by the addition 95 ml of H
2
O
to form a 5% acid solution to prevent cation precipita-
tion. The solutions were then filtered through a 0.45-mm
polypropylene filter into acid cleaned vials. Blanks
(same procedure without soil) were carried out in the
same manner and subtracted from the final calculations.
This cold acid extraction technique primarily dis-
solves the most reactive fractions in the soil (hydroxides
and carbonates) and does not significantly attack silicate
or sulfide minerals. The effectiveness of the modified
technique was confirmed via repeat extractions on the
solid residue. No additional As was recovered in repeat
digests. Additionally, several samples from the base of
the soil column were analyzed by S-coulometry to
determine if sulfides were present in the bulk parent
material. Results of S analyses were below detection,
consistent with the maturity of the weathering zones in
these well developed soils.
4. Results and discussion
4.1. General water chemistry
Major element chemistry of waters from the Portage
catchment [soil water (lysimeter), groundwater (well and
piezometer), and surface water (Portage Creek and Hell
Fen)] is dominated by Ca
2+
, Mg
2+
and HCO
3
À
(Fig. 6A). The stoichiometry of the dissolution reaction
for carbonate minerals with CO
2
yields 2 mol HCO
3
À
for
each mole of divalent cations (Ca
2+
+Mg
2+
) and most
waters are close to this ideal value. The Mg
2+
/Ca
2+
ratio of the waters (see Table 1) falls very close to 0.5,
suggesting that 1 mol of dolomite dissolves per 1 mol of
calcite. The glacial drift contains fragments of Paleozoic
carbonates (calcite and dolomite), and this is evident
from the soil extract data presented later in this section.
Aqueous speciation and carbonate mineral saturation
state calculations indicate that groundwaters are all near
equilibrium with respect to dolomite and approximately
twice saturated with respect to calcite (Szramek, 2002).
Given the average groundwater temperature around
10
C, dolomite is more soluble than calcite, permitting
dolomite dissolution concurrently with calcite precipita-
tion. As will be discussed later in this section, carbonate
mineral recrystallization would be expected to occur
along the groundwater flow path, and is evidenced by
the significantly elevated Sr
2+
/Ca
2+
ratios in many of
the groundwaters (see Table 1).
Given the high topographic gradients in the Hell fen
area, it is common for groundwaters to discharge into
surface flow systems with attendant degassing of dis-
solved CO
2
, especially in the summer when there are
large temperature increases during discharge. Under these
conditions, calcite supersaturation (IAP/K) can increase
to values as great as 16, which produces the CaCO
3
marl
of the Hell fen surface sediments (Szramek, 2002). Car-
bonate precipitation has an important regulating effect
on the nutrient cycling in fens (e.g. Boyer and Wheeler,
1989) because phosphate has a very strong affinity for
adsorption on carbonate mineral surfaces (e.g. DeKanel
and Morse, 1978, Walter and Burton, 1988).
Fig. 6A shows that surface waters commonly have
Ca
2+
+Mg
2+
concentrations greater than those in the
groundwaters. A plot of Na
+
vs. Cl
À
(Fig. 6B) shows
that groundwaters and soil waters tend to have very low
Cl
À
concentrations, but the surface waters can be extre-
mely enriched in Cl
À
. Approximately 20,000 t of salt are
added each year by the Washtenaw County transporta-
tion department (Mulcahy, 2003) and CaCl
2
is also
commonly used to deice walks and driveways. Two fen
water samples shown in Fig. 6B have Cl
À
in excess of
all other samples. These two samples are taken from
a location close to the road and experienced larger
input of salt as a result. All the surface waters have
Cl
À
in excess of Na
+
suggesting both salts contribute
to the overall solute load of the surface waters. Thus,
water chemistry in the Portage catchment is dominated
by inputs from carbonate mineral dissolution and
anthropogenic salt sources.
4.2. Arsenic in soil profiles
The geochemistry of soil extracts (Al, Fe, As, Ca, Mg)
for the two profiles H-1 and H-2 is reported in Table 2.
The trace metal, As and Al relations vs. depth for the two
soil profiles are shown Fig. 7 A–D. The zone of accumu-
lation (B horizon) for the soil is evident by the increased
concentrations of Al, Fe and As between 50 cm and 125
cm (Fig. 7A–C). In this zone the Ca and Mg concentra-
tions indicate that the carbonates have been selectively
weathered out of the soil column until at least 130 cm in
H-1 and 160 cm in H-2. Below the zone of accumula-
tion, the Ca and Mg contents rapidly increase towards
relatively unaltered parent glacial drift values (Table 2).
The ultimate source of the As in the soil is from As-
rich pyrite from the Marshall Fm. that was incorporated
into the drift and then oxidized and re-precipitated as
FeOOH within the drift (Kolker et al., 2003). Soil pro-
files H-1 and H-2 have an average As/Fe ratio within
the zone of accumulation of 0.5 (mol 10
À3
). This value is
similar to values reported by Kolker et al. (2003) in the
Thumb area for the bulk Marshall Fm., taken from core
cuttings that range from 0.9 to 1.8 (mol 10
À3
) and till
derived from the Marshall Fm approximately 1.5–2.7
K. Szramek et al. / Applied Geochemistry 19 (2004) 1137–1155 1145
(mol 10
À3
). The bulk Marshall Fm. hosts As in unaltered
As-rich pyrite and arsenopyrite, whereas the till and soil
profiles host As in Fe oxyhydroxides. The similar values
indicate that the oxidation of Fe sulfides to Fe oxy-
hydroxides appears to closely follow the value of the As
and Fe of the precursor phase.
4.3. Relations between arsenic and iron in waters
Arsenic and Fe concentrations in the water samples
from the Portage catchment are reported in Table 1.In
a plot of As vs. Fe (Fig. 8A), each water type appears
clustered in composition space with respect to Fe and
Fig. 6. General major element geochemistry of the water samples. (A) Carbonate geochemistry: All waters fall near the 1:2 mol ratio
of Ca
2+
+Mg
2+
:HCO
3
À
indicating that dissolution of carbonate minerals is the major process controlling the water chemistry. This
pattern is typical of surface waters and shallow groundwaters in the carbonate-rich drift deposits of the upper Midwest (e.g. Rheaume,
1991; Szramek, 2002). (B) Anthropogenic salt inputs into the Portage Creek catchment include NaCl and CaCl
2
. Surface waters are
most influenced by additions of these two salts, explaining why many plot above the 1:2 stoichiometric line in Fig. 6A. Most
groundwaters and soil waters have low Cl
À
contents, with most Na
+
derived from plagioclase feldspar dissolution.
1146 K. Szramek et al. / Applied Geochemistry 19 (2004) 1137–1155
Table 1
Water analyses
Sample Date Depth
(m)
Screened
interval
(m)
Temp.
(
C)
O
2
(%)
pH Fe
(mM)
As
(mM)
HCO
3
À
(meq/l)
Ca
2+
(mM)
Mg
2+
(mM)
Sr
2+
(mM)
Na
+
(mM)
Cl
À
(mM)
SO
4
2À
(mM)
Soil water
Lysimeter H-1-23 10/22/01 0.23 – 6.44 3.25 0.01 0.192 0.116 0.075 0.141 0.012 0.053 0.060
H-1-23 5/17/02 0.23 19.4 6.75 3.37 0.016 0.453 0.248 0.153 0.168 0.043 0.047 0.102
H-1-50 10/22/01 0.5 – 6.24 1.13 0.01 0.102 0.205 0.131 0.241 0.084 0.112 0.179
H-1-50 5/17/02 0.5 18.6 6.14 1.42 0.013 0.076 0.161 0.106 0.167 0.087 0.057 0.139
H-1-90 10/22/01 0.9 – 6.29 0.04 0.012 0.136 0.119 0.087 0.250 0.095 0.072 0.124
H-1-90 5/17/02 0.9 18.6 6.17 0.05 0.007 0.192 0.108 0.071 0.172 0.084 0.046 0.143
H-2-25 10/22/01 0.25 – 4.85 0.037 0.040 0.078 0.015 0.048
H-2-25 5/18/02 0.25 18.8 6.50 0.51 0.006 0.346 0.032 0.049 0.102 0.039 0.025 0.051
H-2-50 10/22/01 0.5 12.9 6.30 0.315 0.100 0.067 0.137 0.012 0.063
H-2-50 5/18/02 0.5 18.6 6.77 0.455 0.017 0.024 0.044
H-2-100 10/22/01 1.0 14.2 6.46 0.03 0.005 0.167 0.115 0.077 0.364 0.161 0.093 0.094
H-3-18 10/22/01 0.18 – 7.88 1.12 0.007 1.862 0.509 0.326 0.230 0.018 0.026 0.040
H-3-35 10/22/01 0.35 – 7.32 1.21 0.007 0.883 0.432 0.226 0.240 0.087 0.029 0.075
H-3-35 5/17/02 0.35 19.6 6.83 2.48 0.01 0.918 0.369 0.209 0.182 0.048 0.018 0.055
H-3-90 10/22/01 0.9 – 7.75 0.11 0.008 2.133 0.783 0.485 0.850 0.124 0.026 0.058
Groundwater
Well GW A 10/15/00 61.0 59.1–60.0 11.2 0.8 7.55 7.18 0.072 5.318 1.664 0.810 2.894 0.544 0.194 0.151
GW B 5/31/01 19.5 18–19.5 11.2 0.5 7.57 26.74 0.114 5.117 1.889 0.878 2.501 0.275 0.040 0.291
GW C 5/31/01 20.4 19.4–20.4 12.0 0.7 7.43 19.67 0.039 5.316 1.976 0.900 0.771 0.470 0.175 0.327
GW D 5/18/02 24.4 23.2–24.4 10.9 1.5 7.60 22.54 0.002 5.369 1.941 0.909 0.876 0.164 0.093 0.273
GW E 6/7/02 18.3 17.1–18.3 14.2 0.8 7.23 32.60 0.012 5.695 2.290 0.831 0.857 0.239 0.224 0.171
GW F 10/16/00 24.1 22.9–24.1 10.9 1.5 7.67 23.63 0.206 4.881 1.607 0.823 2.815 0.444 0.119 0.170
GW G 10/16/00 27.4 25–27.4 11.1 0.4 7.63 14.41 0.254 5.444 1.629 1.037 4.501 0.526 0.061 0.087
GW G 5/17/02 27.4 25–27.4 11.6 6.0 7.80 12.94 0.277 5.430 1.779 0.946 4.145 0.500 0.084 0.090
GW H 6/7/02 41.8 38.7–41.8 13.8 1.8 7.40 10.36 0.224 4.995 1.732 0.856 2.933 0.435 0.163 0.166
GW I 6/7/02 27.4 26.2–27.4 13.7 0.9 7.44 15.19 0.204 5.042 1.794 0.872 2.649 0.465 0.120 0.238
GW J 10/15/00 31.4 30.2–31.4 11.5 1.5 7.52 20.41 0.148 5.491 1.906 0.967 1.789 0.301 0.194 0.401
GW K 5/24/01 57.9 56.7–57.9 11.0 1.1 7.56 13.52 0.314 5.418 1.769 0.973 5.564 0.613 0.321 0.129
Piezometer Piezo. 1 5/18/02 0.91 16.4 7.06 13.71 0.029 3.648 1.919 0.662 0.680 0.149 0.084 0.531
Piezo. 2 5/18/02 0.91 16.7 6.99 31.08 0.100 5.671 2.645 0.798 0.838 0.531 0.185 0.465
Piezo. 3 5/18/02 0.91 16.8 7.17 3.44 0.010 5.392 2.353 0.926 0.728 0.705 1.239 0.185
Piezo. 4 5/17/02 0.91 16.1 7.33 6.47 0.024 6.279 2.844 1.378 1.264 0.277 0.522 0.714
Piezo. 5 5/17/02 0.91 17.2 7.31 15.34 0.021 8.206 3.568 1.720 1.457 0.290 0.397 0.850
(continued on next page)
K. Szramek et al. / Applied Geochemistry 19 (2004) 1137–1155 1147
Table 1 (continued)
Sample Date Depth
(m)
Screened
interval
(m)
Temp.
(
C)
O
2
(%)
pH Fe
(mM)
As
(mM)
HCO
3
À
(meq/l)
Ca
2+
(mM)
Mg
2+
(mM)
Sr
2+
(mM)
Na
+
(mM)
Cl
À
(mM)
SO
4
2À
(mM)
Surface water
Portage Creek SW 1 8/22/01 73 8.17 1.86 0.037 3.894 1.662 0.823 1.709 0.626 0.879 0.492
SW 1 10/15/00 15.1 98.2 8.30 0.31 0.038 3.858 1.966 0.786 1.630 0.483 0.759 0.459
SW 1 3/12/01 4.3 111 7.98 0.59 0.024 3.893 1.961 0.762 1.710 0.535 0.749 0.435
SW 1 5/3/01 20.8 99.8 8.19 0.64 0.023 3.989 1.784 0.830 1.486 0.535 0.716 0.385
SW 1 6/27/01 26.1 86 8.19 0.41 0.025 4.098 1.874 0.784 1.830 0.579 0.686 0.733
SW 3 10/15/00 17.0 75 8.35 0.10 0.034 3.967 1.634 0.798 1.724 0.618 0.850 0.462
SW 3 3/12/01 4.5 72 7.69 0.61 0.024 3.860 1.874 0.848 1.700 0.531 0.772 0.451
SW 3 5/3/01 21.6 98 8.49 0.29 0.019 3.972 1.851 0.842 1.518 0.592 0.771 0.321
SW 3 6/27/01 28.4 119 8.60 0.25 0.020 4.107 1.756 0.805 1.455 0.539 0.726 0.344
SW 4 6/27/01 22.4 110.5 8.20 4.12 0.032 5.244 2.268 0.954 1.196 0.622 0.816 0.362
SW 5 6/27/01 24.4 69.2 8.31 1.35 0.031 4.704 2.161 0.965 1.964 0.666 0.923 0.554
SW 7 6/27/01 25.4 85 8.64 0.89 0.030 4.702 2.176 0.965 2.049 0.635 0.888 0.570
SW 8 6/27/01 16.6 81 8.18 2.19 0.035 6.261 2.695 1.216 1.563 0.339 0.695 0.574
SW 9 6/27/01 25.4 163 8.52 1.23 0.033 4.356 2.186 1.092 2.808 0.957 1.221 0.802
SW 10 6/27/01 19.6 73.9 8.02 2.70 0.031 5.456 2.745 1.132 3.874 1.179 1.482 0.935
SW 10 6/27/01 21.2 56 7.75 1.99 0.032 4.014 1.747 0.976 0.903 0.444 0.784 0.387
SW 17 3/12/01 3.6 90.6 7.98 0.65 0.016 3.908 1.769 0.798 1.960 1.492 1.944 0.330
SW 17 6/27/01 26.0 94 8.27 0.80 0.016 4.120 1.729 0.845 1.908 1.709 1.924 0.315
Hell Fen Fen 11 8/22/01 7.4 7.60 0.19 0.002 5.860 2.313 1.038 1.160 0.279 0.424 0.367
Fen 11 10/15/00 8.6 7.65 0.23 0.002 5.655 2.198 0.971 0.981 0.281 0.499 0.319
Fen 11 6/27/01 10.9 35.6 7.49 0.45 0.003 5.685 2.468 1.041 1.099 0.225 0.795 0.310
Fen 2 10/15/00 14.7 86.4 8.12 0.11 0.002 4.781 1.737 0.773 0.770 0.253 0.348 0.171
Fen 2 6/27/01 27.7 81.8 8.12 0.37 0.004 4.507 1.821 0.921 0.761 0.237 0.591 0.223
Fen 13 6/27/01 14.1 67.9 7.75 0.08 0.001 5.237 2.295 1.005 0.682 0.334 0.702 0.334
Fen 12 6/27/01 17.9 24.7 7.40 0.94 0.004 5.902 2.313 0.867 0.877 0.235 0.408 0.094
Fen 14 6/27/01 29.6 55.6 7.95 0.31 0.005 5.015 2.036 0.983 0.679 0.164 0.300 0.319
Fen 15 6/27/01 18.9 83.4 8.04 0.16 0.003 8.038 2.620 1.107 1.146 0.461 1.457 0.304
Fen 15 6/27/01 9.2 33 7.34 0.82 0.002 7.345 2.520 1.071 1.111 0.457 1.213 0.291
Fen 16 8/22/01 21.3 7.75 0.23 0.002 5.223 2.201 0.831 0.844 0.273 0.434 0.261
Fen 16 5/3/01 23.3 52.5 8.23 0.41 0.005 4.322 2.011 0.820 1.035 0.272 0.358 0.415
Samples taken 5/02 were not run with hydride generation. For complete geochemical analysis of the samples see Szramek (2002).
1148 K. Szramek et al. / Applied Geochemistry 19 (2004) 1137–1155
Table 2
Soil extract geochemical analyses
Site Depth
(cm)
Al
(mmol/kg)
Fe
(mmol/kg)
As
(mmol/kg)
Ca
2+
(mmol/kg)
Mg
2+
(mmol/kg)
H-1 5 131 174 0.159 13.2 32.4
25 176 263 0.111 18.2 47.6
35 150 290 0.104 8.18 35.4
45 140 253 0.097 15.7 48.3
55 248 401 0.195 48.8 72.7
70 290 420 0.264 51.6 76.6
80 301 471 0.223 70.4 84.2
90 292 507 0.261 66.2 83.7
100 283 525 0.305 57.2 76.9
110 293 575 0.316 56.9 82.3
120 219 426 0.233 43.1 66.7
130 125 341 0.238 1124 603
140 127 325 0.182 2705 1467
150 91.8 254 0.130 2735 1236
H-2 5 115 191 0.057 6.79 19.9
20 92.9 171 0.041 1.40 14.2
30 80.5 144 0.029 1.76 13.3
40 76.8 168 0.061 6.26 18.0
65 117 205 0.096 15.9 32.9
90 283 458 0.198 44.1 69.6
100 179 342 0.134 28.1 58.3
150 80.8 147 0.066 19.2 30.5
220 44.2 95.2 0.045 1541 438
360 46.8 96.3 0.047 1251 396
Fig. 7. Geochemistry of soil profiles H-1 and H-2 obtained by strong acid extraction of hydroxide and carbonate phases. (A) Al
(mmol/kg) vs.soil depth. Based on the Al profile, the zone of accumulation (B horizon) extends from approximately 50 to 120 cm,
indicated by grey shaded area. (B) Fe (mmol/kg) vs. soil depth. Fe profiles generally follow the pattern of Al, but exhibit a sharper
maximum at about 110 cm depth. (C) As (mmol/kg) vs. soil depth. Arsenic also reaches its highest concentration in the zone of
accumulation, but closely mimics the sharp maximum of the Fe profile at 110 cm. (D) As/Fe (mol 10
À3
) vs. depth. The As/Fe is most
variable in the upper 25 cm, but becomes fairly constant below 25 cm at a value between 0.4 and 0.7. This As/Fe mol ratio is very close
to the bulk value observed in the unweathered core of the Marshall Fm.
K. Szramek et al. / Applied Geochemistry 19 (2004) 1137–1155 1149
As, with the marked exception of groundwaters. The
soil waters have low concentrations of both Fe and As.
In this location dissolved As and Fe concentrations are
controlled by the dissolution and precipitation of
FeOOH. In the soil column, As and Fe are essentially
immobile due to the presence of free O
2
in the unsatu-
rated zone. The fen waters have the lowest overall As and
Fe values. The low values can be attributed to the removal
of As and Fe as the water discharges into the fen. The
fen water is the result of shallow groundwater being
discharged due to permeability differences within the
local glacial deposits and the steep slopes generally
Fig. 8. Arsenic and iron concentration relations. (A) As (mM) vs. Fe (mM) for waters in the Portage catchment. The groundwaters
have higher As and Fe concentrations than all other water samples in the system. Although Fe generally increases sympathetically
with As , there is no relation between As and Fe concentrations in the groundwaters. The fen waters have the lowest As concentra-
tions, perhaps indicating a potential trap for As in the carbonate marls within the fen. (B) As/Fe (mol 10
À3
) vs. Fe (mM). The dark
band shown is the average As/Fe for the zone of accumulation in soil profiles H-1 and H-2. The groundwaters show high Fe con-
centrations and some of the lowest As/Fe values. Some of the soil waters and surface waters have As/Fe values 10 times as great as the
groundwaters, and about 100 times as great as the average As/Fe for soil profiles.
1150 K. Szramek et al. / Applied Geochemistry 19 (2004) 1137–1155
associated with these glacial features (Fig. 5). As the
groundwater discharges, any Fe and As could be pre-
cipitated out as Fe hydroxides and/or with carbonates.
In contrast, groundwaters have the highest values for
As and Fe in the study, with the As values typically 2
orders of magnitude greater than the other water types.
Portage creek samples have As values intermediate
between groundwater and fen or soil waters. This is
interesting because it would be expected that As in the
surface waters would be sorbed onto Fe-oxides due to
the oxic conditions of the surface waters. Limited redox
speciation data for dissolved As was obtained on a suite
of groundwater and surface water samples (Portage
Creek) and indicated that As(III/V) ratio for the surface
waters is $ 0.5 and the groundwaters is $ 10. This indi-
cates that the groundwater has less As(V) than As(III),
which is expected because of the low dissolved O
2
in the
groundwaters and the reduction of As(V) to As(III) in
anoxic conditions. The surface waters of Portage Creek
are well oxygenated, yet As(III) persists as a metastable
species. This is likely due to the close connection
between surface waters and groundwaters in this area
and the rapid groundwater discharge rates.
Variations in the As/Fe ratios may be used to under-
stand the chemical evolution paths of the different
groundwater samples. An increase in the As/Fe ratio
can indicate a loss of Fe relative to the As or a gain of
As relative to Fe. In a natural system Fe is controlled by
oxidation and reduction processes. Low Fe concentra-
tions in waters exposed to the atmosphere result from
removal of Fe during the formation of insoluble Fe
oxyhydroxides. A plot of As/Fe vs. Fe (Fig. 8B) shows a
relatively fixed ratio of As/Fe of approximately 10 (mol
10
À3
) for the groundwaters. The stream and fen samples
have much higher As/Fe ratios. This increase is a result
of Fe loss relative to the As when groundwaters dis-
charge and become oxygenated. Importantly, the per-
sistence of highly mobile As (III) in some of the
surface waters likely permits it to remain in solution
when Fe
+2
is rapidly oxidized to Fe
+3
and removed via
oxyhydroxide precipitation.
4.4. Arsenic and iron relationships with subsurface depth
in waters
Arsenic, Fe and As/Fe ratio are presented for the soil
and groundwaters with depth in Fig. 9. Soil waters have
the lowest Fe and As concentrations, however they have
some of the highest As/Fe ratios. In the soil column
oxic, vadose conditions and limited residence time
maintain the Fe oxyhydroxides in the zone of accumu-
lation, retaining Fe and As. The piezometer water has a
wide range in Fe values, but the As concentrations are
fairly low. The variability in Fe values can be attributed
to varying redox states within the shallowest portion of
the groundwater flow system. The low As is most likely
a result of the source water having limited As due to
removal by oxyhydroxides before the waters come into
the fen, or possibly the removal of As by the carbonate
precipitation in the fen.
The well samples show a weak inverse relationship
between As and Fe with depth. The heterogeneity of the
drift lithology (Fig. 5) complicates the depth relation-
ships, due to the possibility of changes in the source/
amount of As and/or the redox conditions in the
groundwaters with depth.
The Fe concentration in the well samples increases at
shallow well depths. Conversely the As concentrations
slightly increase in the deeper groundwater wells. This
relationship between the As and Fe places some
Fig. 9. Relationships between subsurface depth and As–Fe relations; Fe vs. depth, As vs. depth and As/Fe vs. depth. The WHO MCL
of 0.13 mM As is indicated by a dashed line. The As/Fe range for Marshall Fm. bulk and the authors weathering zone analyses is
shown as a dark band. Soil water As and Fe concentrations are very low, however they have some of the highest As/Fe ratios. Pie-
zometer water has a range of Fe values and low arsenic, but their As/Fe ratios fall close to the bulk Marshall Fm. Fe concentrations
tend to peak then decline with depth, however As concentrations appear to increase slightly with depth. The As/Fe ratio on the other
hand, is variable in the shallower groundwaters, but then stabilizes around a value of 10 (mol 10
À3
) with increasing depth.
K. Szramek et al. / Applied Geochemistry 19 (2004) 1137–1155 1151
Fig. 10. As (mM) vs. Sr (mM) in groundwaters. (A) As (mM) vs. Sr(mM) for groundwaters from the Huron watershed (this study). A
strong positive correlation (R
2
=0.8186) exists between As and Sr concentrations. This pattern is suggests that As content is best
predicted by the amount of water–rock interaction that has occurred with drift carbonate minerals (e.g increase in Sr/Ca with dis-
solution–reprecipitation reactions). (B) As (mM) vs. Sr(mM) for groundwaters in glacial drift wells from the Manistee and Kalamazoo
watersheds (USGS, 2001 data set). Note the relatively low Sr and As contents, comparable with the lowest values observed in the
Huron watershed. This is consistent with the more permeable nature of drift deposits in the Manistee and Kalamazoo watersheds.
1152 K. Szramek et al. / Applied Geochemistry 19 (2004) 1137–1155
constraints on the source of the As in the deeper wells.
During the formation of anoxic conditions, as ground-
waters progressively evolve out of contact with the
atmosphere, As bound in Fe oxyhydroxides is released
during Fe reduction. Under extreme conditions, SO
4
reduction can occur, as evidenced by the lower SO
4
À
value in the deeper well waters (Table 1). In this extreme
case, the concentration of dissolved Fe(III) may be lim-
ited by formation of insoluble sulfide minerals, and so
increase the As/Fe ratios in the groundwater. This is
further supported by the well water As/Fe being in the
range of the bulk Marshall Fm. As/Fe ratio given by
Kolker et al. (2003).
4.5. Arsenic and carbonate geochemical relationships
The divalent cation relationships in carbonate waters
are strongly controlled by solubilization and re-pre-
cipitation of carbonate minerals. It is widely established
that Mg and Sr behave as incompatible elements during
this process, and the Sr/Ca and Mg/Ca ratios of waters
increase with progressive evolution down the flow path
(Plummer, 1977; Baker et al., 1982; Banner and Hanson,
1990; Banner, 1995). In the present case, Sr or Mg could
also serve as useful indicators of waters that have
evolved for longer times in the aquifer and correlate
with As concentration. This is particularly important
because Fe behaves nonconservatively in carbonate
waters because it tends to form insoluble carbonate
solid solutions (e.g. Banner and Hanson, 1990).
Arsenic and Sr are plotted in Fig. 10A for the
groundwaters, both wells and piezometers from this
study. The Sr
2+
of the groundwaters shows a positive
trend with As (R
2
=0.8186). The Mg/Ca of the ground-
waters also tends to increase with increasing Sr, however
the relationship has an R
2
below 0.6. The increase in
Sr
2+
can indicate increased contact time, or residence
time of waters in carbonate bearing aquifers. An
increased residence time of groundwater may allow for a
higher As concentration because of the accumulation of
As as more surface area is dissolved. Thus, Sr
2+
pro-
vides a potentially useful parameter to consider in car-
bonate bearing aquifer systems, and can provide
constraints on the degree of chemical evolution in
systems where Fe typically behaves nonconservatively.
For comparison, As and Sr from glacial drift well
waters are plotted in Fig. 10B for the Kalamazoo and
the Manistee watersheds. The Thumb well waters were
not compared because these are from bedrock aquifers
that have significant admixture of saline fluids. The
Kalamazoo and Manistee watersheds are both more
open systems in comparison to the Huron watershed
(see Fig. 2). This increased subsurface to surface water
communication likely limits the reduction of FeOOH
and likewise decreases the residence time of these
groundwaters relative to those from the Huron water-
shed. Consistent with this, these watersheds have both
low As and Sr concentrations. This places these waters
at the very low end of the trend for Huron Watershed
groundwaters in Fig. 10A.
5. Conclusions
The data from the Portage catchment of the Huron
River watershed provide some new insights into the
variability of As concentrations in groundwaters and
different surface reservoirs. The data (Fig. 9A and
Tables 1 and 2) collected from a very small subsection of
the Huron watershed show as much variability in As
content (from 0.01 to 1.0 mM) as do data gathered over
the entire spectrum of reference watersheds (see Fig. 3).
The consistency between local and regional variability in
As concentrations demonstrates that As concentration
in the groundwaters is not controlled on a regional scale
in the Huron watershed. The hydrological differences
between the 4 watersheds play an important role in the
variability seen in the As concentrations. By comparing
the 4 watersheds it becomes apparent that As-bearing
units may behave differently over a large regional scale.
Arsenopyrite is the ultimate source of As in south-
eastern Michigan (Kolker et al., 2003). However, it is
likely that the As in the groundwaters is derived from
both the Marshall Fm. and Fe oxides within the glacial
drift and soil column (Kim et al., 2002; Kolker et al.,
2003). Arsenic rich Fe-oxides are found in glacial mate-
rial associated with the Marshall Sandstone and Cold-
water Shale in Michigan (Kolker et al., 2003). At one
time all the As in the region was incorporated in sulfide
minerals. The erosion of source rock and the incor-
poration into glacial drift sequences allows for a com-
plex interstratification of multiple exposure horizons
and weathering zones that overlie the intact bedrock.
The oxic open system weathering conditions in unsatu-
rated zones leads to formation of Fe-oxyhydroxides,
that very effectively retain As in the soil profiles. Cur-
rently the sulfide minerals in the Marshall Fm. are
described as pristine (Kolker et al., 2003). This indicates
that reducing conditions are maintained in the Marshall
Fm. Thus, the fluctuating conditions in the glacial drift
may play a large role in forming the precursor material
that can then be mobilized under reducing condition in
deeper portions of the groundwater flow system.
Strontium proved to be the most diagnostic indicator
of As concentrations in the groundwaters. The increase
in Sr
2+
with the accompanying increase in As con-
centrations indicates that recrystallization in the aquifer
is an important process. Strontium is especially useful in
waters whose chemistry is largely controlled by carbon-
ate mineral equilibrium. In the Portage Catchment, the
glacial drift groundwaters that have the highest As
concentrations tend be more geochemically evolved,
K. Szramek et al. / Applied Geochemistry 19 (2004) 1137–1155 1153
suggesting that higher As concentrations may be asso-
ciated with longer groundwater residence times. Resi-
dence times likely relate to the regional permeability
differences in the glacial drift aquifers allowing for faster
flow and lower As concentrations in the open sandy
drift systems as compared with the more clay rich tills.
Acknowledgements
We thank C. Lambert and T. Huston for assistance
with the metals analysis and soil extractions. We also
thank E.L. Williams for manuscript editing. Grants
from the University of Michigan (Toxic Metals in the
Geosphere) and from NSF-EAR-0208182 supported
this work.
References
Almendinger, J.E., Leete, J.H., 1998. Regional and local
hydrogeology of calcareous fens in the Minnesota River
Basin, USA. Wetlands 18, 184–202.
Baker, P.A., Gieskes, J.M., Elderfield, H., 1982. Diagenesis of
carbonates in deep-sea sediments- evidence from Sr/Ca ratios
and interstitial dissolved Sr
+2
data. J. Sed. Petrol. 52, 71–82.
Banner, J.L., 1995. Application of trace element and isotope
geochemistry of strontium to studies of carbonate diagenesis.
Sedimentol. 42, 805–824.
Banner, J.L., Hanson, G.H., 1990. Calculation of simultaneous
isotopic and trace element variations during water-rock
interactions with applications to carbonate diagenesis. Geo-
chim. Cosmochim. Acta 54, 3123–3137.
Boyer, M.L.H., Wheeler, B.D., 1989. Vegetation patterns in
spring-fed calcareous fens: calcite precipitation and con-
straints on fertility. J. Ecol. 77, 597–609.
Chen, M., Ma, L.Q., 2001. Comparison of three aqua regia
digestion methods for twenty Florida soils. Soil Sci. Soc.
Am. J. 65, 491–499.
Chowdhury, T.R., Basu, G.K., Mandal, B.K., Biswas, B.K.,
Samanta, G., Chowdhury, U.K., Chanda, C.R., Lodh, D.,
Roy, S.L., Saha, K.C., Roy, S., Kabir, S., Quamruzzaman,
Q., Chakraborti, D., 1999. Arsenic poisoning in the Ganges
delta. Nature 401, 545–546.
Courtin-Nomade, A., Bril, H., Ne
´
el, C., Lenain, J F., 2003.
Arsenic in iron cements developed within tailings of a former
metalliferous mine-Enguiale
´
s, Aveyron, France. Appl. Geo-
chem. 18, 395–408.
Cullen, W.R., Reimer, K.J., 1989. Arsenic speciation in the
environment. Chem. Rev. 89, 713–764.
DeKanel, J., Morse, J.W., 1978. The chemistry of orthopho-
sphate uptake from seawater onto calcite and aragonite.
Geochem. Cosmochim. Acta 42, 1335–1340.
Dorr Jr., J.A., Eschman, D.F., 1970. Geology of Michigan. The
University of Michigan Press, Ann Arbor, USA.
Dowling, C.B., Poreda, R.J., Basu, A.R., Peters, S.L., Aggar-
wal, P.K., 2002. Geochemical study of As release mechan-
isms in the Bengal Basin groundwater. Water Resour. Res.
38, 1–18.
Drever, J.I., 1997. The Geochemistry of Natural Waters:
Surface and Groundwater Environments. Prentice Hall,
Upper Saddle River, NJ.
Glaser, P.H., Janssens, J.A., Siegel, D.I., 1990. The response of
vegetation to chemical and hydrological gradients in the Lost
River peatland, northern Minnesota. J. Ecol. 78, 1021–1048.
Hossner, L.R., 1996. Dissolution for Total Elemental Analysis
in Methods of Soil Analysis. Part 3. Chemical Methods. Soil
Science Society of America, Madison.
Harvey, C.F., Swartz, C.H., Badruzzaman, A.B.M., Keon-
Blute, N., Yu, W., Ali, M.A., Jay, J., Beckie, R., Niedan, V.,
Brabander, D., Oates, P.M., Ashfaque, K.N., Islam, S.,
Hemond, H.F., Ahmed, M.F., 2002. Arsenic mobility and
groundwater extraction in Bangladesh. Science 298, 1602–
1606.
Kim, M J., 1999. Arsenic Dissolution and Speciation in
Groundwater of Southeast Michigan. PhD Thesis, Ann
Arbor, Univ. Michigan.
Kim, M J., Nriagu, J., Haack, S., 2000. Carbonate ions and
arsenic dissolution by groundwater. Environ. Sci. Technol.
32, 3094–3100.
Kim, M J., Nriagu, J., Haack, S., 2002. Arsenic species and
chemistry in groundwater of southeast Michigan. Environ.
Poll. 120, 379–390.
Klaue, B., Blum, J.D., 1999. Trace analyses of As in drinking
water by inductively coupled plasma mass spectrometry: high
resolution versus hydride generation. Anal. Chem. 71, 1408–
1414.
Kolker, A., Haack, S.K., Cannon, W.F., Westjohn, D.B., Kim,
M J., Nriagu, J., Woodruff, L.G., 2003. Arsenic in south-
eastern Michigan. In: Welch, A.H., Stollenwerk, K.G. (Eds.),
Arsenic in Ground Water. Kluwer, Netherlands, pp. 281–
294.
Komor, S.C., 1994. Geochemistry and hydrology of a calcar-
eous fen within the Savage Fen wetlands complex, Minne-
sota, USA. Geochim. Cosmochim. Acta 58, 3353–3367.
Korte, N.E., Fernando, Q., 1991. A review of arsenic (III) in
groundwater. Crit. Rev. Environ. Controls 21, 1–39.
Mandal, B.K., Chowdhury, T.R., Samanta, G., Basu, G.K.,
Chowdhury, P.P., Chanda, C.R., Lodh, D., Karan, N.K.,
Dahr, R.K., Tamili, D.K., Saha, K.C., Chakraborti, D.,
1996. Arsenic in groundwater in seven districts of West Ben-
gal, India-the biggest As calamity in the world. Curr. Sci. 70,
976–986.
Mallick, S., Rajagopal, N.R., 1996. Groundwater development
in the As affected alluvial belt of West Bengal-some ques-
tions. Curr. Sci. 70, 956–958.
McArthur, J.M., Ravenscroft, P., Safiulla, S., Thirlwall, M.F.,
2001. Arsenic in groundwater: testing pollution mechanisms
for sedimentary aquifers in Bangladesh. Water Resour. Res.
37, 109–117.
Mulcahy, J., 2003. Jury’s Still Out on Road Brine. The Ann
Arbor News, Ann Arbor.
Ne
´
el, C., Bril, H., Courtin-Nomade, A., Dutreuil, J P., 2003.
Factors affecting natural development of soil on 35-year-old
sulfide-rich mine tailings. Geoderma 111, 1–20.
Nickson, R.T., McArthur, J.M., Burgess, W.G., Ahmed, K.M.,
Ravenscroft, P., Rahman, M., 1998. Arsenic poisoning of
Bangladesh groundwater. Nature 395, 338.
Nickson, R.T., McArthur, J.M., Ravenscroft, P., Burgess,
W.G., Ahmed, K.M., 2000. Mechanism of As release to
1154 K. Szramek et al. / Applied Geochemistry 19 (2004) 1137–1155
groundwater, Bangladesh and West Bengal. Appl. Geochem.
15, 403–413.
Nicolli, H.B., Suriano, J.M., Peral, M.A.G., Ferpozzi, L.H.,
Baleani, O.A., 1989. Groundwater contamination with As
and other trace-elements in an area of the Pampa, province
of Cordoba, Argentina. Environ. Geol. Water Sci. 14, 3–16.
Nordstrom, D.K., 2002. Worldwide occurrences of arsenic in
ground water. Science 296, 2143–2145.
Plummer, L.N., 1977. Defining reactions and mass transfer in
part of the Floridan Aquifer. Water Resour. Res. 13, 801–812.
Rheaume, S.J., 1991, Hydrologic Provinces of Michigan: US
Geol. Surv. Water-Resour. Invest. Rep. 91-4120, pp. 1–73.
Savage, K.S., Tingle, T.N., O’Day, P.A., Waychunas, G.A.,
Bird, D.K., 2000. Arsenic speciation in pyrite and secondary
weathering phases, Mother Lode Gold District, Tuolumne
County, California. Appl. Geochem. 15, 1219–1244.
Smedley, P.L., Kinniburgh, D.G., 2002. A review of the source,
behavior and distribution of arsenic in natural waters. Appl.
Geochem. 17, 517–568.
Smedley, P.L., Nicolli, H.B., Macdonald, D.M.J., Barros, A.J.,
Tullio, J.O., 2002. Hydrogeochemistry of arsenic and other
inorganic constituents in groundwaters from La Pampa,
Argentina. Appl. Geochem. 17, 259–284.
Stollenwerk, K.G., 2003. Geochemical processes controlling
transport of arsneic in groundwater: a review of adsorption.
In: Welch, A.H., Stollenwerk, K.G. (Eds.), Arsenic in
Ground Water. Kluwer, Netherlands, pp. 67–100.
Strawn, D., Donner, H., Zavarin, M., McHugo, S., 2002.
Microscale investigation into the geochemistry of arsenic,
selenium, and iron in soil developed in pyritic shale materials.
Geoderma 108, 237–257.
Szramek, K.J., 2002, Controls on carbonate equilibria and
mass transport in a glaciated mid-continent watershed
[Master’s thesis]: Ann Arbor, Univ. Michigan.
Twenter, F.R., Knutilla, R.L., Nowlin, J.O., 1976. Water
Resources of Washtenaw County, Michigan. United States
Geological Survey in cooperation with the Washtenaw
County Metropolitan Planning Commission, Ann Arbor.
Ure, A., Berrow, M., 1982. Chapter 3. The elemental con-
stituents of soils. In: Bowen, H.J.M. (Ed.), Environ-
mental Chemistry. Royal Society of Chemistry, London,
pp. 94–203.
US Geological Survey, 2001. National Water Information
System (NWISWeb) data available on the World Wide Web,
accessed 10 June 2001. Available from: http://waterdata.
usgs.gov/nwis/.
Walter, L.M., Burton, E.A., 1988. The effect of orthopho-
sphate on carbonate mineral dissolution kinetics. Chem.
Geol. 56, 313–323.
Webster, J.G., 1999. Arsenic. In: Marshall, C.P., Fairbridge,
R.W. (Eds.), Encyclopedia of Geochemistry. Chapman Hall,
London, pp. 21–22.
Wedepohl, K.H., 1995. The composition of the continental
crust. Geochemica et Cosmochimica Acta 59, 1217–1232.
Welch, A.H., Helsel, D.R., Focazio, M.J., Watkins, S.A., 1999.
Arsenic in groundwater supplies of the United States. In:
Chappell, W.R., Abernathy, C.O., Calderon, R.L. (Eds.),
Arsenic Exposure and Health Effects. Elsevier Science, New
York, pp. 9–17.
Welch, A.H., Westjohn, D.B., Helsel, D.R., Wanty, R.B., 2000.
Arsenic in ground water of the United States: occurrence and
geochemistry. Ground Water 38, 560–589.
K. Szramek et al. / Applied Geochemistry 19 (2004) 1137–1155 1155