Distribution pattern of ambient cd in wetland ponds ditributed along an industrial complex
Bạn đang xem bản rút gọn của tài liệu. Xem và tải ngay bản đầy đủ của tài liệu tại đây (401.02 KB, 11 trang )
Distribution pattern of ambient cadmium in wetland
ponds distributed along an industrial complex
Shamik Das, B.B. Jana
*
Aquaculture and Applied Limnology Laboratory, Department of Zoology, University of Kalyani,
Kalyani 741 235, West Bengal, India
Received 27 February 2003; received in revised form 11 September 2003; accepted 7 October 2003
Abstract
Water and sediment samples collected from 18 wetland ponds within and outside industrial areas were examined for
cadmium concentration and water quality parameters during the period of January to July 1996. The Cd contents in
gill, liver, mantle and shell of freshwater mussel (Lamellidens marginalis) as well as leaves and roots of water hyacinth
Eichhornia those occurred in these ponds were also estimated. Cd concentration ranged from 0.006 to 0.7025 mg/l in
water and from 7 to 77 lg/g dw in sediments of all the ponds investigated. The amount of Cd occurring in water and
sediment was much higher in concentrations in the ponds located in Captain Bheri and Mudiali farm close to industrial
areas, compared to remaining ponds located outside the industrial belt. Lamellidens marginalis procured from Mudiali
and Captain Bheri ponds showed regardless of size, tissue and season of collection significantly higher Cd concentration
than did those from other ponds. Likewise, tissue Cd in Eichhornia collected from Mudiali pond was as high as 125–152
lg/g dw in root and 21–63 lg/g dw in leaves compared to 40–108 lg/g dw in root and 9–43 lg/g dw in leaves in the
remaining ponds. Seasonal variability of Cd was clear-cut; the concentration was relatively higher in water and sedi-
ment in all ponds during summer than during monsoon season or winter. Size-wise, smaller groups showed the highest
concentrations of Cd in all tissues of Lamellidens compared with medium and large size groups. Concentration fac-
tor for all tissues of Lamellidens regardless of size and season, was inversely proportional with the ambient Cd con-
centrations. Concentration factor estimated for all tissues in all ponds and all seasons was in the order:
liver > gill > shell > mantle. As all ponds located outside the industrial belt showed Cd concentrations ranging from
0.006 to 0.049 mg/l, it is suggested that these wetlands do not pose serious risk to the environment.
Ó 2003 Elsevier Ltd. All rights reserved.
Keywords: Wetland ponds; Cadmium; Lamellidens marginalis; Eichhornia crassipes
1. Introduction
Cd with an average concentration of 0.15 ppm
(Weast, 1969–1970), ranks as the 67th element in order
of abundance in the earth’s crust (Trotman-Dickenson,
1973). It normally occurs as an air-borne and aquatic
contaminant associated with Pb-smelting and electro-
plating processes. Increased concentrations of Cd
deposition in impounded water occurs through atmo-
spheric fallout and runoff (Borg et al., 1989). The global
anthropogenic emission to the atmosphere is estimated
at 7.6 · 10
6
kg Cd/year (Nriagu and Pacyna, 1988).
Cd contamination of impounded waters has posed an
important threat to human health because of its estab-
lished harmful effect in the food chain of fishes and
human health.
*
Corresponding author. Tel.: +91-033-5826-323; fax: +91-
033-5828-282.
E-mail address: (B.B. Jana).
0045-6535/$ - see front matter Ó 2003 Elsevier Ltd. All rights reserved.
doi:10.1016/j.chemosphere.2003.10.016
Chemosphere 55 (2004) 175–185
www.elsevier.com/locate/chemosphere
A large number of growing industrial complexes,
such as a electroplating, cable, alloy, vehicle, plastic
pigments, dyes in many parts of India, and especially in
the vicinity of Calcutta city often have resulted in
indiscriminate discharge of industrial effluents with high
Cd load. These contaminants finally find their ways into
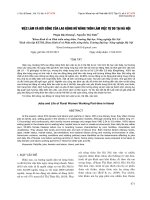
the neighboring wetlands (Fig. 1) and thereby damage
ecosystem health.
According to the World Health Organisation (1971),
the maximum permissible limit for Cd in drinking water
is 0.01 mg/l. However, detected concentrations in many
natural bodies of water are often much higher (Roth and
Hornung, 1977; Murphy et al., 1978; Mathew and
Menon, 1983). For example, in some fish inhabiting
natural lakes, a concentration of 13.6 lg/g Cd has been
detected (Murphy et al., 1978), while provisional toler-
ance for humans range from 0.4 to 0.5 lg Cd/person/
week.
In general, fishes growing even in sublethal contam-
inated environments show high levels of Cd in their
tissues due to bio-accumulation through the aquatic
food chain. For example, Cd concentration in fish from
Bombay fish markets ranges from 16 to 176 lg/g (Pillai,
1983), and is in the range of 2–417 lg/g from other parts
of the world (Anand, 1978). Such concentration is
potentially hazardous to human health as they exceed
the tolerable Cd intake (0.4–0.5 mg/person/week). Thus,
fish or animals living in Cd contaminated aquatic habi-
tats pose hazard to human health if they are part of
human food chain.
Information pertaining to Cd distribution in fresh-
water habitats in relation to Cd accumulation in animals
is sparse in the Indian sub-continent. With respect to
other regions of the world, data available on alpine lakes
suggest a total anthropogenic discharge of 3.3 t Cd/year
into Ontario waterways (Environment Canada and
Health Canada, 1994). Fifty seven lakes in Central
Ontario, Canada have a geometric mean Cd concen-
tration of 10 ng/l (Stephenson and Mackie, 1988). Wavy
Lake within the regional municipality of Sudbury, On-
tario, Canada, had a water Cd concentration of 4780
ng/l in 1992 (Taylor et al., 1995).
Fig. 1. General location of study ponds.
176 S. Das, B.B. Jana / Chemosphere 55 (2004) 175–185
The ability of certain freshwater plants and animals
to accumulate metals above ambient water concentra-
tion is well documented. Using these organisms as
indicators, bio-availability of metals from the environ-
ments can be monitored over extended period of time.
However, environmental metal level is not the only
factor which influences the metal content of mussels, as
both the size of the animals and the seasons markedly
affect these parameters (Penthreath, 1973; Boyden, 1977;
Majori et al., 1978). Among molluscs, bivalve and gas-
tropods are excellent bio-accumulators for a wide range
of pollutants (Simkiss, 1983; Everaarts, 1990; Living-
stone, 1991; Das and Jana, 1999) (Table 1). In general,
they are filter feeder, herbivorous and have the potential
to bio-accumulate contaminants that normally occur in
the water or sediment at concentrations too low for
detection by routine monitoring technique. Thus, they
are considered ideal species for environmental moni-
toring. Further more, the sedentary nature of these
animal is helpful in the interpretation of bio-accumula-
tion data (Short and Sharp, 1989; Livingstone, 1991).
Information about the level of metal pollution and
the distribution of bivalves in freshwater habitats of
India is scarce. The purpose of this study was to examine
the distribution of Cd concentrations of water and sedi-
ment in relation to tissue Cd concentration in freshwater
bivalve, Lamellidens marginalis in freshwater ponds
along a Cd gradient from industrial complex to uncon-
taminated areas.
2. Materials and methods
Eighteen wetland ponds were selected for the present
investigation. These wetlands are located within a radius
of 60 km of the University of Kalyani. Some rain-fed
wetlands receive industrial effluents; others are situated
in an uncontaminated area (Fig. 1). These wetlands are
used for irrigation of agriculture crops, domestic use
and fish culture. The selected wetlands were distributed
along a pollution gradient ranging from very high level
to low or uncontaminated areas. The pond area ranged
Table 1
Cadmium accumulation in various tissues of bivalve molluscs under different ambient Cd concentrations
Name and tissues of bivalves Cd accumulation Condition References
Lamellidens marginalis
Gill 15–258 lg/g dw Field experiment (Cd concentra-
tion: 0.006–0.7025 ppm)
Present study
Liver 17–502 lg/g dw
Shell 10–196 lg/g dw
Mantle 5–67 lg/g dw
Lamellidens marginalis
Gill 536 lg/g dw Cd concentration: 30 ppm,
exposure time: 40 days
Das and Jana (1999)
Liver 494 lg/g dw
Shell 335 lg/g dw
Mantle 211 lg/g dw
Unio elongatus
Foot 102 lg/g dw Cd concentration: 50 ppb,
exposure time: 60 days
Badino et al. (1991)
Gills 196 lg/g dw
Mantle 95 lg/g dw
Crassostrea virginica
Gill 275 lg/g dw – Zaroogian (1980)
Gill 450 pmol Cd/g – Roesijadi and Unger (1993)
Elliptio complanata
Total soft tissue 20 lg/g dw/72 h Exposure time: 115 days Wang and Evans (1993)
Mytilus edulis
Kidney 300 lg/g dw Exposure time: 40 days Everaarts (1990)
Gills 130 lg/g dw
Hepatopancreas 170 lg/g dw
Foot 110 lg/g dw
Mantle 30 lg/g dw
S. Das, B.B. Jana / Chemosphere 55 (2004) 175–185 177
from 0.1 to 6 ha with a depth range of 1.5–3 m (Table 2).
Natural populations of floating macrophytes Eichhornia
are common in about 39% the wetlands. Freshwater
bivalve, Lamellidens marginalis is found in almost all
ponds.
Samples of water and surface sediment were collected
from each pond during summer, monsoon and winter
seasons in 1996. The samples from each pond were
pooled into a composite sample. As ponds located in
contaminated area had moderate water spread area and
received industrial effluents from a point source, the
collected sample represented the true picture of that
body of water.
Samples were collected in one liter polythene bottle,
acidified with concentrated HNO
3
and were brought to
the laboratory. Each one liter sample was then concen-
trated to 10 ml volume by slow evaporation. 20 ml
HNO
3
:H
2
SO
4
(1:3) was added to the sample, and the
mixture was evaporated to near dryness. The residue
was extracted with 50 ml double distilled water. Cd
content of the sample was analysed by direct aspiration
of the aqueous digest extract into atomic absorption
spectrophotometer (Model UV 2201), following the
method described in APHA (1995). The instrument was
calibrated with metal standards,and Oyster Cd stan-
dards procured from of National Research Council of
Canada.
The surface sediment (0–2.5 cm) of pond was col-
lected by suitable bottom sampler (Van Raaphorst and
Brinkman, 1984) from different sites in the pond and
then mixed to make a homogenous sediment sample.
One hundred ml sample was transferred to acid-washed
250 ml conical flask; concentrated HNO
3
(10 ml) was
added and the mixture was digested to a volume of
approximately 3 ml. Digests were allowed to cool to 55
°C, followed by addition of 10 ml concentrated HNO
3
and 30% (v/v) H
2
O
2
(1.0 ml). The flask was returned to
hot plate and digested to approximately 3 ml. The di-
gests were diluted to 25 ml with double distilled deion-
ised water and transferred to a glass bottle prior to
analysis. Cd concentration was analysed by direct aspi-
ration of the aqueous digest into AAS as described by
Walsh et al. (1994).
Freshwater bivalves (Lamellidens marginalis) were
collected from various sites in the pond using a 50 cm
quadrate hand grab sampler (APHA, 1995). The speci-
mens were washed thoroughly in tap water, blot-dried
and their length and wet weights were recorded. Animals
were sorted into small (12 ± 1.3 g; 3.8 ± 1.3 cm), medium
(31 ± 2.5 g; 6 ± 1.5 cm) and large (55 ± 4 g; 9.5 ± 2.5 cm)
classes, each comprising 12 animals.
Water and sediment samples of the pond were
monitored for Cd concentration using standard AAS
described by Walsh et al. (1994). Water samples from
each pond were also monitored for other water para-
meters (temperature, pH, dissolved oxygen, total hard-
ness, total alkalinity) to specification given by APHA
(1995).
Changes in fresh weight in Lamellidens were recorded
on each sampling day. Lamellidens were carefully dis-
Table 2
Physico-chemical parameters of investigated ponds throughout the investigated period
Ponds Area
(ha)
Depth
(m)
Temp.
(°C)
DO
(mg/l)
pH Total
alkalinity
(mg/l)
Total
hardness
(mg/l)
Ambient cadmium
concentration
Water
(mg/l)
Sediment
(lg/g dw)
Captain
Bheri
8 1.5 21–34 3.5–4.8 6.2–6.45 120–142 150–165 0.458–0.6175 56–65
Mudiali 8 2.0 21–33 3.4–4.0 6.0–6.4 105–125 117–137 0.502–0.705 63–77
P3 0.2 2.0 20–34 4.9–6.5 6.9–7.3 130–147 153–160 0.032–0.049 20–26
P4 0.5 1.5 19–34 7.8–8.0 7.8–8.5 115–150 142–159 0.0235–0.016 14–20
P5 0.1 1.5 20–35 9.0–11.0 7.0–7.9 117–127 120–132 0.017–0.0135 10–13
P6 0.1 1.0 21–34 8.5–10.0 7.6–8.5 100–132 120–158 0.049–0.039 19–25
P7 0.2 1.0 20–33 8.0–11.0 7.0–7.9 107–150 130–142 0.0162–0.010 8–12
P8 0.5 1.0 21–35 7.8–9.3 7.6–8.5 127–135 130–147 0.0162–0.0115 1.5–11
P9 0.2 1.5 20–34 8.0–11.5 7.6–8.0 138–142 149–159 0.0125–0.0082 7–10
P10 1.0 1.0 21–35 7.3–10.5 6.9–7.8 152–160 150–167 0.009–0.006 7.5–10
P11 1.0 2.0 21–35 8.3–9.3 7.0–7.5 145–170 159–180 0.008–0.0067 8.0–9.5
P12 1.0 1.5 20–34 7.3–10.5 6.8–6.9 95–130 109–187 0.008–0.007 7.5–8.5
P13 1.0 1.5 20–35 7.5–10.0 8.0–8.5 95–117 107–125 0.0147–0.016 11–15
P14 0.5 1.5 20–35 6.9–10.0 7.3–8.1 105–119 119–137 0.032–0.017 13–18
P15 0.5 1.0 21–35 7.9–11.0 6.9–7.5 109–122 119–145 0.011–0.009 8.3–12
P16 0.3 2.0 20–33 8.0–11.5 7.5–7.8 109–129 130–149 0.035–0.025 15–19
P17 0.5 1.0 21–34 7.5–10.0 7.3–7.8 100–130 137–149 0.009–0.0061 27–35
P18 0.5 1.5 20–33 7.3–9.5 7.4–7.9 107–129 137–157 0.0081–0.006 7–8.9
178 S. Das, B.B. Jana / Chemosphere 55 (2004) 175–185
sected for gill, liver, mantle and shell. The shell valves
were opened with a shell-valve opener. The mantle, liver
and gill were carefully removed and placed on separate
watch glasses on top of chipped ice in ice-buckets. The
wet weight of tissues was recorded on an electrical bal-
ance after blotting surface moisture with filter paper. In
addition to Lamellidens, floating macrophyte, Eichhor-
nia crassipes were collected manually and washed thor-
oughly in tap water. The root and leaves were separated
and dried for tissue Cd extraction and estimation by the
method of Walsh et al. (1994).
Bio-concentration factor (CF), reflecting the accu-
mulation ability for Cd was calculated for each tissue
using the formula given by Taylor (1983):
CF ¼
TCd
WCd or SCd
where TCd ¼ cadmium content in animal tissue (lg/g
dw), WCd or SCd ¼ average ambient cadmium concen-
tration of water (mg/l) or sediment (lg/g dw) during the
period of experiment.
Mean Cd concentrations (SE±) for each pond was
obtained. All pond, on the basis of their Cd concentra-
tion were grouped in to (i) with values within the per-
missible limit, 0.05 mg/l for drinking water imposed by
Environmental Protection Agency (1986) and (ii) with
value above permissible values or highly contaminated.
One way analysis of variance and LSD test were used to
determine Cd distribution among ponds during various
seasons and tissues as well as the size-group of animals.
The relationship between Cd concentration factor and
ambient Cd concentration was determined by the use of
the first order equation. The level of significance was
accepted at P < 0:05.
3. Results
3.1. Ambient water cadmium
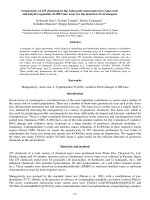
The concentration of ambient Cd in water was highly
variable according to the season and the location of the
ponds. Cd concentration ranged from 0.006 to 0.7025
mg/l (in or for) all ponds throughout the investigation
period. Cd concentration was higher (0.63–0.7025 mg/l)
in ponds designated as numbers 1 and 2 and located in
contaminated areas. Uncontaminated ponds designated
as numbers 3–18 had a Cd concentration of 0.006–0.049
mg/l. Cd concentration in each pond was significantly
higher during the summer than during the monsoon and
winter (Fig. 2). There was about 86 fold variability in
ambient Cd (0.0081 and 0.7025 mg/l) among all ponds
during the summer (ANOVA, P < 0:05). Ponds (11%)
located in industrial areas showed as high as 0.617–
0.7025 Cd mg/l, implying direct impact of industrial
effluents. Cd concentrations in the remaining 16 ponds
(89%) ranged from 0.0081 to 0.049 mg/l, but, remained
within the permissible Cd limit (0.05 mg/l) for drinking
water as per standards set by Environmental Protection
Agency––US (1986) for the USA, and therefore posed
no potential threat to the environment under local
conditions.
Spatial distribution of Cd was also variable
(P < 0:05) during winter and monsoon. Similar to the
scenario found for the summer, two industrial ponds
(11%) showed higher values than the remaining 16
ponds (89%) during winter and monsoon.
In general, Cd concentration in water varied in three
seasons of the year (ANOVA, P < 0:05) depending upon
the leaching, runoff water or dilution by rainfall. Winter
values (0.007–0.6175 mg/l) were lower than those of
summer (0.0081–0.7025 mg/l), but higher than those of
monsoon (0.0062–0.502 mg/l). In these ponds, summer
values were 12% and 31% higher than those observed
during winter and monsoon, respectively.
3.2. Ambient sediment cadmium
The Cd content in the sediment ranged from 7 to 77
lg/g dw Cd concentration was distinctly higher in pond-
1 (63–77 lg/g dw) and in pond-2 (55–65 lg/g dw) than in
remaining ponds located at uncontaminated sites (7–26
lg/g dw). Summer Cd values varied between 8.5 and 77
lg/g dw, indicating a significant difference (ANOVA,
P < 0:05) among the 18 ponds. Only about 11% of
ponds were characterized by extremely high Cd con-
centration that ranged from 65 to 77 lg/g dw in summer.
Remaining 89% ponds showed concentration ranging
from 8.9 to 35 lg/g dw (Fig. 2).
The spatial distribution of sediment Cd varied (AN-
OVA, P < 0:05) during winter and monsoon. Two
ponds (11%) had higher values than remaining 89%
ponds during winter and monsoon. The remaining
ponds showed winter (7–30 lg/g dw) and monsoon (7–27
lg/g dw) values that were 64–90% lower than the former
two ponds. Seasonal variability (ANOVA, P < 0:05) in
sediment Cd remained was identical to that of
water. The values were significantly higher (ANOVA,
P < 0:05) in the summer (5.8–9% higher than winter and
11.7–18% higher than monsoon). During the summer,
Cd concentrations in Captain Bheri pond (pond-2) was
13.8% higher than during monsoon and 6.2% higher
than in winter. Similar trend was found in the rest of the
ponds.
3.3. Cadmium in Lamellidens
Cd was detected in the shell and liver of Lamellidens
collected from all 18 ponds. However, the gills were
analysed from only six and mantle from only seven
ponds.
S. Das, B.B. Jana / Chemosphere 55 (2004) 175–185 179
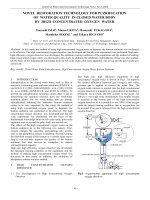
Lamellidens from Mudiali (pond-1) and Captain
Bheri (pond-2) regardless of their size, tissue and col-
lection season showed significantly higher (P < 0:05) Cd
concentration than those from other ponds. Cd con-
centration in smaller animal ranged between 254 and
502 lg/g dw in liver, 189–258 lg/g dw in gill, 160–196 lg/
g dw in shell and 41–67 lg/g dw in mantle. In other
ponds it compared to ranged from 10 to 189 lg/g dw in
liver, 9–128 lg/g dw in gill, 4.7–100 lg/g dw in shell and
2–23 lg/g dw in the mantle (Figs. 3–5).
Cd concentrations were highest in small animals (10–
502 lg/g dw in liver, 9–258 lg/g dw in gill, 4.7–196 lg/
g dw in shell and 2–67 lg/g dw in mantle) and lowest in
large individuals (7.5–451 lg/g dw in liver, 3.7–189 lg/
g dw in gill, 3–196 lg/g dw in shell and 2–57 lg/g dw in
mantle). With the exception of Captain Bheri and Mu-
diali, variability in tissue Cd in smaller animals from 16
ponds was highest in liver (99.8%) followed by shell
(90%), gill (80%) and mantle (78%). In general, summer
values for Cd were about 11–28% higher than they were
(A) WATER
0
0.1
0.2
0.3
0.4
0.5
0.6
0.7
0.8
0.9
123456789101112131415161718
PONDS
PONDS
Cadmium content of water (mg/l)
Summer Winter Monsoon
(B) SEDIMENT
0
10
20
30
40
50
60
70
80
90
1 2 3 4 5 6 7 8 9 10 11 12 13 14 15 16 17 18
Cadmium content of sediment (µg/g dw.)
Summer Winter Monsoon
Fig. 2. Mean (±SE) concentration of water (A) and sediment (B) cadmium in 18 investigated ponds during three different seasons.
Note the clear-cut differences in water and sediment cadmium distribution.
180 S. Das, B.B. Jana / Chemosphere 55 (2004) 175–185
GILL
0
100
200
300
400
500
PONDS
PONDS
PONDS
PONDS
Gill Cd content (µg/g dw.)Liver Cd content (µg/g dw.)
Shell Cd content (µg/g dw.)
Mantle Cd content (µg/g dw.)
Summer Winter Monsoon
LIVER
0
100
200
300
400
500
123456789101112131415161718
Summer Winter Monsoon
SHELL
0
100
200
300
400
500
123456789101112131415161718
Summer Winter Monsoon
MANTLE
0
100
200
300
400
500
1 2 3 4 5 6 7 8 9 101112131415161718
Summer Winter Monsoon
1 2 3 4 5 6 7 8 9 10 11 12 13 14 15 16 17 18
Fig. 4. Cadmium accumulation in four different tissues of medium group Lamellidens procured from 18 ponds in three different
seasons. Note the clear-cut variability of tissue cadmium in different seasons and investigated ponds.
GILL
0
100
200
300
400
500
123456789101112131415161718
PONDS
PONDS
PONDS
PONDS
Gill Cd content (µg/g dw.)
Liver Cd content (µg/g dw.)
Mantle Cd content (µg/g dw.)
Shell Cd content (µg/g dw.)
Summer Winter Monsoon Summer Winter Monsoon
LIVER
0
100
200
300
400
500
123456789101112131415161718
Summer Winter Monsoon
SHELL
0
100
200
300
400
500
123456789101112131415161718
MANTLE
0
100
200
300
400
500
123456789101112131415161718
Summer Winter Monsoon
Fig. 3. Cadmium accumulation in four different tissues of small group Lamellidens procured from 18 ponds in three different seasons.
Note the clear-cut variability of tissue cadmium in different seasons and investigated ponds.
S. Das, B.B. Jana / Chemosphere 55 (2004) 175–185 181
in winter (liver––20–492 lg/g dw, gill––12–221 lg/g dw,
shell––9–177 lg/g dw, and mantle––2–55 lg/g dw) and
5–15% higher than monsoon (17–389 lg/g dw in liver,
9–198 lg/g dw in gill, 4–16 lg/g dw in shell and 1.5–44
lg/g dw in mantle).
4. Concentration factor (CF)
CF for all tissues of Lamellidens regardless of size
and season, were higher in those ponds that had
low Cd concentration and low in those with high
ambient Cd concentration. CF estimated for all tissue
in all ponds during all seasons was in the order:
liver > gill > shell > mantle. The Cd concentrations in all
tissues were less in the summer than in the winter and
monsoon. CF among smaller animals were 9–15%
higher than those for medium-sized animals and 14–37%
higher than the larger animals (Table 3).
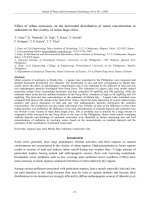
5. Cadmium in Eichhornia
The natural population of Eichhornia was observed
in seven out of 18 ponds. Eichhornia collected from
Mudiali (pond-1) and Captain Bheri (pond-2) had sig-
nificantly higher (P < 0:05) Cd concentrations than did
the remaining ponds. In general, tissue Cd in Eichhornia
collected from Mudiali pond was as high as 125–152
lg/g dw in root and 21–63 lg/g dw in leaves compared to
Table 3
Range of the values of concentration factor for different tissues of Lamellidens marginalis procured from 18 ponds during the period of
investigation
Tissue Summer Winter Monsoon
Small Medium Large Small Medium Large Small Medium Large
Liver 600–4050 550–3095 445–3000 620–4150 555–3295 490–2100 631–4612 565–3193 500–2193
Gill 288–2072 205–1901 195–1702 290–2575 225–2057 200–1780 302–3750 250–2666 175–1765
Shell 285–2067 271–1950 262–1900 290–2170 280–1970 295–1970 330–2795 302–2009 165–195
Mantle 88–490 60–415 55–350 85–450 65–420 63–365 302–2001 165–195 60–370
Each value represents the data calculated from six animals.
LIVER
0
100
200
300
400
500
123456789101112131415161718
Summer Winter Monsoon
SHELL
0
100
200
300
400
500
123456789101112131415161718
MANTLE
0
100
200
300
400
500
123456789101112131415161718
Summer Winter Monsoon
Summer Winter Monsoon
GILL
0
100
200
300
400
500
123456789101112131415161718
PONDS
PONDS
PONDS
PONDS
Gill Cd content (µg/g dw.)
Liver Cd content (µg/g dw.)
Shell Cd content (µg/g dw.)
Mantle Cd content (µg/g dw.)
Summer Winter Monsoon
Fig. 5. Cadmium accumulation in four different tissues of large group Lamellidens procured from 18 ponds in three different seasons.
Note the clear-cut variability of tissue cadmium in different seasons and investigated ponds.
182 S. Das, B.B. Jana / Chemosphere 55 (2004) 175–185
40–108 lg/g dw in root and 9–43 lg/g dw in leaves in the
remaining ponds (Fig. 6). Pond variability of tissue Cd
was as high as 65–81% for leaves and 74–85% for roots
of Eichhornia from the seven ponds.
Seasonal variability of tissue Cd showed higher val-
ues during summer winter and monsoon. Summer Cd
concentration (root––55–214 lg/g dw, and leaves––
11.75–63.8 lg/g dw) were 5–27% and 11–46% higher
than monsoon (29–168 lg/g dw in root, and 5–34 lg/g
dw in leaves) and winter (39–187 lg/g dw in root, and
5.9–48 lg/g dw in leaves).
6. Water quality
Water pH (6.0–6.5) and dissolved oxygen (3.5–4.8
mg/l) regardless of the seasons were significantly lower
in Mudiali (pond-1) and Captain Bheri (pond-2) ponds
than 16 ponds (pH––6.9–8.5; DO––7.5–11.5 mg/l).
There was no marked difference of total alkalinity and
total hardness among the 18 ponds investigated.
In general, pH was higher during monsoon (7.7–8.5)
followed by winter (6.5–7.6) and summer (6.0–6.8).
Values of DO were higher in winter (11.5–4.9 mg/l) and
lower in summer (7.6–3.5 mg/l). Total alkalinity (115–
175 mg/l) and total hardness (130–175 mg/l) were highest
in summer and lowest in monsoon (total alkalinity––
109–125 mg/l, total hardness––115–130 mg/l) (Table 2).
7. Discussion
Spatial Cd distribution in wetlands ponds depended
upon their degree of contamination. About 80–86 fold
increase in Cd concentration in two ponds situated in
the industrial belt of Calcutta (Captain Bheri and Mu-
diali farm) over remaining ponds outside the city
industrial complex may be due by the discharge of high
anthropogenic Cd through wastewater effluents.
As all ponds located outside the industrial belt show
Cd concentration within range of 0.006–0.049 mg/l, (the
permissible limit, Environmental Protection Agency––
US, 1986) it is suggested that these wetlands do not pose
serious environmental threat.
Wide range Cd variability among the ponds located
outside the city industrial complex with low Cd con-
centration (water––0.006–0.049 mg/l; sediment––7–35
lg/g dw) perhaps caused large variability of tissue Cd of
the test animal. This implied that the ambient Cd of
uncontaminated ponds remained far below the accu-
mulating potentials of test animal and, hence, are quite
useful as bio-filter. On the other side, less variability of
Cd at higher concentrations of Cd (0.458–0.7025 mg/l)
indicated that Lamellidens population occurring in these
habitats, were almost at the plateau, and might not be
considered suitable for bio-removal of Cd from the
environments.
As observed by other investigators of various lakes
(Stephenson and Mackie, 1988; Stephenson et al., 1996),
Cd concentration in sediment was significantly higher
than that in the water column in all water bodies. It has
been shown that Cd was rapidly lost from the water
column to suspended particles (Stephenson et al., 1996).
The loss may also be due to the presence of humic
substances and the organic content of the sediment
(Stephenson and Mackie, 1988; Pempkowiak and
Kozuch, 1994).
Cd tissue distribution in Lamellidens was in the
order: liver > gill > shell > mantle. This order was found
to be true, regardless of the size group, ponds and sea-
son. As hepatopancreas acts as a sink for metal ions
(Rajalekshmi and Mohandas, 1993), it is possible that it
bears the Cd load of the main body and thus shows the
highest Cd concentration among all tissues examined.
Similar results were reported by other investigators
(Merigomez, 1989; Merigomez and Ireland, 1989). Al-
though the ability to regulate the internal concentration
LEAVES
0
10
20
30
40
50
60
70
80
Mudiali C. Bhery P4 P6 P14 P16 P17
PONDS
PONDS
Cd content (µg/g dw.)
Cd content (µg/g dw.)
Summer Winter Monsoon
ROOT
0
50
100
150
200
250
300
Mudiali C. Bhery P4 P6 P14 P16 P17
Summer Winter Monsoon
Fig. 6. Cadmium accumulation in leaves and root of Eichhornia
in investigated ponds.
S. Das, B.B. Jana / Chemosphere 55 (2004) 175–185 183
of Cu and Zn over a wide range of dissolved concen-
trations have been demonstrated in intertidal shrimp
Palaemon elegans, the Cd concentration, on the other
hand, is not regulated resulting in body concentration of
metal directly proportional to external metal concen-
tration of the environment (White and Rainbow, 1986).
Cd uptake by Lamellidens gill was appreciably higher
than the uptake by the shell and mantle. Gill was the
primary site for Cd accumulation because of its rela-
tively large surface area and filtration activity (V-Balogh
and Salanki, 1984; Holwerda et al., 1989; Salanki and V-
Balogh, 1989; Everaarts, 1990). It was estimated that
about 90% of Cd uptake occurred through absorption
from solution, is facilitated by diffusion of CdCl
2
across
the gill or by complexation with a high molecular
weight-compound present on the gill surface (Carpene
and George, 1981). It was proposed that large surface
area and the gill mucous, which might act in ion ex-
change, contributed to high metal concentration found
in gill tissue (Brooks and Rumsby, 1967; Pringle et al.,
1968).
Relatively low Cd accumulation in mantle and shell
might be due to the shell acting as a safe storage matrix
for toxic contaminants resistant to soft tissue detoxifi-
cation mechanism (Walsh et al., 1995).
Computation of correlation coefficient between tissue
Cd and ambient Cd revealed no significant relationship
between the Cd content of different tissues of Lamelli-
dens and water hardness (r ¼À0:1721–0.0115, P > 0:05)
or total alkalinity (r ¼À0:024–0.026, P > 0:05) of
water. The Ca content of water was, however reported
to have an inverse relationship with tissue Cd (Bjerreg-
aard and Depledge, 1994; Jana and Das, 1997).
Though Eichhornia was known to be an important
bio-filter for the removal of metal in many experimental
studies (Nir et al., 1990; Xiang et al., 1994), their
occurrence in these wetlands did not exert any clear-cut
relationship either between tissue Cd of Lamellidens and
the ambient Cd concentration or between the tissue Cd
of Eichhornia and the latter. This is perhaps due to the
fact that the Eichhornia population was quantitatively
less exerting any substantial bio-filter effect on pond
wetlands.
Acknowledgements
This research was supported by a grant Department
of Environment and Forests, Government of India (to
B.B. Jana). Shamik Das is grateful to DoEn for pro-
viding him with a Junior Research Fellowship. AAS
calibration and Oyster Cd standards (National Research
Council of Canada) were provided by Professor M.A.
Alikhan of the Department of Biology of Laurentian
University at Sudbury, Ontario, Canada.
References
American Public Health Association, 1995. Standard Methods
of Water and Wastewater Analysis. American Public Health
Association, Washington, DC.
Anand, S.J.S., 1978. Determination of mercury, arsenic and
cadmium in fish by neutron activation. J. Radio. Anal.
Chem. 44, 101–107.
Badino, G., Gill, G., Nagel, K.O., Palin, L., Peyrot, A., 1991.
The uptake of some heavy metals by Unio elongatus
(Mollusca: Bivalvia): concentration effects and uptake
profile. Atti. della. Academia. della. Scienze. di. Torino.
25, 120–130.
Bjerregaard, P., Depledge, M.H., 1994. Cadmium accumulation
in Littorina littorea, Mytilus edulis and Carcinus maenas: the
influence of salinity and calcium concentrations. Mar. Biol.
11 (30), 385–395.
Borg, H., Andersson, P., Johanson, K., 1989. Influence of
acidification on metal fluxes in Swedish forest lakes. Sci.
Total Environ. 87/88, 241–253.
Boyden, C.R., 1977. Effect of size upon metal content of shell
fish. J. Mar. Biol. Asso. UK 57, 675–715.
Brooks, R.R., Rumsby, M.G., 1967. Studies on the uptake of
cadmium by the oyster, Ostrea sinuata (Lamark). Aus. J.
Mar. Freshwat. Res. 18, 53–61.
Carpene, E., George, S.G., 1981. Absorption of cadmium by
gils of Mytilus edulis (L). Mol. Physiol. 1, 23–24.
Das, S., Jana, B.B., 1999. Dose-Dependent uptake and Eich-
hornia-induced elimination of cadmium in various organs of
freshwater mussel, Lamellidens marginalis (Linn.). Ecol.
Engn. 12, 207–229.
Environment Canada and Health Canada, 1994. Canadian
Environmental Protection Act priority substances list
assessment report: cadmium and its compounds. Environ-
ment Canada and health Canada, Ottawa, Ontario.
Environmental Protection Agency––US, 1986. Guideline for
the healthrisk assessment of chemical mixtures. Fed. Reg.
51, pp. 34014–34025.
Everaarts, J.M., 1990. Uptake and release of cadmium in
various organs of the common mussle, Mytilus edulis (L.).
Bull. Environ. Contam. Toxicol. 45, 560–567.
Holwerda, D.A., De Knecht, J.A., Hemelraad, J., Veenhof,
P.R., 1989. Cadmium kinetics in freshwater clams. Uptake
of cadmium by the excised gill of Anodonta natina. Bull.
Environ. Cont. Toxicol. 42, 382–388.
Jana, B.B., Das, S., 1997. Potential of freshwater mussel
(Lamellidens marginalis) for cadmium clearance in a model
system. Ecol. Eng. 8 (3), 179–193.
Livingstone, D.R., 1991. Towards a specific index of impact by
organic pollution for marine invertebrates––mini review.
Com. Biochem. Physiol. 100, 151–155.
Majori, L., Negoclan, G., Modonutti, G.B., Daris, F., 1978.
Study of the seasonal variations of some trace elements in
the tissues of Mytilus galloprovincialis taken in the Gulf of
Trieste. Rev. Int. Ocean. Med. XLIX, 37–40.
Mathew, R., Menon, N.R., 1983. Oxygen consumption in
tropical bivalves Perna viridis (Linn.) and Meretrix casta
(chem.) exposed to heavy metals. Ind. J. Mar. Sci. 12, 57–59.
Merigomez, J.A., Ireland, M.P., 1989. Accumulation, distribu-
tion and loss of cadmium in the marine prosobranch,
Littorina lottorea (L.). Sci. Total Environ. 78, 1–12.
184 S. Das, B.B. Jana / Chemosphere 55 (2004) 175–185
Merigomez, J.A., 1989. Aportaciones cito-histologicas a la
evaluacion ecotoxicologica de niveles sublitales de cadmio
en el medio marino: estudios de laboratorio en el gastrop-
odo prosobranquio Littirina littorea (L.). PhD thesis,
University of the Basque Country, Spain.
Murphy, B.R., Atchison, G.J., McIntosh, A.W., 1978. Cad-
mium and zinc in muscle of blue gill (Lopomis macrochirus)
and large mouth bass (Micropterus salmoides) from an
industrially contaminated lake. Environ. Pollut. 17, 253–258.
Nir, R., Gasith, A., Perry, A.S., 1990. Cadmium uptake and
toxicity to waterhyacinth: effect of repeated exposures under
controlled conditions. Bull. Environ. Contam. Toxicol. 44
(1), 149–157.
Nriagu, J.O., Pacyna, J.M., 1988. Quantitative assessment of
world wide contamination of air, water and soils by trace
metals. Nature (London) 333, 134–139.
Pillai, K.C., 1983. Heavy metals in Aquatic environments. In:
Varshney, C.K. (Ed.), Water Pollution and Management.
Wiley Eastern Limited, New Delhi, pp. 74–93.
Pempkowiak, J., Kozuch, J., 1994. The influence of structural
features of marine humic substances on the accumulation
rates of cadmium by blue mussel, Mytilus edulis. In: Becher,
G., Gjessing, E.T. (Eds.), Humex Project and Humic
Substances 20 (3), 391–395, Special issue.
Penthreath, R.J., 1973. The accumulation from water of Zn65,
Mn54, Cu58 and Fe59 by the mussel, Mytilus edulis. J. Mar.
Biol. Asso. UK 53, 127–143.
Pringle, B.H., Hissong, D.H., Katz, E.L., Mulawka, S.T., 1968.
Trace metal accumulation by estuarine molluscs. J. San.
Eng. Div., Am. Soc. Civil Eng. 94, 455–475.
Rajalekshmi, P., Mohandas, A., 1993. Effect of heavy metals on
tissue glycogen levels in the freshwater mussel, Lamellidens
corrianus (Lea). Sci. Total Environ. (Supplement).
Roesijadi, G., Unger, M.E., 1993. Cadmium uptake in gills of
the molluscs Crassostrea virginica and inhibition by calcium
blockers. Aquat. Toxicol. 24, 195–206.
Roth, I., Hornung, H., 1977. Metal concentration in water,
sediments and fish of the mediterranean coastal area. Ishael.
Environ. Sci. Technol. 11, 265–269.
Salanki, J., V-Balogh, K., 1989. The application of combined
tissue residue chemistry and physiological measurement of
mussels (Mytilus edulis) for the assessment of environmental
pollution. Hydrobiologia 188/189, 455–461.
Short, J.W., Sharp, J.L., 1989. Tributyltin in bay mussels
(Mytilus edulis) of the pacific coast of the United States.
Environ. Sci. Technol. 23, 740–743.
Simkiss, K., 1983. Rapid solubility of heavy metals in saline
solutions. J. Mar. Biol. Assoc. UK 63, 1–7.
Stephenson, M., Mackie, G.L., 1988. Total cadmium concen-
trations in the water and littoral sediments of central
Ontario lakes. Water Air Soil Pollut. 38, 121–136.
Stephenson, M., Klaverkamp, J., Motycka, M., Baron, C.,
Schwartz, W., 1996. Coring artifacts and contaminant
inventories in lake sediment. J. Paleolimnol. 15, 99–106.
Taylor, D., 1983. The significance of the accumulation of
cadmium by aquatic organisms. Ecotoxicol. Environ. Safety
7, 33–42.
Taylor, R.M., Watson, G.D., Alikhan, M.A., 1995. Compar-
ative sublethal and lethal acute toxicity of copper to the
freshwater crayfish, Cambarus robustus (Cambaridae, Deca-
poda, Crustacea) from an acidic metal-contaminated lake
and a circumnentral uncontaminated stream. Water Res. 29,
401–408.
Trotman-Dickenson, A.F., 1973. Comprehensive Inorganic
Chemistry. Pergamon press.
V-Balogh, K., Salanki, J., 1984. The dynamics of mercury and
cadmium uptake into different organs of Anodonta cygnea
L. Water Res. 18, 1381–1387.
Walsh, K., Dunstan, R.H., Murdoch, R.N., Conroy, B.A.,
Roberts, T.K., Lake, P., 1994. Bioaccumulation of pollu-
tants and changes in population parameters in the gastro-
pod mollusc Austrocochlea constricta. Arch. Environ.
Contam. Toxicol. 26, 367–373.
Walsh, K., Dunstan, R.H., Murdoch, R.N., 1995. Differential
bioaccumulation of heavy metals and organopollutants in
the soft tissue and shell of the marine gastropod, Austroc-
ochlea constricta. Arch. Environ. Contam. Toxicol. 28, 35–
39.
Wang, Y., Evans, D.D., 1993. Influence of cadmium concen-
tration on cadmium uptake by the fresh water mussel,
Ellioptio complanata. Can. J. Fish Aquat. Sci. 50, 2591–
2596.
Weast, R.C., 1969–1970. In: Waste, R.C. (Ed.), Handbook of
Chemistry and Physics, 50th ed. Chemical Rubber Co.,
Cleveland, OH.
White, S.L., Rainbow, P.S., 1986. Accumulation of cadmium
by Palaemon elegans (Crustacea: Decapoda). Mar. Ecol.
Prog. Sen. 32, 17–25.
World Health Organisation, 1971. International Standards for
Drinking Water. WHO, Geneva.
Xiang, D., Jiang, J., Wang, Y., Ru, B., 1994. Bioconcentration
of cadmium in waterhyacinth (Eichhornia crassipes)in
relation to thiol group content. Environ. Pollut. 84, 93–
96.
Zaroogian, G.E., 1980. Crassostrea virginica as an indicator of
cadmium pollution. Mar. Biol. 58, 275–284.
S. Das, B.B. Jana / Chemosphere 55 (2004) 175–185 185