Báo cáo khoa học: Modeling of ATP–ADP steady-state exchange rate mediated by the adenine nucleotide translocase in isolated mitochondria potx
Bạn đang xem bản rút gọn của tài liệu. Xem và tải ngay bản đầy đủ của tài liệu tại đây (466.7 KB, 14 trang )
Modeling of ATP–ADP steady-state exchange rate
mediated by the adenine nucleotide translocase in
isolated mitochondria
Eugeniy Metelkin
1
, Oleg Demin
1,2
, Zsuzsanna Kova
´
cs
3
and Christos Chinopoulos
4
1 Institute for Systems Biology SPb, Moscow, Russia
2 A. N. Belozersky Institute of Physico-Chemical Biology, Moscow State University, Russia
3 Department of Pharmaceutical Chemistry, Semmelweis University, Budapest, Hungary
4 Department of Medical Biochemistry, Semmelweis University, Budapest, Hungary
Introduction
Adenine nucleotide translocase (ANT) catalyzes the
reversible exchange of ADP for ATP with a 1 : 1 stoi-
chiometry across the inner mitochondrial membrane.
In this study, we model the ADP–ATP exchange rate
during steady state mediated by ANT as a function of
mitochondrial membrane potential (DW
m
). Input data
were used from the recently published method exploit-
ing the differential affinity of ADP and ATP for Mg
2+
[1]. In this method, the rate of appearance of ATP in
the medium following addition of ADP to energized
mitochondria is calculated from the measured rate of
change in free extramitochondrial [Mg
2+
] revealed by
the membrane-impermeable 5K
+
salt of the Mg
2+
-
sensitive fluorescent indicator, magnesium green
(MgG), using standard binding equations. The assay is
designed such that ANT is the sole mediator of
changes in [Mg
2+
] in the extramitochondrial volume
as a result of ADP–ATP exchange.
Keywords
adenine nucleotide carrier; adenine
nucleotide translocator; ATP synthasome;
ATP ⁄ ADP carrier; systems biology
Correspondence
C. Chinopoulos, Department of Medical
Biochemistry, Semmelweis University,
Tuzolto st. 37–47, 1094, Budapest, Hungary
Fax: +361 2670031
Tel: +361 4591500 ext. 60024
E-mail:
(Received 3 June 2009, revised 20
September 2009, accepted 23 September
2009)
doi:10.1111/j.1742-4658.2009.07394.x
A computational model for the ATP–ADP steady-state exchange rate med-
iated by adenine nucleotide translocase (ANT) versus mitochondrial mem-
brane potential dependence in isolated rat liver mitochondria is presented.
The model represents the system of three ordinary differential equations,
and the basic components included are ANT, F
0
⁄ F
1
-ATPase, and the phos-
phate carrier. The model reproduces quantitatively the relationship between
mitochondrial membrane potential and the ATP–ADP steady-state
exchange rate mediated by the ANT operating in the forward mode, with
the assumption that the phosphate carrier functions under rapid equilib-
rium. Furthermore, the model can simulate the kinetics of experimentally
measured data on mitochondrial membrane potential titrated by an uncou-
pler. Verified predictions imply that the ADP influx rate is highly depen-
dent on the mitochondrial membrane potential, and in the 0–100 mV range
it is close to zero, owing to extremely low matrix ATP values. In addition
to providing theoretical values of free matrix ATP and ADP, the model
explains the diminished ADP–ATP exchange rate in the presence of nigeri-
cin, a condition in which there is hyperpolarization of the inner mitochon-
drial membrane at the expense of the mitochondrial DpH gradient; the
latter parameter influences matrix inorganic phosphate and ATP concentra-
tions in a manner also described.
Abbreviations
ANT, adenine nucleotide translocase; A
p
5A, diadenosine pentaphosphate; cATR, carboxyatractyloside; MgG, magnesium green; PMF,
protonmotive force; SEM, standard error of the mean; DW
m
, mitochondrial membrane potential.
6942 FEBS Journal 276 (2009) 6942–6955 ª 2009 The Authors Journal compilation ª 2009 FEBS
In this article, we present a kinetic model of mito-
chondrial phosphorylation, which consists of: (a) the
model of adenine nucleotide exchange across the mito-
chondrial membrane by Metelkin et al. [2]; (b) the
model of F
0
⁄ F
1
-ATPase developed previously by
Demin et al. [3], (c) the simple steady-state model of
the phosphate carrier; and (d) the empirical description
of membrane potential formation and ion leakage
across the inner mitochondrial membrane. The present
model is then validated using data obtained from
intact isolated rat liver mitochondria. In addition to
providing several predictions elaborated below, this
work serves as a complete ATP phosphorylation model
that could be incorporated in future versions of larger
and more complex models of mitochondrial functions,
such as those described recently [4,5].
Results and Discussion
Correlation of ATP–ADP steady-state exchange
rate mediated by ANT with DW
m
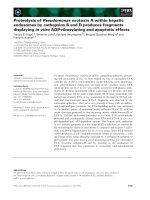
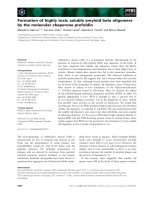
Data for Fig. 1 were obtained from the recently pub-
lished paper by Chinopoulos et al. [1]. Open circle
symbols represent the DW
m
values reached 20 s after
addition of ADP in the presence of increasing concen-
trations of SF 6847, as detailed in [1]. SF 6847 is a
protonophoric uncoupler that dissipates DW
m
in a
dose-dependent manner, by allowing re-entry of pro-
tons into the matrix, bypassing F
0
⁄ F
1
-ATPsynthase
[6]. The dotted line shows the result of the modeling
after estimation of the unknown parameters. The con-
ditions of the described set of experimental data
(namely the low concentration of ATP) prevent the
reverse functioning of ANT. In that case, the model
shows that the synthesis of ATP occurs at a potential
from )100 mV or higher. It is important to note that,
in this range, mitochondrial ATP production does not
saturate; this means that, within the physiological
range, ATP production is controlled by DW
m
. At mem-
brane potential values from 0 mV to )100 mV, the
rate of ATP production by mitochondria is close to
zero.
Calibration of the kinetic model of
phosphorylation in mitochondria
As mentioned in Experimental procedures, there are
two parameters of the kinetic model of phosphoryla-
tion in mitochondria whose values cannot be estimated
on the basis of in vitro data obtained with purified
enzymes. These are: (a) the value characterized by the
activity of ATP synthase (c
SYN
); and (b) the value
characterized by the amount of ANT (c
ANT
) for a
given tissue. These parameters characterize a particular
suspension of mitochondria (type of animal, organ,
experimental procedure), and require experimental
data obtained with this mitochondrial suspension to be
identified. To estimate these two parameters, we have
fitted our model described above against the depen-
dence of the ATP–ADP steady-state exchange rate
mediated by ANT on DW
m
(Fig. 1, open cicles) and
the dependence of these rates on carboxyatractyloside
(cATR), a noncompetitive blocker of ANT [7] (Fig. 2,
filled circles), measured on a suspension of mitochon-
dria respiring on glutamate and malate. Values of c
SYN
and c
ANT
have been chosen (Table 1) in such a way as
to provide minimal deviation between experimental
data (circles) and the model-generated curve. As a
criterion of fitness, the following function was used:
fk
j
; K
j
ÀÁ
¼
X
n
i
v
i
À
~
v
i
v
i
2
ð1Þ
Here, n is the total number of the experimental
points,
~
v
i
is the experimentally measured value of the
ATP–ADP steady-state exchange rate mediated by
ANT, and v
i
is the value of the ATP–ADP steady-state
exchange rate mediated by ANT calculated on the
model at a point corresponding to the experimental
one. To estimate values of unknown parameters, the
relative error of the model (
ffiffiffiffiffiffiffiffi
f
=
n
p
) has been minimized.
This procedure was performed in the dbsolve 7 pack-
age [8,9] using the Hooke–Jeeves method [10].
Fig. 1. Correlation of ATP–ADP steady-state exchange rate medi-
ated by ANT with DW
m
. Plot of ATP–ADP exchange rate mediated
by ANT versus DW
m
in liver mitochondria depolarized to various
voltages by different amounts of SF 6847, constructed from the
data as described in [1]. The dashed line represents the result of
the model described in the text.
E. Metelkin et al. Modeling of ANT
FEBS Journal 276 (2009) 6942–6955 ª 2009 The Authors Journal compilation ª 2009 FEBS 6943
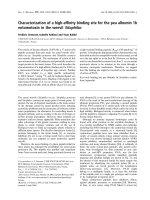
Nigericin decreases the ATP–ADP steady-state
exchange rate mediated by ANT
Nigericin is an ionophore that mediates the electrically
neutral exchange of potassium ions for protons, elimi-
nating the pH gradient across the mitochondrial mem-
brane and causing a compensatory increase in DW
m
[11,12]. As seen in Fig. 3, nigericin (10 lm) decreased
the ATP–ADP steady-state exchange rate mediated by
ANT significantly, even though it hyperpolarized mito-
chondria by 15 mV. This is also predicted by the
model. We have explained this finding in terms of a
decrease in P
i
flux through the inner mitochondrial
membrane, due to the collapse of DpH caused by nige-
ricin. This means that a decrease in [P
i
], in turn reduc-
ing ATP synthase activity, contributes more to the
steady-state phosphorylation rate than the increase of
electric potential and corresponding increase in ATP–
ADP steady-state exchange rate mediated by the ANT.
As also seen in Fig. 3, the calculated values of the pro-
tonmotive force (PMF) in the presence of nigericin are
higher than those in the absence of the ionophore. The
calibration of the safranine O fluorescence signal may
be unreliable in the very highly polarized range,
greater than )170 mV [13]; attempts to produce higher
membrane potentials (such as by addition of nigericin
to fully charged mitochondria) result in deviations
from a straight line. This is presumably due to the fact
that estimated extramitochondrial K
+
is considered as
added K
+
. Thus, DW
m
will be overestimated at the
point where the concentration of added K
+
approaches that of K
+
that has leaked out from the
mitochondria.
Predictions of the kinetic model of
phosphorylation in mitochondria: matrix ATP and
ADP values and the dependence of P
i
on DpH
On the basis of the model developed above and veri-
fied against experimental data measured on isolated
mitochondria, we have calculated the dependence of
matrix concentrations of ADP and ATP as a function
of electrical potential difference across the inner mito-
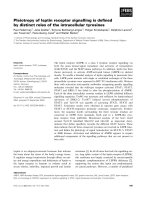
chondrial membrane. As shown in Fig. 4A, predictions
of our model correspond to the experimentally mea-
sured (open circles) dependence of O
2
consumption
(V
O2
in the model) on electric potential difference
(DW
m
). Moreover, our model predicts that concentra-
tions of ADP and ATP (Fig. 4B) at state 3 (DW
m
is
about )145 mV) are equal to 8.7 mm and 3.3 mm,
respectively, and transition from state 3 to state 4
(DW
m
is about )170 mV) reverses the order of the con-
centrations to 2.2 mm for ADP and 9.8 mm for ATP.
In order to compare these predicted values with experi-
mental data, we measured matrix ATP and ADP
concentrations from mitochondrial matrix extracts by
HPLC. Representative traces of HPLC raw data
(absorbance at 260 nm versus retention time) are
shown in Fig. 4C. AMP, ADP and ATP have been
resolved on the basis of different retention times
through the HPLC column, identified and calibrated
by ‘spiking’ the samples with known amounts of
AMP, ADP, and ATP, individually. Assuming 1 lLof
matrix volume for every milligram of mitochondrial
protein, we estimated the following values. At 0 mV
(no substrates, in the presence of 1 lm SF 6847), rat
liver mitochondria have 3.64 ± 0.34 mm AMP,
8.23 ± 0.65 mm ADP, and 0.51 ± 0.05 mm ATP.
At )170 mV (mitochondria energized with 5 mm
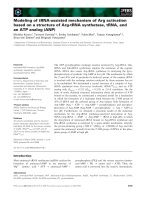
Fig. 2. Titration of ATP–ADP steady-state exchange rate mediated
by ANT with cATR and correlation with DW
m
. (A) ATP–ADP steady-
state exchange rate mediated by ANT determined as a function of
cATR concentration. Dashed line: simulation fit as described in the
text. Inset: a representative experiment showing the calculated
[ATP] appearing in the extramitochondrial medium after addition of
ADP, in the presence of cATR (in the concentrations indicated in
the inset figure, in n
M). (B) Delta phi represents the difference in
DW
m
before and after addition of 1 mM ADP to liver mitochondria
pretreated with cATR in the same concentration range as in (A).
Inset: a representative experiment showing the effect of the addi-
tion of cATR (in the concentrations indicated in the inset figure, in
n
M)onDW
m
, as indicated in the inset of (B). Data in (A) and (B) are
shown as SEM from four independent experiments.
Modeling of ANT E. Metelkin et al.
6944 FEBS Journal 276 (2009) 6942–6955 ª 2009 The Authors Journal compilation ª 2009 FEBS
Table 1. The parameters of the model.
Parameter Value Comment Source
pH
o
7.25 pH in experimental volume Measured or given value
pH
i
7.30 pH in matrix under phosphorylating
conditions
[Mg
2+
]
o
t
1mM Total Mg
2+
concentration in experimental
volume
V
o
2 mL Experimental volume
[P
i
]
o
t
10 mM Total inorganic phosphate concentration in
experimental volume
T
t
o
; D
t
o
Dependent on
experimental conditions
Concentration of adenine nucleotides
(ATP, ADP) in experimental volume
[Mg
2+
]
i
0.35 mM Buffered Mg
2+
concentration in the matrix [57]
A
t
i
¼ T
t
i
þ D
t
i
12 mM Total concentration of adenylates
(ATP + ADP) in the matrix (may vary
considerably in the range 2.7–22 m
M;
see [58]).
[58–62]
K
P,H
6.31 · 10
)5
mM Dissociation constant for H
+
and
phosphate
Calculated from pK
a
= 7.2 [63]
K
T,Mg
0.114 mM Dissociation constant for Mg
2+
and ATP [1]
K
D,Mg
0.906 mM Dissociation constant for Mg
2+
and ADP
K
SYN
hyd
2.23 · 10
8
mM Equilibrium constant of ATP hydrolysis Calculated from DG
0
¢ = )30.5
kJÆmol
)1
[64]
c
ANT
4.8 · 10
1
nmolÆmg
)1
Effective coefficient (characterizes the
amount of ANT dimer per mg of total
mitochondrial protein)
Estimated on the basis of fitting
of the model against our data
k
ANT;0
2
10.8 min
)1
Constant of direct ANT exchange [2]
k
ANT;0
3
21.0 min
)1
Constant of reverse ANT exchange
K
ANT;0
T
o
0.057 mM Dissociation constant of ATP and ANT
K
ANT;0
D
o
0.051 mM Dissociation constant of ADP and ANT
a
1
0.268 Parameters of ANT electrostatic profile
a
2
)0.205
a
3
0.187
d
T
0.070
d
D
0.005
c
SYN
22 Correction factor characterizing activity of
ATP synthase in a particular
mitochondrial preparation
Estimated on the basis of fitting
of the model against our data
n
SYN
3H
+
⁄ ATP ratio [65]
v 0.9 Parameters of H
+
-ATP synthase
electrostatic profile
[3]
v
n
0.1
V
SYN
max
1.2 · 10
)4
nmol
(minÆmg)
)1
Parameters of H
+
-ATP synthase model
K
SYN
H
o
3 · 10
)5
mM
K
SYN
Hi
1 · 10
)6
mM
K
SYN
MgD
5.56 · 10
)3
mM
K
SYN
P 1
3.55 · 10
)1
mM
K
SYN
MgT
9.26 · 10
)1
mM
F 9.64 · 10
4
CÆmol
)1
Faraday constant
R 8.31 JÆmol
)1
ÆK
)1
Universal gas constant
T 310 K Temperature Measured
C
m
7.8 · 10
)6
FÆmg
)1
Capacitance of inner mitochondrial
membrane
[66]
k
O
2
250 nmol (minÆmg)
)1
The empirical coefficients of
membrane potential generation
Fitted to experimental data
K
O
2
1.45 · 10
)12
b
O
2
0.36
k
leak
0.438 nmol (minÆmg)
)1
The empirical coefficients of
membrane leakage descriptionb
leak
1.05
E. Metelkin et al. Modeling of ANT
FEBS Journal 276 (2009) 6942–6955 ª 2009 The Authors Journal compilation ª 2009 FEBS 6945
glutamate + 5 mm malate), rat liver mitochondria
have 2.57 ± 0.67 mm AMP, 2.98 ± 0.41 mm ADP (pre-
dicted 2.2 mm), and 7.11 ± 1.55 mm ATP (predicted
9.8 mm). Concerning measuring matrix ATP and ADP
values during state 3, this requires addition of ADP to
the mitochondrial suspension, followed by conversion
of ATP. This creates a technical challenge, because the
matrix volume is 2000 times smaller than the experi-
mental volume, and therefore matrix adenylate concen-
trations are many-fold lower than that in the
extramitochondrial compartment. Such obstacles have
been addressed by centrifuging mitochondria while
phosphorylating through lipid layers, thus excluding as
much as possible the water-soluble extramitochondrially
located nucleotides, with or without accounting for
nucleotides residing in the intermembrane space that
would be carried along the lipid layer (e.g. silicon oil).
For isolated rat liver mitochondria and using experi-
mental procedures similar – if not identical – to ours,
other investigators report a wide range of matrix
ATP ⁄ ADP ratios during state 3, ranging from 0.01 to
4.5 [14–25] or even in the 8–12 range [26,27]. For mito-
chondria in situ or in vivo, most investigators agree
with the 1–3 ratio range [28–30]. Those investigators
who do not pass isolated mitochondria through sili-
cone oil or do not make corrections for intermembrane
space adenine nucleotide retention report matrix
ATP ⁄ ADP ratios towards the higher values (3–4.5, e.g.
AC
BD
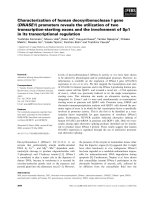
Fig. 4. Steady-state simulations of main characteristics of mitochondria using the model described in the text. (A, B) Experimental conditions
described in [1] have been simulated by assigning the following values to model parameters: [ATP]
out
=0mM,[P
i
]
out
=10mM,pH
out
= 7.25,
pH
in
= 7.35, [Mg
2+
]
in
= 0.35 mM, [Mg
2+
]
out
total
=1mM. State 3 corresponds to addition of ADP to the experimental volume
([ADP]
out
=1mM). State 4 corresponds to addition of cATR at high concentration (full inhibition of ANT). The uncoupling by SF 6847 (left part
of the curves) corresponds to an increase in the parameter k
leak
in the model. (A) Dependence of membrane potential generation rate in
terms of O
2
consumption rate. (B) Model-predicted dependence of steady-state concentrations of matrix ADP and ATP on electrical potential
differences in the )85 mV to 170 mV DW
m
interval. (C) Representative traces of HPLC raw data (from n = 4) for the following metabolic con-
ditions: Black line: mitochondria probed without substrates, in the presence of 1 l
M SF 6847. Gray line: mitochondria energized with 5 mM
glutamate and 5 mM malate. (D) Model-predicted dependence of matrix phosphate concentration on the difference in pH between the matrix
and extramitochondrial space at the following values of model parameters: [ADP]
out
=1mM, [ATP]
out
=0mM,[P
i
]
out
=10mM,pH
out
= 7.25.
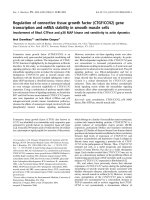
Fig. 3. Effect of nigericin on ATP–ADP steady-state exchange rate
mediated by ANT. Bar graph of ATP–ADP steady-state exchange
rate mediated by ANT in the absence (white bar) and presence
(gray bar) of 10 l
M nigericin. PMF shown in the bars was calcu-
lated as follows: PMF = DW
m
) 60DpH (at 37 °C). Data are shown
as SEM from four independent experiments.
Modeling of ANT E. Metelkin et al.
6946 FEBS Journal 276 (2009) 6942–6955 ª 2009 The Authors Journal compilation ª 2009 FEBS
[31]). Also, it is possible that results obtained after sep-
aration of intramitochondrial and extramitochondrial
compartments are not relevant, because of the time
used for the separation process and possible intercon-
version of adenine nucleotides even in the presence of
inhibitors [22–24,32]. Furthermore, a great proportion
of the matrix adenine nucleotides is bound to proteins
[33], a notion supported by the fact that rat liver mito-
chondria retain more than 50% of their total adenine
nucleotide content after permeabilization by toluene
[34]. Because of this potential binding of adenine
nucleotides to intramitochondrial proteins [35–38], the
relationship between the measured total ATP ⁄ ADP
ratio and free intramitochondrial ATP ⁄ ADP ratio is
difficult to predict. Previous data of Vignais show that
a large fraction (75–80%) of the ATP produced by
phosphorylation of added ADP within the inner mito-
chondrial membrane is released into the matrix space
before being transported out from the mitochondria;
only a small part (20–25%) is released directly outside
the mitochondria without penetrating the matrix space
[17]. It is therefore inferred that there are separate
intramitochondrial pools of adenine nucleotides, one
near the ANT and the ATPase, and another located in
the bulk of the matrix. The notion of matrix micro-
compartmentation of adenine nucleotides emanated
from several laboratories [17,39–42], but is not
accepted unequivocally by several investigators in the
field [23,43,44]. Furthermore, microcompartmentation
implies the existence of an ATP ‘synthasome’, (AT-
Pase ⁄ P
i
transporter ⁄ ANT in 1 : 1 : 1 ratio), and this is
at odds with an estimated ANT ⁄ P
i
transporter ratio of
4; for a detailed assessment on this matter, the reader
is referred to a recent review by Klingenberg [45]. The
ability of our model to calculate concentrations of
intramitochondrial nucleotides on the basis of DW
m
value and values of extramitochondrial ADP and ATP
makes it possible to use the model as a toolkit for the
study of responses of the intramitochondrial character-
istics to external influences [46]. Furthermore, one
more prediction that we have derived on the basis of
the model is the dependence of the intramitochondrial
concentration of P
i
on DpH. As shown in Fig. 4D, the
concentration of matrix P
i
can be increased substan-
tially, owing to an increase in DpH.
Predictions of the direct-reverse profile of
ADP–ATP exchange by ANT as a function of DW
m
Mitochondria with nonfunctional respiratory chains
become ATP consumers, maintaining an appreciable
PMF by pumping protons out of the matrix through
the F
0
⁄ F
1
-ATPase, at the expense of ATP hydrolysis.
Under these conditions, ANT reverses, bringing ATP
into the matrix in exchange for ADP, driven by a
DW
m
less negative than approximately )100 mV [2].
The directionality of ANT is thermodynamically gov-
erned by the concentrations of free nucleotides (ATP
4)
and ADP
3)
) across the inner mitochondrial membrane,
according to Eqn (11).
The concentrations of free ATP
4)
and ADP
3)
can
be estimated as follows:
L ¼ L
t
0
1 þ
Mg
2þ
K
M;app
0
1 þ
H
þ
K
H
ð2Þ
Here, L denotes ATP
4)
, L
t
denotes the total mea-
sured ATP concentration (i.e. ATP
4)
+ ATP-
H
3)
+ ATP-Mg
2)
+ ATP-H-Mg
)
), and Mg
2+
is free
magnesium. K
H
is the dissociation constant for the
reaction ATP-H
3)
M ATP
4)
+H
+
, and K
M,app
is the
apparent dissociation constant of MgATP that we
have measured at pH 7.25 and T =37°C. Similarly,
the concentration of free ADP
3)
can also be obtained
using Eqn (2), where L is ADP
3)
, L
t
is total ADP con-
centration (i.e. ADP
3)
+ ADP-H
2)
+ ADP-
Mg
)
+ ADP-H-Mg), and K
M,app
is the apparent dis-
sociation constant of MgADP that we have measured
at pH 7.25 and T =37°C. However, the values for
K
H
and K
M,app
might be hard to determine for the
conditions found inside the matrix. On the basis of the
kinetic model, we can estimate the steady-state direc-
tionality of ANT on the basis of any given values of
[ATP]
o
, [ADP]
o
, and DW
m
(Fig. 5A). With regard to
this, it would be useful to construct an experimentally
derived DW
m
versus ADP–ATP exchange rate profile
for the 0–100 mV range; however, it is difficult to
establish the relationship of DW
m
to ATP consumption
rates, because upon exceeding the reversal potential of
ANT (indicated by a dotted line in Fig. 5B), DW
m
is
not clamped at relatively steady states (Fig. 5B, gray
curves).
Kinetic behavior of the model resulting from
consecutive addition of uncoupler and ADP
DW
m
has been shown to fluctuate as a function of time
[47–50]; therefore, we sought to formulate our model
in order for it to be capable of simulating the time-
dependent response of mitochondria to different DW
m
values. Titration of DW
m
to different values was
achieved with different doses of SF 6847 and ADP. To
test the applicability of our model for describing the
time response, we calculated the time dependencies of
electrical potential differences resulting from consecu-
E. Metelkin et al. Modeling of ANT
FEBS Journal 276 (2009) 6942–6955 ª 2009 The Authors Journal compilation ª 2009 FEBS 6947
tive addition of uncoupler and ADP to mitochondria
in state 2, and compared the results of the calculation
with the experimental data presented in [1]. As shown
in Fig. 6A, the model-calculated dependence of DW
m
on time corresponds with experimental data (open
symbols). The period of time from 0 s to 70 s corre-
sponds to state 2 of mitochondria ([ADP]
out
=0mm).
Different concentrations of uncoupler [Fig. 6A; 30 nm
(a), 40 nm (b), 50 nm (c), or 60 nm (d)] were added
where indicated. ADP (2 mm) was added after SF
6847, where indicated. As shown in Fig. 6A, the model
simulates the steady-state membrane potential suffi-
ciently well, without any fittings of parameters. There
is only a slight difference in kinetics upon uncoupler
addition at high doses.
To predict the response of mitochondria at state 2
to consecutive addition of uncoupler and ADP, we
calculated the time response of ATP efflux (Fig. 6B),
O
2
consumption rate (Fig. 6C), and total matrix ADP
concentration (Fig. 6D). Time response kinetics of
DW
m
, ATP efflux rate, O
2
consumption rate and ADP
in the matrix resulting from the uncoupler or ADP
addition depicted in Fig. 6 can be characterized by
two features: transition time from one steady state to
another, and levels of the steady states. The differ-
ences between steady state before and after uncou-
pler ⁄ ADP addition may be characterized by their
amplitude. As shown in Fig. 6, the transition time
from one steady state to another for all characteristics
is less than 10 s.
As shown in Fig. 6A,C,D, the amplitude of time
response of electrical potential difference, O
2
consump-
tion rate and total matrix ADP concentration increases
with elevation of uncoupler concentration. In contrast,
the amplitudes of time responses of DW
m
(Fig. 6A),
V
O2
(Fig. 6C), ATP efflux rate (Fig. 6B) and matrix
ADP (Fig. 6D) after ADP (2 mm) addition gradually
decrease with increase in the uncoupler concentration.
Experimental procedures
Isolation of mitochondria from rat liver
Mitochondria from rat liver were isolated as detailed previ-
ously [51], with minor modifications. All animal procedures
were performed according to the guidelines of the local ani-
mal care and use committee (Egyetemi Allatkiserleti Bizott-
sag). Briefly, rats were killed, and livers were rapidly
removed, chopped, washed extensively, and homogenized
using a Teflon–glass homogenizer in ice-cold isolation buf-
fer containing 225 mm mannitol, 75 mm sucrose, 5 mm
Hepes, 1 mm EGTA, and 1 mgÆmL
)1
BSA (fatty acid-free),
with the pH adjusted to 7.4 with Tris. The homogenates
were centrifuged at 1250 g for 3 min; the pellet was dis-
carded, and the supernatant was centrifuged at 12 000 g for
10 min; this step was repeated once. At the end of the
A
B
Fig. 5. Forward–reverse profile of ATP ⁄ ADP transport and effect of
bioenergetic inhibition on DW
m
. (A) Diagram of directionality of
nucleotide transport in mitochondria. Each point of the curve corre-
sponds to the values of [ADP]
out
⁄ [ATP]
out
and DW
m
providing ‘zero’
steady-state flux of adenine nucleotides. The areas above and
below the curve correspond to the values of [ADP]
out
⁄ [ATP]
out
and
DW
m
defining direct and reverse transport of ATP–ADP exchange,
respectively. (B) Reconstructed time course of DW
m
, calculated
from safranine O fluorescence. One milligram of liver mitochondria
was added to 2 mL of medium and energized by glutamate and
malate. ADP (1 m
M) was added where indicated, causing a
$ 25 mV depolarization. Upon consumption of ADP, DW
m
returns
to a level approximating baseline. Increasing concentrations of SF
6847 (10, 20 and 30 n
M for the lower three black lines, from bot-
tom to top, and 50, 60 and 70 n
M for the upper three gray lines,
from bottom to top) were subsequently administered where indi-
cated. The dotted line represents the reversal potential of ANT.
Modeling of ANT E. Metelkin et al.
6948 FEBS Journal 276 (2009) 6942–6955 ª 2009 The Authors Journal compilation ª 2009 FEBS
second centrifugation, the supernatant was discarded, and
the pellet was suspended in 500 lL of the same buffer with-
out EGTA. The mitochondrial protein concentration was
determined using the Biuret assay.
[Mg
2+
]
f
determination from MgG fluorescence
in the extramitochondrial volume of isolated
mitochondria and conversion to ADP–ATP
exchange rate
Mitochondria (1 mg, wet weight; in this and all subsequent
experiments, wet weight of mitochondrial amount is
implied) were added to 2 mL of an incubation medium con-
taining 8 mm KCl, 110 mm potassium gluconate, 10 mm
NaCl, 10 mm Hepes, 10 mm KH
2
PO
4
, 0.005 mm EGTA,
10 mm mannitol, 1 mm MgCl
2
,5mm glutamate, 5 mm
malate, 0.5 mgÆmL
)1
BSA (fatty acid-free) (pH 7.25), 50 lm
diadenosine pentaphosphate (A
p
5A), and 2 lm MgG 5K
+
salt. Including the adenylate kinase inhibitor A
p
5A in the
medium is essential; Mg
2+
, which is present in the assay
medium, activates adenylate kinase. A
p
5A is a potent inhibi-
tor of adenylate kinase [52]. MgG fluorescence was recorded
in a PTI Deltascan fluorescence spectrophotometer at a
5 Hz acquisition rate, using 506 nm and 530 nm excitation
and emission wavelengths, respectively. MgG exhibits an
extremely high quantum yield (E
M
[MgG] = 75 000-
m
)1
Æcm
)1
); therefore, slits were opened to widths of no more
than 1 nm. Experiments were performed at 37 ° C. At the
end of each experiment, minimum fluorescence (F
min
) was
measured after addition of 4 mm EDTA, and this was fol-
lowed by the recording of maximum fluorescence (F
max
) elic-
ited by addition of 20 mm MgCl
2
. Free Mg
2+
concentration
([Mg
2+
]
f
) was calculated from the equation
[Mg
2+
]
f
=[K
d
(F – F
min
) ⁄ (F
max
) F)] ) 0.055 mm, assuming
a K
d
of 0.9 mm for the MgG–Mg
2+
complex [53]. The cor-
rection term )0.055 mm is empirical, and possibly reflects
chelation by EDTA of other ions that have an affinity for
MgG, and alter its fluorescence. This term was needed to
obtain a reliable [Mg
2+
] estimate, as determined from cali-
bration experiments using solutions with known, stepwise
increasing, Mg
2+
concentrations. ADP–ATP exchange rate
was estimated using the recently described method by our
laboratory [1], exploiting the differential affinity of ADP
and ATP for Mg
2+
. The rate of ATP appearing in the med-
ium following addition of ADP to energized mitochondria
(or vice versa in the case of de-energized mitochondria) is
calculated from the measured rate of change in free extrami-
tochondrial [Mg
2+
] using standard binding equations. The
assay is designed such that ANT is the sole mediator of
changes in [Mg
2+
] in the extramitochondrial volume, as a
result of ADP–ATP exchange [1]. For the calculation of
[ATP] or [ADP] from free [Mg
2+
], the apparent K
d
values
are identical to those in [1], owing to identical experimental
conditions (K
ADP
= 0.906 ± 0.023 mm, and K
ATP
=
0.114 ± 0.005 mm).
A
B
C
D
Fig. 6. The kinetics of the main characteristics of mitochondria. (A)
Plot of electrical membrane potential versus time. Solid black lines
indicate the kinetics of mitochondrial membrane potential. Open
symbols indicate the calibrated DW
m
data obtained from panel 6C of
[1]. (B) Plot of ATP efflux rate versus time. (C) Time dependence of
O
2
consumption rate. (D) The kinetics of total matrix ADP concen-
tration. The model parameters have been chosen in such a way as
to simulate the experimental data presented in Fig. 1 for different
doses of uncoupler. The experimental conditions described in [1]
have been simulated by assigning the following values to model
parameters: [ATP]
out
=0mM,[P
i
]
out
=10mM,pH
out
= 7.25,
pH
in
= 7.35, [Mg
2+
]
in
= 0.35 mM, [Mg
2+
]
out
total
=1mM. The initial
period (0–70 s) describes a steady state corresponding to state 2 of
mitochondria ([ADP]
out
=0mM). After 70 s, different doses of the
uncoupler SP 6847 were added. At time 90 s, the ADP was added
to the experimental volume. Letters a, b, c, d correspond to differ-
ent uncoupler doses: 30 n
M (a), 40 nM (b), 50 nM (c), or 60 nM (d).
E. Metelkin et al. Modeling of ANT
FEBS Journal 276 (2009) 6942–6955 ª 2009 The Authors Journal compilation ª 2009 FEBS 6949
DW
m
determination in isolated mitochondria
DW
m
was estimated using fluorescence quenching of the cat-
ionic dye safranine O due to its accumulation inside ener-
gized mitochondria [13]. Mitochondria (1 mg) were added
to 2 mL of an incubation medium containing 8 mm KCl,
110 mm potassium gluconate, 10 mm NaCl, 10 mm Hepes,
10 mm KH
2
PO
4
, 0.005 mm EGTA, 10 mm mannitol, 1 mm
MgCl
2
,5mm glutamate, 5 mm malate, 0.5 mgÆmL
)1
BSA
(fatty acid-free) (pH 7.25), 50 lm A
p
5A, and 5 lm safranine
O. All of the experiments were performed in the presence
of cyclosporin A. Parallel experiments in the absence of this
compound verified that it did not interfere with the out-
come. Fluorescence was recorded in a Hitachi F-4500 spec-
trofluorimeter (Hitachi High Technologies, Maidenhead,
UK) at a 2 Hz acquisition rate, using 495 nm and 585 nm
excitation and emission wavelengths, respectively. Experi-
ments were performed at 37 °C. To convert safranine O flu-
orescence into millivolts, a voltage–fluorescence calibration
curve was constructed. To this end, safranine O fluores-
cence was recorded in the presence of 2 nm valinomycin
and with stepwise increases in [K
+
] (in the 0.2–120 mm
range), which allowed calculation of DW
m
by the Nernst
equation, assuming a matrix [K
+
] of 120 mm [13].
Mitochondrial oxygen consumption
Mitochondrial respiration was recorded at 37 °C with a
Clark-type oxygen electrode (Hansatech, King’s Lynn,
UK). Mitochondria (1 mg) were added to 2 mL of an incu-
bation medium containing 8 mm KCl, 110 mm potassium
gluconate, 10 mm NaCl, 10 mm Hepes, 10 mm KH
2
PO
4
,
0.005 mm EGTA, 10 mm mannitol, 1 mm MgCl
2
,5mm
glutamate, 5 mm malate, 0.5 mgÆmL
)1
BSA (fatty acid-free)
(pH 7.25), and 50 lm A
p
5A. State 3 respiration was initi-
ated by the addition of 1 mm K-ADP to the incubation
medium. State 4 respiration was initiated by the addition of
cATR at the indicated concentrations.
Determination of matrix adenine nucleotides by
HPLC
Rat liver mitochondria (0.25 mL of 65 mgÆmL
)1
) were
added to 1 mL of buffer with 5 mm glutamate and 5 mm
malate or without substrates (but in the presence of 1 lm
SF 6847) containing 8 mm KCl, 110 mm potassium gluco-
nate, 10 mm NaCl, 10 mm Hepes, 10 mm KH
2
PO
4
,
0.005 mm EGTA, 10 mm mannitol, 1 mm MgCl
2
,
0.5 mgÆmL
)1
BSA (fatty acid-free) (pH 7.25), 1 lm cyclo-
sporin A (to inhibit opening of the permeability transition
pore, which could lead to loss of matrix adenylate nucleo-
tide pools [54]) and 50 lm A
p
5A for 3 min. Subsequently,
1 mL of this mixture was added to 1 mL of ice-cold per-
chloric acid (3 m), and allowed to deproteinize at 0 °C for
5 min. After this, 2 mL of 1.5 m KOH and 0.5 m Tris was
added, and the precipitate was allowed to form at 0 °C for
another 5 min. Then, 0.8 mL of the supernatant was spun
at 25 000 g for 3 min at 4 °C, and 0.6 mL was collected,
adjusted to pH 6.5–6.7 with perchloric acid or KOH and
Tris, and respun at 25 000 g for 3 min at 4 °C to remove
any remaining precipitate. Supernatants were immediately
frozen with liquid nitrogen, and were kept at )70 °C for
further use. The chromatographic separation of adenine nu-
cleotides (AMP, ADP, and ATP) was performed with a
C18 reversed-phase column (ODS Hypersyl; 250 · 4.6 mm
internal diameter; particle size 5 lm). The mobile phase
was composed of 215 mm sodium dihydrogen phosphate,
2.3 mm tetrabutyammonium hydroxide, 4% acetonitrile,
and 0.4% potassium hydroxide, and the flow rate was
1mLÆmin
)1
. The sample injection volume was 20 lL, and
during isocratic acquisition the components were monitored
at 260 nm with a multiwavelength Jasco Pu-2075 Plus Intel-
ligent UV detector connected to a Jasco Pu-2089 Quater-
nary Gradient pump and Rheodyne sample injector (Jasco,
Gross-Umstadt, Germany). Calibration of the signals was
performed by ‘spiking’ the samples with known amounts of
AMP, ADP and ATP in a relevant range of concentrations.
Kinetic model of phosphorylation in
mitochondria
The kinetic model of the phosphorylation subsystem of
mitochondrial oxidative phosphorylation includes a quanti-
tative description of the following processes: (a) ATP syn-
thesis, catalyzed by ATPase ⁄ ATP synthase (V
SYN
); (b)
electrogenic translocation of adenine nucleotides, catalyzed
by the adenine nucleotide translocase (V
ANT
); (c) electro-
neutral symport of P
i
and a proton, as catalyzed by the
phosphate carrier; (d) electrogenic transport of protons
from the matrix to the intermembrane space by the electron
transport chain (complexes I–IV) with generation of mem-
brane potential (V
O
2
); and (e) leakage of K
+
,H
+
and
other ions across the mitochondrial inner membrane
(V
leak
).
The transport and synthesis of adenylates can be repre-
sented by system of algebra-differential equations:
d
dt
D
t
i
¼ÀV
SYN
þ V
ANT
;
T
t
i
þ D
t
i
¼ A
t
i
:
&
ð3aÞ
Here, T
i
t
and D
i
t
stand for concentrations of total ATP
and ADP in the mitochondrial matrix. Additionally, it is
necessary to take into account the ionic balance in the sys-
tem. The total ionic current can be represented as follows:
I ¼ F Á 20 Á V
O
2
À V
leak
À 3 Á V
SYN
À V
ANT
where I stands for total current (positive and negative) of ions
transported across the inner membrane of mitochondria.
Modeling of ANT E. Metelkin et al.
6950 FEBS Journal 276 (2009) 6942–6955 ª 2009 The Authors Journal compilation ª 2009 FEBS
The positive current direction is from the matrix to the intra-
membrane space. The integer coefficients of the right-hand
side of the second equation of the system (3) were chosen on
the basis of the knowledge of number of charges transferred
or leaked across the inner mitochondrial membrane: (a) the
electron transport chain transports 20 protons per O
2
; (b)
F
0
⁄ F
1
-ATPase transports three protons per one molecule of
ATP synthesized; and (c) one cycle of transport by ANT
leads to transport of one additional charge.
The ionic current across the membrane determines the
changes in membrane potential.
I ¼ C
m
dDW
m
dt
Thus, the changes in membrane potential can be
described as follows:
dDW
m
dt
¼
F
C
m
20 Á V
O
2
À V
leak
À 3 Á V
SYN
À V
ANT
ðÞð3bÞ
Eqn (3a,b) represent the full system describing the phos-
phorylation of mitochondria.
The following ion balances have been taken into account
in the model.
The first is the binding ⁄ dissociation of magnesium ions
to ⁄ from adenylate nucleotides in the mitochondrial matrix
and outside of mitochondria to form the complexes
MgADP
)
and MgATP
2)
:
ATP
4À
þ Mg
2þ
¼ MgATP
2À
; K
T;Mg
¼
T
i
Á Mg
i
MgT
i
;
K
T;Mg
¼
T
o
Á Mg
o
MgT
o
ð4Þ
ADP
3À
þ Mg
2þ
¼ MgADP
À
; K
D;Mg
¼
D
i
Á Mg
i
MgD
i
;
K
D;Mg
¼
D
o
Á Mg
o
MgD
o
ð5Þ
Here, T
o
and D
o
are the concentrations of free ATP and
ADP outside of mitochondria. Values of dissociation con-
stants are listed in Table 1.
The second is the binding ⁄ dissociation of protons
to ⁄ from P
i
to form the complexes H
2
PO
4
)
and HPO
4
2)
in
the mitochondrial matrix and outside of mitochondria.
HPO
2À
4
þH
þ
¼H
2
PO
À
4
; K
P;H
¼
P2
i
ÁH
i
P1
i
; K
P;H
¼
P2
o
ÁH
o
P1
o
ð6Þ
Here, P1
i
,P2
i
and P1
o
,P2
o
are the concentrations of
twice-protonated and once-protonated P
i
in the mitochon-
drial matrix and outside the mitochondria, respectively. All
of these binding ⁄ dissociation processes are assumed to be
at equilibrium.
On the basis of Eqns (4,5), we can express the concentra-
tions of free adenine nucleotides and their complexes with
magnesium in terms of total concentrations of ADP
(D
t
o
; D
t
i
) and ATP (T
t
o
; T
t
i
):
T
i
¼ T
t
i
1
1 þ
Mg
i
K
T;Mg
; T
o
¼ T
t
o
1
1 þ
Mg
o
K
T;Mg
MgT
i
¼ T
t
i
Mg
i
K
T;Mg
1 þ
Mg
i
K
T;Mg
; MgT
o
¼ T
t
o
Mg
o
K
T;Mg
1 þ
Mg
o
K
T;Mg
D
i
¼ D
t
i
1
1 þ
Mg
i
K
D;Mg
; D
o
¼ D
t
o
1
1 þ
Mg
o
K
D;Mg
ð7Þ
MgD
i
¼ D
t
i
Mg
i
K
D;Mg
1 þ
Mg
i
K
D;Mg
; MgD
o
¼ D
t
o
Mg
o
K
D;Mg
1 þ
Mg
o
K
D;Mg
Using Eqn (6), we can express the concentrations of
extramitochondrial H
2
PO
4
)
and HPO
4
2)
in terms of total
concentration of P
i
[P
i
]
o
t
P2
o
¼ P
t
o
1
1 þ
H
o
K
P;H
P1
o
¼ P
t
H
o
K
P;H
1 þ
H
o
K
P;H
ð8Þ
The P
i
⁄ H carrier of mitochondria catalyzes the electro-
neutral symport of twice-protonated phosphate and proton:
H
2
PO
4
)
+H
o
+
=(H
2
PO
4
)
)
i
+H
i
+
. The V
max
of P
i
transport is much higher than the rates of adenylate trans-
port and synthesis [55], and the K
m
is much lower than the
concentration of P
i
inside or outside of the matrix. Thus,
the phosphate transport does not limit oxidative phosphor-
ylation under physiological conditions. According to the
rapid equilibrium approximation, we can express the
concentrations of matrix H
2
PO
4
)
and HPO
4
2)
in terms of
extramitochondrial phosphate concentration and pH values
in the mitochondrial matrix and extramitochondrial space:
K
P=H
eq
¼
P1
o
Á H
o
P1
i
Á H
i
So, taking into account the 1 : 1 stoichiometry and elec-
troneutrality of P
i
⁄ H transport, we can conclude that
K
eq
= 1, so we can write the following:
P1
i
¼ P1
o
Á
H
o
H
i
P2
i
¼ P1
i
K
P;H
H
i
ð9Þ
Here [H
+
]
i
and [H
+
]
o
are the proton concentrations in
the mitochondrial matrix and outside of mitochondria:
E. Metelkin et al. Modeling of ANT
FEBS Journal 276 (2009) 6942–6955 ª 2009 The Authors Journal compilation ª 2009 FEBS 6951
H
o
¼ 10
3ÀpH
o
mM
H
i
¼ 10
3ÀpH
i
mM
The rate equation of the ATP synthase reaction is based
on a minimal kinetic scheme for ATP synthesis–hydrolysis
[3]:
V
SYN
¼c
SYN
ÁV
SYN
max
exp n
SYN
v/ðÞ
H
o
K
SYN
Ho
n
SYN
Â
Â
1
K
SYN
MgD
ÁK
SYN
P1
MgD
i
ÁP1
i
ÀMgT
i
ÁK
SYN
eq
Áexp Àn/ðÞÁ
H
o
H
i
Àn
1þ
MgD
i
ÁP1
i
K
SYN
MgD
ÁK
SYN
i
P1
H
o
K
SYN
Ho
n
SYN
þ
MgT
i
K
SYN
MgT
H
i
K
SYN
H
i
exp v
n
/ðÞ
n
SYN
ð10Þ
Here,
/ ¼À
FDw
RT
and K
SYN
eq
¼ K
SYN
hyd
K
T;Mg
K
D;Mg
Á
10
À7þ3
10
À7þ3
þ K
P;H
Values of all parameters of the equation except c
SYN
are
taken from [3,56] and listed in Table 1 and references
therein. c
SYN
is a dimensionless correction factor character-
izing the activity of ATP synthase in the particular mito-
chondrial preparation. This factor has been estimated
through the fitting of the model to the experimental data
presented in this article (see Results and discussion).
The rate equation for adenine nucleotide translocation
has been derived in [2]:
v
ANT
¼ c
ANT
Á
1
D
ANT
k
ANT
2
q
ANT
T
i
Á D
o
K
ANT
D
o
À k
ANT
3
D
i
Á T
i
K
ANT
T
o
!
;
D
ANT
¼ 1 þ
T
o
K
ANT
T
o
þ
D
o
K
ANT
D
o
!
D
i
þ q
ANT
Á T
i
ÀÁ
;
ð11Þ
Here,
q
ANT
¼
k
ANT
3
K
ANT
D
o
k
ANT
2
K
ANT
T
o
exp /ðÞ;
K
ANT
D
o
¼ K
ANT;0
D
o
exp 3d
D
/ðÞ;
K
ANT
To
¼ K
ANT;0
T
o
exp 4d
T
/ðÞ;
k
ANT
2
¼ k
ANT;0
2
exp ðÀ3a
1
À 4a
2
þ a
3
Þ/
fg
;
k
ANT
3
¼ k
ANT;0
3
exp ðÀ4a
1
À 3a
2
þ a
3
Þ/fg
Values of all parameters of the equation for except c
ANT
are taken from [2] and listed in Table 1 and references
therein. The value of c
ANT
refers to the apparent (not the
true) concentration of ANT dimers per mg of total mito-
chondrial protein. Indeed, values for k
2
ANT,0
and k
3
ANT,0
have been estimated (see [2] for details) on the basis of the
experimental data obtained with proteoliposomes. This
means that the values of the rate constants are underesti-
mated, because a proportion of the ANT proteins may be
damaged in that experiment. Consequently, to use the
equation of ANT activity, it is necessary to estimate c
ANT
for the given mitochondrial suspension. In this way, the
values of
k
0
ANTþ
¼ k
ANT;0
2
Á c
ANT
and
k
0
ANTÀ
¼ k
ANT;0
3
Á c
ANT
can be considered as ‘true’ direct and reversed activities of
ANT at zero membrane potential. These values characterize
the given suspension of mitochondria, but not the value of
c
ANT
itself. Thus, c
ANT
has been estimated through the fit-
ting of the model to the experimental data presented in this
article (see Results and discussion).
In order to describe the generation ⁄ consumption of mem-
brane potential, it is necessary to take into account a vari-
ety of processes of ion exchange and leaks catalyzed by
different enzymes and transporters. Several models have
been published for this purpose (e.g. Demin et al. [3]).
However, to simulate ATP synthesis only in respiration
states 2, 3 and 4, a detailed description is obviously redun-
dant. In our study, a simple empirical description of mem-
brane potential of generation ⁄ consumption was used.
Indeed, we assumed that oxygen consumption rate (V
O2
)
and the rate of ion leaks through the inner mitochondrial
membrane were given by the following equations:
V
O
2
¼
k
O2
1 þ K
O
2
exp b
O
2
/
ÀÁ
V
leak
¼ k
leak
exp b
leak
/ðÞ
There are five parameters in these equations. The values of
the parameters (Table 1) were chosen in such a way as to fit
the experimentally measured dependence of O
2
consumption
on electrical potential difference depicted in Fig. 4A, and to
allow the model to describe values of respiratory rate at
states 2, 3 and 4. Indeed, our model was verified against the
following experimental data: state 3 corresponds to
V
O2
= 216 nmol (minÆmg)
)1
, DW
m
= )145 mV; state 2 cor-
responds to V
O2
= 19 nmol (minÆmg)
)1
, DW
m
= )170 mV;
and state 4 (induced by cATR) corresponds to V
O2
=17
nmol (minÆ mg)
)1
, DW
m
= )170 mV.
Reagents
Standard laboratory chemicals, tetrabutylammonium
hydroxide and HPLC-grade acetonitrile were from Sigma
(St Louis, MO, USA). A
p
5A, safranine O and valinomycin
were from Sigma. SF 6847 was from Biomol (catalog num-
ber EI-215; BIOMOL GmbH, Hamburg, Germany). All
mitochondrial substrate stock solutions were dissolved in
double-distilled water and titrated to pH 7.0 with KOH.
Modeling of ANT E. Metelkin et al.
6952 FEBS Journal 276 (2009) 6942–6955 ª 2009 The Authors Journal compilation ª 2009 FEBS
ATP, ADP and AMP were purchased as potassium salts of
the highest purity available, and titrated to pH 6.9 with
KOH.
Statistics
Data are presented as mean ± standard error of the mean
(SEM); significant differences between groups of data were
evaluated by one-way ANOVA followed by Tukey’s post -
hoc analysis, with P < 0.05 being considered significant.
Acknowledgements
We thank Professor Nosza
´
lBe
´
la for providing access to
the HPLC setup, and Dr Judit Doczi for helpful discus-
sions. This work was supported by the Russian Founda-
tion for Basic Research (grant no. 09-01-12097), the FP7
ETHERPATHS project, to O. Demin, and Semmelweis
University Research Grant 63320, OTKA-NKTH
Grant NF68294 and OTKA Grant NNF78905 to C.C.
References
1 Chinopoulos C, Vajda S, Csanady L, Mandi M, Mathe
K & Adam-Vizi V (2009) A novel kinetic assay of mito-
chondrial ATP–ADP exchange rate mediated by the
ANT. Biophys J 96, 2490–2504.
2 Metelkin E, Goryanin I & Demin O (2006) Mathemati-
cal modeling of mitochondrial adenine nucleotide tran-
slocase. Biophys J 90, 423–432.
3 Demin OV, Westerhoff HV & Kholodenko BN (1998)
Mathematical modelling of superoxide generation with
the bc1 complex of mitochondria. Biochemistry (Mosc)
63, 634–649.
4 Beard DA (2005) A biophysical model of the mitochon-
drial respiratory system and oxidative phosphorylation.
PLoS Comput Biol 1, e36.
5 Wu F, Yang F, Vinnakota KC & Beard DA (2007)
Computer modeling of mitochondrial tricarboxylic acid
cycle, oxidative phosphorylation, metabolite transport,
and electrophysiology. J Biol Chem 282, 24525–24537.
6 Terada H (1975) Some biochemical and physicochemi-
cal properties of the potent uncoupler SF 6847 (3,5-di-
tert-butyl-4-hydroxybenzylidenemalononitrile). Biochim
Biophys Acta 387, 519–532.
7 Vignais PV, Vignais PM & Defaye G (1973) Adenosine
diphosphate translocation in mitochondria. Nature of
the receptor site for carboxyatractyloside (gummiferin).
Biochemistry 12, 1508–1519.
8 Demin O & Goryanin I (2008) Kinetic Modelling in
Systems Biology. Taylor & Francis, Boca Raton, FL.
9 Mogilevskaya E, Bagrova N, Plyusnina T, Gizzatkulov
N, Metelkin E, Goryacheva E, Smirnov S, Kosinsky Y,
Dorodnov A, Peskov K et al. (2009) Kinetic modeling
as a tool to integrate multilevel dynamic experimental
data. Methods Mol Biol 563, 197–218.
10 Hooke R & Jeeves TA (1961) ‘Direct search’ solution
of numerical and statistical problems. J. ACM 8,
212–229.
11 Shavit N & San PA (1967) K+-dependent uncoupling
of photophosphorylation by nigericin. Biochem Biophys
Res Commun 28, 277–283.
12 Reed PW (1979) Ionophores. Methods Enzymol 55,
435–454.
13 Akerman KE & Wikstrom MK (1976) Safranine as a
probe of the mitochondrial membrane potential. FEBS
Lett 68, 191–197.
14 Soboll S, Scholz R & Heldt HW (1978) Subcellular
metabolite concentrations. Dependence of mitochon-
drial and cytosolic ATP systems on the metabolic state
of perfused rat liver. Eur J Biochem 87, 377–390.
15 Siess EA & Wieland OH (1976) Phosphorylation state
of cytosolic and mitochondrial adenine nucleotides and
of pyruvate dehydrogenase in isolated rat liver cells.
Biochem J 156, 91–102.
16 Wieland OH & Portenhauser R (1974) Regulation of
pyruvate–dehydrogenase interconversion in rat-liver
mitochondria as related to the phosphorylation state of
intramitochondrial adenine nucleotides. Eur J Biochem
45, 577–588.
17 Vignais PV, Vignais PM & Doussiere J (1975) Func-
tional relationship between the ADP ⁄ ATP-carrier and
the F1-ATPase in mitochondria. Biochim Biophys Acta
376, 219–230.
18 Wanders RJ, Van Woerkom GM, Nooteboom RF,
Meijer AJ & Tager JM (1981) Relationship between the
rate of citrulline synthesis and bulk changes in the
intramitochondrial ATP ⁄ ADP ratio in rat-liver mito-
chondria. Eur J Biochem
113, 295–302.
19 Heldt HW (1970) Differences between the phosphoryla-
tion potentials of adenosine triphosphate inside and
outside the mitochondria. Biochem J, 116, 15P.
20 Heldt HW, Klingenberg M & Milovancev M (1972)
Differences between the ATP–ADP ratios in the mito-
chondrial matrix and in the extramitochondrial space.
Eur J Biochem 30, 434–440.
21 Davis EJ, Lumeng L & Bottoms D (1974) On the
relationships between the stoichiometry of oxidative
phosphorylation and the phosphorylation potential of
rat liver mitochondria as functions of respiratory state.
FEBS Lett 39, 9–12.
22 Davis EJ & Lumeng L (1974) The effects of palmityl-
coenzyme A and atractyloside on the steady-state intra-
and extra-mitochondrial phosphorylation potentials
generated during ADP-controlled respiration. FEBS
Lett 48, 250–252.
23 Letko G, Kuster U, Duszynski J & Kunz W (1980)
Investigation of the dependence of the intramitochond-
E. Metelkin et al. Modeling of ANT
FEBS Journal 276 (2009) 6942–6955 ª 2009 The Authors Journal compilation ª 2009 FEBS 6953
rial [ATP] ⁄ [ADP] ratio on the respiration rate. Biochim
Biophys Acta 593, 196–203.
24 Brawand F, Folly G & Walter P (1980) Relation
between extra- and intramitochondrial ATP ⁄ ADP ratios
in rat liver mitochondria. Biochim Biophys Acta 590,
285–289.
25 Walajtys EI, Gottesman DP & Williamson JR (1974)
Regulation of pyruvate dehydrogenase in rat liver mito-
chondria by phosphorylation-dephosphorylation. J Biol
Chem 249, 1857–1865.
26 Wilson DF, Nelson D & Erecinska M (1982) Binding
of the intramitochondrial ADP and its relationship to
adenine nucleotide translocation. FEBS Lett 143, 228–
232.
27 Wilson DF, Erecinska M & Schramm VL (1983)
Evaluation of the relationship between the intra-
and extramitochondrial [ATP] ⁄ [ADP] ratios using
phosphoenolpyruvate carboxykinase. J Biol Chem 258,
10464–10473.
28 Schwenke WD, Soboll S, Seitz HJ & Sies H (1981)
Mitochondrial and cytosolic ATP ⁄ ADP ratios in rat
liver in vivo. Biochem J 200, 405–408.
29 Soboll S, Seitz HJ, Sies H, Ziegler B & Scholz R (1984)
Effect of long-chain fatty acyl-CoA on mitochondrial
and cytosolic ATP ⁄ ADP ratios in the intact liver cell.
Biochem J 220, 371–376.
30 Soboll S, Akerboom TP, Schwenke WD, Haase R &
Sies H (1980) Mitochondrial and cytosolic ATP ⁄ ADP
ratios in isolated hepatocytes. A comparison of the
digitonin method and the non-aqueous fractionation
procedure. Biochem J 192, 951–954.
31 Shrago E, Ball M, Sul HS, Baquer NZ & McLean P
(1977) Interrelationship in the regulation of pyruvate
dehydrogenase and adenine-nucleotide translocase by
palmitoyl-CoA in isolated mitochondria. Eur J Biochem
75, 83–89.
32 Pfaff E & Klingenberg M (1968) Adenine nucleotide
translocation of mitochondria. 1. Specificity and con-
trol. Eur J Biochem 6, 66–79.
33 Lusty CJ (1978) Carbamoylphosphate synthetase I of
rat-liver mitochondria. Purification, properties, and
polypeptide molecular weight. Eur J Biochem 85,
373–383.
34 Matlib MA, Shannon WA Jr & Srere PA (1977) Mea-
surement of matrix enzyme activity in isolated mito-
chondria made permeable with toluene. Arch Biochem
Biophys 178, 396–407.
35 Boyer PD (2001) Toward an adequate scheme for the
ATP synthase catalysis. Biochemistry (Mosc), 66, 1058–
1066.
36 Senior AE, Nadanaciva S & Weber J (2000) Rate accel-
eration of ATP hydrolysis by F(1)F(o)-ATP synthase.
J Exp Biol 203, 35–40.
37 Jault JM & Allison WS (1994) Hysteretic inhibition of
the bovine heart mitochondrial F1-ATPase is due to
saturation of noncatalytic sites with ADP which blocks
activation of the enzyme by ATP. J Biol Chem 269
,
319–325.
38 Harris DA, Rosing J, van de Stadt RJ & Slater EC
(1973) Tight binding of adenine nucleotides to beef-
heart mitochondrial ATPase. Biochim Biophys Acta 314,
149–153.
39 Murthy MS & Pande SV (1985) Microcompartmenta-
tion of transported carnitine, acetylcarnitine and ADP
occurs in the mitochondrial matrix. Implications for
transport measurements and metabolism. Biochem J
230, 657–663.
40 Vignais PV (1976) Molecular and physiological aspects
of adenine nucleotide transport in mitochondria.
Biochim Biophys Acta 456, 1–38.
41 Hamman HC & Haynes RC Jr (1983) Elevated intrami-
tochondrial adenine nucleotides and mitochondrial
function. Arch Biochem Biophys 223, 85–94.
42 Out TA, Valeton E & Kemp A Jr (1976) Role of the in-
tramitochondrial adenine nucleotides as intermediates in
the uncoupler-induced hydrolysis of extramitochondrial
ATP. Biochim Biophys Acta 440, 697–710.
43 Heldt HW & Pfaff E (1969) Adenine nucleotide translo-
cation in mitochondria. Quantitative evaluation of the
correlation between the phosphorylation of endogenous
and exogenous ADP in mitochondria. Eur J Biochem
10, 494–500.
44 Hartung KJ, Bohme G & Kunz W (1983) Involvement
of intramitochondrial adenine nucleotides and inorganic
phosphate in oxidative phosphorylation of extramitoc-
hondrially added adenosine-5¢-diphosphate. Biomed Bio-
chim Acta 42, 15–26.
45 Klingenberg M (2008) The ADP and ATP transport in
mitochondria and its carrier. Biochim Biophys Acta
1778, 1978–2021.
46 Chinopoulos C & Adam-Vizi V (2009) Mitochondria as
ATP consumers in cellular pathology. Biochim Biophys
Acta, doi: 10.1016/j.bbadis.2009.08.008.
47 Kindmark H, Kohler M, Brown G, Branstrom R,
Larsson O & Berggren PO (2001) Glucose-induced
oscillations in cytoplasmic free Ca2+ concentration
precede oscillations in mitochondrial membrane poten-
tial in the pancreatic beta-cell. J Biol Chem 276,
34530–34536.
48 Duchen MR, Leyssens A & Crompton M (1998)
Transient mitochondrial depolarizations reflect focal
sarcoplasmic reticular calcium release in single rat
cardiomyocytes. J Cell Biol 142, 975–988.
49 O’Reilly CM, Fogarty KE, Drummond RM, Tuft RA
& Walsh JV Jr (2003) Quantitative analysis of sponta-
neous mitochondrial depolarizations. Biophys J 85,
3350–3357.
50 Gerencser AA & Adam-Vizi V (2005) Mitochondrial
Ca2+ dynamics reveals limited intramitochondrial
Ca2+ diffusion. Biophys J 88, 698–714.
Modeling of ANT E. Metelkin et al.
6954 FEBS Journal 276 (2009) 6942–6955 ª 2009 The Authors Journal compilation ª 2009 FEBS
51 Tyler DD & Gonze J (1967) The preparation of heart
mitochondria from laboratory animals. Methods Enzy-
mol 10, 75–77.
52 Lienhard GE & Secemski II (1973) P1,P5-Di(adenosine-
5¢)pentaphosphate, a potent multisubstrate inhibitor of
adenylate kinase. J Biol Chem 248, 1121–1123.
53 Leyssens A, Nowicky AV, Patterson L, Crompton M &
Duchen MR (1996) The relationship between mito-
chondrial state, ATP hydrolysis, [Mg2+]i and [Ca2+]i
studied in isolated rat cardiomyocytes. J Physiol 496,
111–128.
54 Broekemeier KM, Dempsey ME & Pfeiffer DR (1989)
Cyclosporin A is a potent inhibitor of the inner
membrane permeability transition in liver mitochondria.
J Biol Chem 264, 7826–7830.
55 Coty WA & Pedersen PL (1974) Phosphate transport in
rat liver mitochondria. Kinetics and energy require-
ments. J Biol Chem 249, 2593–2598.
56 Demin OV, Gorianin II, Kholodenko BN & Westerhoff
HV (2001) Kinetic modeling of energy metabolism and
generation of active forms of oxygen in hepatocyte
mitochondria. Mol Biol (Mosk) 35, 1095–1104.
57 Corkey BE, Duszynski J, Rich TL, Matschinsky B &
Williamson JR (1986) Regulation of free and bound
magnesium in rat hepatocytes and isolated mitochon-
dria. J Biol Chem 261, 2567–2574.
58 Hagen T, Lagace CJ, Modica-Napolitano JS & Aprille
JR (2003) Permeability transition in rat liver mitochon-
dria is modulated by the ATP-Mg ⁄ Pi carrier. Am J
Physiol Gastrointest Liver Physiol 285, G274–G281.
59 Joyal JL, Hagen T & Aprille JR (1995) Intramitochond-
rial protein synthesis is regulated by matrix adenine
nucleotide content and requires calcium. Arch Biochem
Biophys 319, 322–330.
60 Nosek MT, Dransfield DT & Aprille JR (1990) Calcium
stimulates ATP-Mg ⁄ Pi carrier activity in rat liver mito-
chondria. J Biol Chem 265, 8444–8450.
61 Austin J & Aprille JR (1984) Carboxyatractyloside-
insensitive influx and efflux of adenine nucleotides in
rat liver mitochondria. J Biol Chem 259 , 154–160.
62 Rulfs J & Aprille JR (1982) Adenine nucleotide pool
size, adenine nucleotide translocase activity, and respira-
tory activity in newborn rabbit liver mitochondria. Bio-
chim Biophys Acta 681, 300–304.
63 Dawson RMC, Elliot DC, Elliot WH & Jones KM
(1986) Data for Biochemical Research. Clarendon Press,
Oxford.
64 Rosing J & Slater EC (1972) The value of G degrees
for the hydrolysis of ATP. Biochim Biophys Acta 267,
275–290.
65 Ferguson SJ (2000) ATP synthase: what dictates the size
of a ring? Curr Biol 10, R804–R808.
66 Reich JG & Rohde K (1983) On the relationship
between Z delta pH and delta psi as components of the
protonmotive potential in Mitchell’s chemiosmotic sys-
tem. Biomed Biochim Acta 42, 37–46.
E. Metelkin et al. Modeling of ANT
FEBS Journal 276 (2009) 6942–6955 ª 2009 The Authors Journal compilation ª 2009 FEBS 6955