Florida Results For 9/15/2012—9/16/2012 ppt
Bạn đang xem bản rút gọn của tài liệu. Xem và tải ngay bản đầy đủ của tài liệu tại đây (601.29 KB, 37 trang )
1
Florida ResultsFlorida Results
For 9/15/2012For 9/15/2012
—
—9/16/20129/16/2012
Contact: Doug Kaplan, 407Contact: Doug Kaplan, 407
-
-242242
-
-1870 1870
Executive Summary
Gravis Marketing, a non-partisan research firm, and Capitol
Correspondent conducted a telephone survey of 1,728 likely
voters in the state of Florida on the afternoon and early even-
ing of September 15
th
and 16
th
, 2012. The questions covered
preference for a given presidential candidate, the Florida U.S.
Senate Race between Connie Mack and Bill Nelson, and Gov-
ernor Rick Scott’s performance rating. The full list of ques-
tions are given on page 5. Overall, Romney holds a 47.7% to
a 47.1% lead over Obama, with a margin of error of about
2.5%. The Romney lead of 0.6% is a decline of 0.7% from a
1.3% lead on September 2, 2012. The results are generally in
line with recent polls from Rasmussen Reports (Obama +2),
NBC/WSJ/Marist (Obama +5), AIR/McLaughlin (Romney
+3), SurveyUSA (Obama +4), and PPP (Obama +1). The fig-
ures reported in this report are more recent, being as of Sep-
tember 15-16, 2012.
Analysis
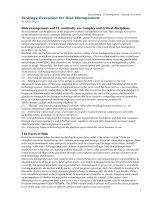
How does the race look according to party?
When looking at the presidential race according to party,
Romney holds a 3 point lead among party adherents, with a
two point lead in taking votes from the Democratic party.
Romney also holds a 3.7% lead among individuals that are
independent or unsure of their party affiliation. The results
are reported on the following page.
How about the race between Mack and Nelson?
The race between Republican Connie Mack and Democrat Bill
Nelson continues to be close, with the most recent poll results
Contact: Doug Kaplan, 407Contact: Doug Kaplan, 407
-
-242242
-
-1870 1870
2
Florida ResultsFlorida Results
For 9/15/2012For 9/15/2012
—
—9/16/20129/16/2012
Contact: Doug Kaplan, 407Contact: Doug Kaplan, 407
-
-242242
-
-1870 1870
Contact: Doug Kaplan, 407Contact: Doug Kaplan, 407
-
-242242
-
-1870 1870
giving Mack a 42.7% to 41.5% lead. As has been the case so far, the race
will likely be settled based on the unsure voters, representing about 16%
of the total group of likely voters.
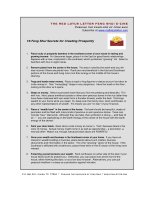
The Poll asked about whether George Zimmerman is guilty in the death
of Trevon Martin: how does this relate to the Presidential race?
The George Zimmerman case breaks down distinctly when looking at the
presidential race, with 73% of likely Obama voters indicating they think
he is guilty of murder, whereas 80% of likely Romney voters indicating they do not think he is guilty of
murder. Among likely voters that indicated they were unsure or didn’t know enough about the case, Rom-
ney holds a 48%/45% or 51%/44% lead over likely Obama voters.
How do likely voters feel about Rick Scott’s performance as Governor?
Overall, voters are more negative on Rick Scott, with 40% giving him a negative rating, while 33% giving
Party affiliation? / Obama/Biden, Romney/Ryan?
Democrat Republican Other/Unsure
Obama
Romney
Other/Unsure
Obama
Romney
Other/Unsure
Obama
Romney
Other/Unsure
0%
20%
40%
60%
80%
100%
% of Total
3.5%
11.7%
84.8%
2.5%
87.9%
9.6%
16.1%
43.8%
40.1%
Presidential race according to party
Obama/Biden, Romney/Ryan?
Obama
Romney
Other/Unsure
Mack, Nelson, Other/Un
0%
10%
20%
30%
40%
50%
Senate race
Mack, Nelson, Other/Unsure?
Mack
Nelson
Other/Unsure
Margin of error is +/- 2.5%
3
Florida ResultsFlorida Results
For 9/15/2012 For 9/15/2012
–
– 9/16/20129/16/2012
Contact: Doug Kaplan, 407Contact: Doug Kaplan, 407
-
-242242
-
-1870 1870
Contact: Doug Kaplan, 407Contact: Doug Kaplan, 407
-
-242242
-
-1870 1870
him a positive rating; about 27% indicate they are unsure of his performance. The crosstabs results contain
more information on the question.
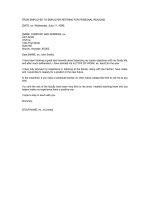
The poll asked about hypothetical matchup between Rick Scott and Charlie Crist and between Rick Scott
and Buddy Dyer. What’s the story there?
The results of the two questions are reported on the following page. Overall, in a hypothetical race between
Rick Scott and Buddy Dyer, Rick Scott comes out ahead by a 13 point margin, 42% to 29%. In a hypothet-
ical race between Rick Scott and Charlie Crist, Crist holds the lead at 44% to 42%.
Is Zimmerman guilty in the death of Trevon Martin? / Obama/Biden, Romney/Ryan?
Guilty Not guilty Unsure Don't know enough
Obama
Romney
Other/Unsure
Obama
Romney
Other/Unsure
Obama
Romney
Other/Unsure
Obama
Romney
Other/Unsure
0%
20%
40%
60%
80%
% of Total
4.1%
23.1%
72.8%
3.5%
79.9%
16.6%
6.7%
48.2%
45.1%
4.8%
50.8%
44.4%
Presidential race and the George Zimmerman case
Obama/Biden, Romney/Ryan?
Obama
Romney
Other/Unsure
4
Florida ResultsFlorida Results
For 9/15/2012For 9/15/2012
—
—9/16/20129/16/2012
Contact: Doug Kaplan, 407Contact: Doug Kaplan, 407
-
-242242
-
-1870 1870
Contact: Doug Kaplan, 407Contact: Doug Kaplan, 407
-
-242242
-
-1870 1870
Rick Scott or Buddy Dyer?
Scott Dyer Other/U
0%
5%
10%
15%
20%
25%
30%
35%
40%
45%
% of Total
29.0%
29.4%
41.7%
Rick Scott or Buddy Dyer?
Rick Scott or Buddy Dyer?
Scott
Dyer
Other/Unsure
Rick Scott or Charlie Crist?
Scott Crist Other/U
0%
5%
10%
15%
20%
25%
30%
35%
40%
45%
% of Total
14.1%
44.0%
41.9%
Rick Scott or Charlie Crist?
Rick Scott or Charlie Crist?
Scott
Crist
Other/Unsure
5
Florida ResultsFlorida Results
For 9/15/2012For 9/15/2012
—
—9/16/20129/16/2012
Contact: Doug Kaplan, 407Contact: Doug Kaplan, 407
-
-242242
-
-1870 1870
Contact: Doug Kaplan, 407Contact: Doug Kaplan, 407
-
-242242
-
-1870 1870
Is America headed in the right direction?
When looking at this question according to party, two third of Democrats think America is on the right track,
while over four fifths of Republicans think America is on the wrong track. Interestingly, about 60% of indi-
viduals that do not identify themselves with a party think America is on the wrong track, while only 24%
think the nation is on the right track.
Party affiliation? / U.S. headed in the right direction?
Democrat Republican Independent
Right direction
Wrong direction
Unsure
Right direction
Wrong direction
Unsure
Right direction
Wrong direction
Unsure
0%
20%
40%
60%
80%
100%
% of Total
17.6%
16.2%
66.2%
7.4%
82.8%
9.8%
16.2%
59.9%
23.9%
U.S. headed in the right direction?
6
Florida ResultsFlorida Results
For 9/15/2012For 9/15/2012
—
—9/16/20129/16/2012
Contact: Doug Kaplan, 407Contact: Doug Kaplan, 407
-
-242242
-
-1870 1870
Contact: Doug Kaplan, 407Contact: Doug Kaplan, 407
-
-242242
-
-1870 1870
How does Gary Johnson impact the race?
The inclusion of Gary Johnson in the race lowers Romney’s overall take from 47.7% to 46.7% and lowers
Obama’s overall take from 47.1% to 45.5%.
How do likely voters feel about Obama’s job performance in relation to age group?
Overall, likely voters disapprove of Obama’s job performance by a 49% to 45% margin. When looking at
the issue in relation to age group, Obama is approved by younger voters, while having a disapproval rating
above 50% for all other age categories. Obama’s disapproval rating is highest among likely voters aged 50
and over, with a close second being likely voters aged 30 to 39. Interestingly, Obama’s disapproval rating
doesn’t consistently get worse as the age group gets older, rather there’s a bump down in his disapproval
rating among 40 to 49 year olds.
Approve
Disapprove
Unsure/Other
Approve
Disapprove
Unsure/Other
Approve
Disapprove
Unsure/Other
Approve
Disapprove
Unsure/Other
% of Total Count of Approve of Obama's performanc
7.7%
38.1%
54.2%
3.7%
51.1%
45.3%
6.7%
48.0%
45.3%
5.3%
52.7%
42.0%
7
Florida ResultsFlorida Results
For 9/15/2012For 9/15/2012
—
—9/16/20129/16/2012
Contact: Doug Kaplan, 407Contact: Doug Kaplan, 407
-
-242242
-
-1870 1870
Contact: Doug Kaplan, 407Contact: Doug Kaplan, 407
-
-242242
-
-1870 1870
1. Are you a registered voter?
2. Do you plan on voting in the presidential election on November 6th?
3. Which party are you either registered to vote or do you consider yourself a member of?
4. What’s your race?
5. What’s your religious affiliation?
6. What’s your age group? 18-29; 30-39; 40-49; 50+
7. What’s your gender?
8. Do you approve of Barack Obama’s general performance as President?
9. Do you have a favorable or unfavorable opinion of Mitt Romney?
10. If the election were held today, would you vote for Obama-Biden, Romney-Ryan, or note sure?
11. If the election were held today, would you vote for Obama, Romney, Libertarian Gary Johnson, or someone else/
unsure?
12. Do you think the United States of America is headed in the right direction?
13. If the election were held today, would you vote for Connie Mack or Bill Nelson?
14. How would you rate Rick Scott’s job performance as Governor?
15. In a hypothetical race for Governor in 2014, would you vote for Republican Rick Scott or Democrat Charlie
Crist?
16. In a hypothetical race for Governor in 2014, would you vote for Republican Rick Scott or Democrat Buddy Dyer?
17. Final question is concerning the State of Florida versus George Zimmerman: Do you believe that George Zim-
merman is guilty or not guilty in the death of Trevon Martin?
The results were weighted by the anticipated voting groups in the upcoming 2012 election.
Party Affiliation
Democrat 44.0%
Independent/Other 17.6%
Republican 38.4%
Race
Asian 3.3%
Black 10.9%
Hispanic 15.8%
Other/Unsure 4.1%
White 65.9%
Religious Affiliation
Catholic 29.0%
Jewish 4.3%
Muslim 2.6%
Other/Unsure 20.6%
Protestant/Other Christian 43.5%
Age Group
18-29 16.4%
30-39 17.1%
40-49 19.3%
50+ 47.2%
Gender
Female 51.8%
Male 48.2%
Approve of Obama's Job Performance?
Approve 45.2%
Disapprove 49.2%
Other/Unsure 5.7%
Favorable Opinion of Romney?
Favorable 43.9%
Other/Unsure 10.8%
Unfavorable 45.3%
Obama/Biden, Romney/Ryan
Obama/Biden 47.1%
Other/Unsure 5.3%
Romney/Ryan 47.7%
S
ummar
y
Stats
Obama, Romney, Johnson
Johnson 3.5%
Obama 45.5%
Other/Unsure 4.3%
Romney 46.7%
U.S. Headed in the Right Direction?
Right direction 36.1%
Unsure 13.2%
Wrong direction 50.7%
Mack, Nelson, Other
Mack 42.7%
Nelson 41.5%
Unsure/Other 15.8%
Rick Scott's Job Performance
Negative 39.9%
Positive 32.9%
Unsure/Other 27.3%
Scott, Crist, Unsure?
Crist 43.8%
Scott 41.8%
Unsure 14.4%
Scott, Dyer, Unsure?
Dyer 29.4%
Scott 41.7%
Unsure 29.0%
Is George Zimmerman Guilty in the Trevon Martin Case?
Guilty 33.3%
Not familiar with the case 5.4%
Not guilty 29.3%
Unsure 31.9%
Florida Crosstabs (Sep. 15-16, 2012) Monday September 17 13:58:17 2012 Page 1
log type:
smcl
opened on:
17 Sep 2012, 13:56:34
. tab2 partyaffiliation race religiousaffiliation agegroup gender approveofoba
> masperformance favorableorunfavorableopinionofr obamabidenromneyryanorotheru
> nsur obamaromneyjohnsonotherunsure usheadedintherightdirection macknelsonoth
> er rickscottsperformanceasgovernor hypothetical2014rickscottorcharl hypothet
> ical2014rickscottorbuddy iszimmermanguiltyinthedeathoftre, cell chi2 lrchi2
> nofreq
-> tabulation of partyaffiliation by race
Party Race?
affiliation? Asian Black Hispanic Other/Uns White
> Total
>
Democrat
1.88 8.25 9.02 1.60 22.85
> 43.61
Independent/Other
0.49 1.11 2.96 1.32 11.74
> 17.62
Republican
0.91 1.57 3.80 1.15 31.35
> 38.77
>
Total
3.27 10.94 15.78 4.08 65.94
> 100.00
Pearson chi2(
8
) =
274.5378
Pr =
0.000
likelihood-ratio chi2(
8
) =
278.3779
Pr =
0.000
-> tabulation of partyaffiliation by religiousaffiliation
Party Religious affiliation?
affiliation? Catholic Jewish Muslim Other/Uns Protestan
> Total
>
Democrat
12.17 2.28 1.54 12.60 14.64
> 43.23
Independent/Other
5.68 0.86 0.68 4.21 6.28
> 17.71
Republican
11.17 1.18 0.39 3.75 22.56
> 39.06
>
Total
29.03 4.32 2.61 20.56 43.48
> 100.00
Pearson chi2(
8
) =
221.2770
Pr =
0.000
likelihood-ratio chi2(
8
) =
232.6668
Pr =
0.000
-> tabulation of partyaffiliation by agegroup
Party Age group?
affiliation? 18-29 30-39 40-49 50+ Total
Democrat
7.42 7.93 7.78 19.77 42.90
Independent/Other
3.55 3.44 4.06 6.70 17.74
Republican
5.47 5.68 7.49 20.71 39.36
Total
16.44 17.05 19.33 47.18 100.00
Florida Crosstabs (Sep. 15-16, 2012) Monday September 17 13:58:18 2012 Page 2
Pearson chi2(
6
) =
36.3482
Pr =
0.000
likelihood-ratio chi2(
6
) =
36.7476
Pr =
0.000
-> tabulation of partyaffiliation by gender
Party Gender?
affiliation? Female Male Total
Democrat
25.74 17.23 42.97
Independent/Other
6.69 11.01 17.70
Republican
19.41 19.92 39.33
Total
51.84 48.16 100.00
Pearson chi2(
2
) =
71.9730
Pr =
0.000
likelihood-ratio chi2(
2
) =
72.4791
Pr =
0.000
-> tabulation of partyaffiliation by approveofobamasperformance
Party Approve of Obama's performance?
affiliation? Approve Disapprov Other/Uns Total
Democrat
34.68 5.44 2.72 42.84
Independent/Other
6.65 9.18 1.69 17.52
Republican
3.86 34.53 1.25 39.64
Total
45.19 49.16 5.66 100.00
Pearson chi2(
4
) =
1.3e+03
Pr =
0.000
likelihood-ratio chi2(
4
) =
1.4e+03
Pr =
0.000
-> tabulation of partyaffiliation by favorableorunfavorableopinionofr
Favorable or unfavorable opinion
Party of Romney?
affiliation? Favorable Other/Uns Unfavorab Total
Democrat
5.16 4.53 33.02 42.71
Independent/Other
7.01 3.04 7.46 17.51
Republican
31.73 3.23 4.82 39.78
Total
43.90 10.80 45.31 100.00
Pearson chi2(
4
) =
1.1e+03
Pr =
0.000
likelihood-ratio chi2(
4
) =
1.2e+03
Pr =
0.000
-> tabulation of partyaffiliation by obamabidenromneyryanorotherunsur
Obama/Biden, Romney/Ryan, or
Party Other/Unsure?
affiliation? Obama/Bid Other/Uns Romney/Ry Total
Democrat
36.31 1.50 4.99 42.81
Independent/Other
6.91 2.78 7.55 17.24
Republican
3.83 1.01 35.11 39.95
Total
47.05 5.29 47.65 100.00
Pearson chi2(
4
) =
1.5e+03
Pr =
0.000
likelihood-ratio chi2(
4
) =
1.6e+03
Pr =
0.000
-> tabulation of partyaffiliation by obamaromneyjohnsonotherunsure
Florida Crosstabs (Sep. 15-16, 2012) Monday September 17 13:58:18 2012 Page 3
Party Obama, Romney, Johnson, Other/Unsure?
affiliation? Johnson Obama Other/Uns Romney Total
Democrat
0.61 36.06 1.26 4.56 42.49
Independent/Other
1.98 6.20 1.90 7.27 17.34
Republican
0.95 3.27 1.10 34.84 40.17
Total
3.54 45.53 4.26 46.67 100.00
Pearson chi2(
6
) =
1.5e+03
Pr =
0.000
likelihood-ratio chi2(
6
) =
1.7e+03
Pr =
0.000
-> tabulation of partyaffiliation by usheadedintherightdirection
U.S. headed in the right
Party direction?
affiliation? Right dir Unsure Wrong dir Total
Democrat
28.01 7.44 6.87 42.33
Independent/Other
4.14 2.80 10.36 17.31
Republican
3.95 2.99 33.42 40.37
Total
36.11 13.24 50.65 100.00
Pearson chi2(
4
) =
1.0e+03
Pr =
0.000
likelihood-ratio chi2(
4
) =
1.1e+03
Pr =
0.000
-> tabulation of partyaffiliation by macknelsonother
Party Mack, Nelson, Other?
affiliation? Mack Nelson Unsure/Ot Total
Democrat
5.31 30.27 6.38 41.96
Independent/Other
7.21 5.63 4.56 17.39
Republican
30.19 5.63 4.83 40.65
Total
42.71 41.52 15.77 100.00
Pearson chi2(
4
) =
941.0914
Pr =
0.000
likelihood-ratio chi2(
4
) =
1.0e+03
Pr =
0.000
-> tabulation of partyaffiliation by rickscottsperformanceasgovernor
Rick Scott's performance as
Party Governor?
affiliation? Negative Positive Unsure/Ot Total
Democrat
25.61 5.27 11.14 42.02
Independent/Other
7.12 5.75 4.62 17.49
Republican
7.16 21.83 11.50 40.49
Total
39.89 32.85 27.26 100.00
Pearson chi2(
4
) =
509.1156
Pr =
0.000
likelihood-ratio chi2(
4
) =
544.4209
Pr =
0.000
-> tabulation of partyaffiliation by hypothetical2014rickscottorcharl
Florida Crosstabs (Sep. 15-16, 2012) Monday September 17 13:58:18 2012 Page 4
Hypothetical 2014: Rick Scott or
Party Charlie Crist?
affiliation? Crist Scott Unsure Total
Democrat
30.75 4.06 7.30 42.11
Independent/Other
7.18 7.67 2.54 17.38
Republican
5.90 30.05 4.55 40.51
Total
43.83 41.78 14.39 100.00
Pearson chi2(
4
) =
909.2304
Pr =
0.000
likelihood-ratio chi2(
4
) =
1.0e+03
Pr =
0.000
-> tabulation of partyaffiliation by hypothetical2014rickscottorbuddy
Hypothetical 2014: Rick Scott or
Party Buddy Dyer?
affiliation? Dyer Scott Unsure Total
Democrat
22.65 4.01 15.35 42.01
Independent/Other
3.37 7.34 6.87 17.59
Republican
3.33 30.32 6.75 40.40
Total
29.35 41.67 28.98 100.00
Pearson chi2(
4
) =
951.9854
Pr =
0.000
likelihood-ratio chi2(
4
) =
1.0e+03
Pr =
0.000
-> tabulation of partyaffiliation by iszimmermanguiltyinthedeathoftre
Is Zimmerman guilty in the death of Trevon
Party Martin?
affiliation? Guilty Not famil Not guilt Unsure Total
Democrat
21.70 2.36 4.98 12.76 41.81
Independent/Other
5.20 1.33 4.04 7.05 17.62
Republican
6.45 1.72 20.28 12.12 40.57
Total
33.35 5.41 29.31 31.93 100.00
Pearson chi2(
6
) =
448.7038
Pr =
0.000
likelihood-ratio chi2(
6
) =
459.6601
Pr =
0.000
-> tabulation of race by religiousaffiliation
Religious affiliation?
Race? Catholic Jewish Muslim Other/Uns Protestan Tot
> al
>
Asian
0.50 0.00 0.71 1.43 0.64 3.
> 28
Black
1.43 0.32 0.64 2.43 6.18 11.
> 00
Hispanic
8.14 0.57 0.71 2.57 3.18 15.
> 17
Other/Unsure
0.86 0.14 0.11 1.14 1.71 3.
> 96
White
18.10 3.28 0.43 13.00 31.77 66.
> 58
>
Total
29.03 4.32 2.61 20.56 43.48 100.
> 00
Florida Crosstabs (Sep. 15-16, 2012) Monday September 17 13:58:18 2012 Page 5
Pearson chi2(
16
) =
422.2744
Pr =
0.000
likelihood-ratio chi2(
16
) =
.
-> tabulation of race by agegroup
Age group?
Race? 18-29 30-39 40-49 50+ Total
Asian
0.43 0.94 0.65 1.23 3.26
Black
2.68 2.86 1.70 3.69 10.93
Hispanic
2.39 3.29 4.27 4.78 14.74
Other/Unsure
0.51 0.54 1.09 1.88 4.02
White
10.43 9.41 11.62 35.59 67.05
Total
16.44 17.05 19.33 47.18 100.00
Pearson chi2(
12
) =
128.5716
Pr =
0.000
likelihood-ratio chi2(
12
) =
124.3357
Pr =
0.000
-> tabulation of race by gender
Gender?
Race? Female Male Total
Asian
1.38 1.89 3.27
Black
6.62 4.33 10.94
Hispanic
6.87 7.89 14.76
Other/Unsure
2.07 1.89 3.96
White
34.90 32.17 67.07
Total
51.84 48.16 100.00
Pearson chi2(
4
) =
16.8877
Pr =
0.002
likelihood-ratio chi2(
4
) =
16.9734
Pr =
0.002
-> tabulation of race by approveofobamasperformance
Approve of Obama's performance?
Race? Approve Disapprov Other/Uns Total
Asian
2.50 0.66 0.15 3.31
Black
7.86 2.72 0.37 10.95
Hispanic
7.60 6.28 0.77 14.66
Other/Unsure
2.17 1.47 0.33 3.97
White
25.06 38.02 4.04 67.12
Total
45.19 49.16 5.66 100.00
Pearson chi2(
8
) =
179.8533
Pr =
0.000
likelihood-ratio chi2(
8
) =
183.2013
Pr =
0.000
-> tabulation of race by favorableorunfavorableopinionofr
Favorable or unfavorable opinion
of Romney?
Race? Favorable Other/Uns Unfavorab Total
Asian
1.26 0.45 1.63 3.34
Black
3.15 1.15 6.38 10.69
Hispanic
4.94 2.00 7.64 14.58
Other/Unsure
1.52 0.45 2.04 4.01
White
33.02 6.75 27.61 67.38
Total
43.90 10.80 45.31 100.00
Florida Crosstabs (Sep. 15-16, 2012) Monday September 17 13:58:18 2012 Page 6
Pearson chi2(
8
) =
65.9229
Pr =
0.000
likelihood-ratio chi2(
8
) =
66.7007
Pr =
0.000
-> tabulation of race by obamabidenromneyryanorotherunsur
Obama/Biden, Romney/Ryan, or
Other/Unsure?
Race? Obama/Bid Other/Uns Romney/Ry Total
Asian
2.33 0.08 0.98 3.38
Black
7.40 0.38 2.82 10.59
Hispanic
7.81 1.16 5.48 14.46
Other/Unsure
2.29 0.23 1.31 3.83
White
27.22 3.45 37.06 67.74
Total
47.05 5.29 47.65 100.00
Pearson chi2(
8
) =
138.0281
Pr =
0.000
likelihood-ratio chi2(
8
) =
139.4474
Pr =
0.000
-> tabulation of race by obamaromneyjohnsonotherunsure
Obama, Romney, Johnson, Other/Unsure?
Race? Johnson Obama Other/Uns Romney Total
Asian
0.08 2.36 0.00 0.99 3.42
Black
0.23 7.34 0.23 2.66 10.46
Hispanic
0.80 7.57 0.68 5.36 14.42
Other/Unsure
0.08 2.21 0.19 1.33 3.80
White
2.36 26.06 3.16 36.33 67.90
Total
3.54 45.53 4.26 46.67 100.00
Pearson chi2(
12
) =
150.1458
Pr =
0.000
likelihood-ratio chi2(
12
) =
.
-> tabulation of race by usheadedintherightdirection
U.S. headed in the right
direction?
Race? Right dir Unsure Wrong dir Total
Asian
2.23 0.84 0.38 3.45
Black
6.02 1.19 3.07 10.28
Hispanic
5.95 1.65 6.95 14.54
Other/Unsure
1.84 0.50 1.42 3.76
White
20.07 9.06 38.83 67.96
Total
36.11 13.24 50.65 100.00
Pearson chi2(
8
) =
165.0058
Pr =
0.000
likelihood-ratio chi2(
8
) =
171.1909
Pr =
0.000
-> tabulation of race by macknelsonother
Mack, Nelson, Other?
Race? Mack Nelson Unsure/Ot Total
Asian
1.27 1.74 0.55 3.57
Black
3.17 5.78 1.43 10.38
Hispanic
5.39 5.27 3.49 14.14
Other/Unsure
1.23 1.74 0.71 3.68
White
31.66 26.98 9.59 68.23
Total
42.71 41.52 15.77 100.00
Florida Crosstabs (Sep. 15-16, 2012) Monday September 17 13:58:18 2012 Page 7
Pearson chi2(
8
) =
59.7099
Pr =
0.000
likelihood-ratio chi2(
8
) =
57.0657
Pr =
0.000
-> tabulation of race by rickscottsperformanceasgovernor
Rick Scott's performance as
Governor?
Race? Negative Positive Unsure/Ot Total
Asian
1.29 0.88 1.29 3.46
Black
4.54 3.02 2.41 9.97
Hispanic
6.11 3.62 4.30 14.03
Other/Unsure
1.93 1.05 0.76 3.74
White
26.02 24.29 18.50 68.80
Total
39.89 32.85 27.26 100.00
Pearson chi2(
8
) =
26.5220
Pr =
0.001
likelihood-ratio chi2(
8
) =
26.4845
Pr =
0.001
-> tabulation of race by hypothetical2014rickscottorcharl
Hypothetical 2014: Rick Scott or
Charlie Crist?
Race? Crist Scott Unsure Total
Asian
1.97 0.82 0.66 3.44
Black
5.74 2.99 1.27 10.00
Hispanic
6.60 4.88 2.46 13.94
Other/Unsure
2.01 1.52 0.29 3.81
White
27.51 31.57 9.72 68.80
Total
43.83 41.78 14.39 100.00
Pearson chi2(
8
) =
54.5901
Pr =
0.000
likelihood-ratio chi2(
8
) =
55.9280
Pr =
0.000
-> tabulation of race by hypothetical2014rickscottorbuddy
Hypothetical 2014: Rick Scott or
Buddy Dyer?
Race? Dyer Scott Unsure Total
Asian
0.67 0.93 1.77 3.37
Black
4.77 2.99 2.36 10.12
Hispanic
4.51 5.15 4.13 13.79
Other/Unsure
1.52 1.48 0.89 3.88
White
17.88 31.13 19.82 68.83
Total
29.35 41.67 28.98 100.00
Pearson chi2(
8
) =
76.9050
Pr =
0.000
likelihood-ratio chi2(
8
) =
71.8263
Pr =
0.000
-> tabulation of race by iszimmermanguiltyinthedeathoftre
Florida Crosstabs (Sep. 15-16, 2012) Monday September 17 13:58:18 2012 Page 8
Is Zimmerman guilty in the death of Trevon
Martin?
Race? Guilty Not famil Not guilt Unsure Total
Asian
1.29 0.43 0.34 1.12 3.18
Black
5.84 0.30 2.41 1.55 10.10
Hispanic
5.41 1.63 2.92 4.08 14.05
Other/Unsure
1.38 0.17 0.82 1.59 3.95
White
19.42 2.88 22.82 23.59 68.72
Total
33.35 5.41 29.31 31.93 100.00
Pearson chi2(
12
) =
154.0695
Pr =
0.000
likelihood-ratio chi2(
12
) =
147.7452
Pr =
0.000
-> tabulation of religiousaffiliation by agegroup
Religious Age group?
affiliation? 18-29 30-39 40-49 50+ Total
Catholic
4.27 3.69 5.87 15.17 29.00
>
Jewish
0.25 0.54 0.62 2.82 4.24
>
Muslim
0.25 1.09 0.72 0.58 2.64
>
Other/Unsure
4.96 4.09 4.20 7.17 20.42
>
Protestant/Other Chri
6.70 7.64 7.93 21.43 43.70
>
Total
16.44 17.05 19.33 47.18 100.00
>
Pearson chi2(
12
) =
118.7435
Pr =
0.000
likelihood-ratio chi2(
12
) =
115.5057
Pr =
0.000
-> tabulation of religiousaffiliation by gender
Religious Gender?
affiliation? Female Male Total
Catholic
14.47 14.58 29.04
Jewish
2.94 1.31 4.25
Muslim
0.80 1.85 2.65
Other/Unsure
10.58 9.81 20.39
Protestant/Other Chri
23.05 20.61 43.66
Total
51.84 48.16 100.00
Pearson chi2(
4
) =
29.6952
Pr =
0.000
likelihood-ratio chi2(
4
) =
30.4346
Pr =
0.000
-> tabulation of religiousaffiliation by approveofobamasperformance
Religious Approve of Obama's performance?
affiliation? Approve Disapprov Other/Uns Total
Catholic
12.34 14.66 1.87 28.88
Jewish
2.13 1.80 0.37 4.30
Muslim
1.51 1.14 0.00 2.65
Other/Unsure
14.00 5.36 0.99 20.35
Protestant/Other Chri
15.21 26.19 2.42 43.83
Total
45.19 49.16 5.66 100.00
Florida Crosstabs (Sep. 15-16, 2012) Monday September 17 13:58:19 2012 Page 9
Pearson chi2(
8
) =
196.4872
Pr =
0.000
likelihood-ratio chi2(
8
) =
.
-> tabulation of religiousaffiliation by favorableorunfavorableopinionofr
Favorable or unfavorable opinion
Religious of Romney?
affiliation? Favorable Other/Uns Unfavorab Total
Catholic
13.73 2.60 12.76 29.09
Jewish
1.30 0.78 2.23 4.30
Muslim
1.08 0.48 1.11 2.67
Other/Unsure
3.97 2.67 13.62 20.26
Protestant/Other Chri
23.82 4.27 15.58 43.67
Total
43.90 10.80 45.31 100.00
Pearson chi2(
8
) =
210.3275
Pr =
0.000
likelihood-ratio chi2(
8
) =
220.7687
Pr =
0.000
-> tabulation of religiousaffiliation by obamabidenromneyryanorotherunsur
Obama/Biden, Romney/Ryan, or
Religious Other/Unsure?
affiliation? Obama/Bid Other/Uns Romney/Ry Total
Catholic
12.81 1.16 15.21 29.18
Jewish
2.40 0.19 1.76 4.36
Muslim
1.28 0.41 0.90 2.59
Other/Unsure
14.61 1.80 3.76 20.17
Protestant/Other Chri
15.96 1.73 26.02 43.71
Total
47.05 5.29 47.65 100.00
Pearson chi2(
8
) =
275.6725
Pr =
0.000
likelihood-ratio chi2(
8
) =
287.0788
Pr =
0.000
-> tabulation of religiousaffiliation by obamaromneyjohnsonotherunsure
Religious Obama, Romney, Johnson, Other/Unsure?
affiliation? Johnson Obama Other/Uns Romney Total
Catholic
0.72 12.51 1.18 14.76 29.17
>
Jewish
0.27 2.40 0.08 1.60 4.34
>
Muslim
0.49 1.33 0.00 0.80 2.62
>
Other/Unsure
1.07 13.92 1.37 3.80 20.16
>
Protestant/Other Chri
0.99 15.37 1.64 25.71 43.70
>
Total
3.54 45.53 4.26 46.67 100.00
>
Pearson chi2(
12
) =
302.0408
Pr =
0.000
likelihood-ratio chi2(
12
) =
.
-> tabulation of religiousaffiliation by usheadedintherightdirection
Florida Crosstabs (Sep. 15-16, 2012) Monday September 17 13:58:19 2012 Page 10
U.S. headed in the right
Religious direction?
affiliation? Right dir Unsure Wrong dir Total
Catholic
9.55 4.11 15.50 29.16
Jewish
1.80 0.73 1.84 4.37
Muslim
1.34 0.12 1.19 2.65
Other/Unsure
10.67 4.41 5.14 20.22
Protestant/Other Chri
12.74 3.88 26.98 43.59
Total
36.11 13.24 50.65 100.00
Pearson chi2(
8
) =
211.2073
Pr =
0.000
likelihood-ratio chi2(
8
) =
218.6218
Pr =
0.000
-> tabulation of religiousaffiliation by macknelsonother
Religious Mack, Nelson, Other?
affiliation? Mack Nelson Unsure/Ot Total
Catholic
13.95 10.22 4.99 29.16
Jewish
1.82 2.26 0.32 4.40
Muslim
0.71 1.03 0.99 2.73
Other/Unsure
3.29 13.35 3.53 20.17
Protestant/Other Chri
22.94 14.66 5.94 43.54
Total
42.71 41.52 15.77 100.00
Pearson chi2(
8
) =
247.3971
Pr =
0.000
likelihood-ratio chi2(
8
) =
258.3294
Pr =
0.000
-> tabulation of religiousaffiliation by rickscottsperformanceasgovernor
Rick Scott's performance as
Religious Governor?
affiliation? Negative Positive Unsure/Ot Total
Catholic
10.57 10.57 8.28 29.43
Jewish
2.41 0.92 1.13 4.46
Muslim
1.17 0.80 0.80 2.77
Other/Unsure
10.82 4.06 5.11 19.98
Protestant/Other Chri
14.92 16.49 11.94 43.35
Total
39.89 32.85 27.26 100.00
Pearson chi2(
8
) =
82.8649
Pr =
0.000
likelihood-ratio chi2(
8
) =
84.2989
Pr =
0.000
-> tabulation of religiousaffiliation by hypothetical2014rickscottorcharl
Hypothetical 2014: Rick Scott or
Religious Charlie Crist?
affiliation? Crist Scott Unsure Total
Catholic
11.64 13.69 3.73 29.07
Jewish
2.71 1.35 0.37 4.43
Muslim
1.64 0.86 0.16 2.67
Other/Unsure
12.46 3.73 3.94 20.13
Protestant/Other Chri
15.38 22.14 6.19 43.71
Total
43.83 41.78 14.39 100.00
Pearson chi2(
8
) =
178.3764
Pr =
0.000
likelihood-ratio chi2(
8
) =
190.5143
Pr =
0.000
-> tabulation of religiousaffiliation by hypothetical2014rickscottorbuddy
Florida Crosstabs (Sep. 15-16, 2012) Monday September 17 13:58:19 2012 Page 11
Hypothetical 2014: Rick Scott or
Religious Buddy Dyer?
affiliation? Dyer Scott Unsure Total
Catholic
7.97 13.45 7.84 29.27
Jewish
1.98 1.27 1.31 4.56
Muslim
1.01 0.84 0.84 2.70
Other/Unsure
8.10 3.63 8.06 19.78
Protestant/Other Chri
10.29 22.48 10.92 43.69
Total
29.35 41.67 28.98 100.00
Pearson chi2(
8
) =
167.2454
Pr =
0.000
likelihood-ratio chi2(
8
) =
177.9350
Pr =
0.000
-> tabulation of religiousaffiliation by iszimmermanguiltyinthedeathoftre
Is Zimmerman guilty in the death of Trevon
Religious Martin?
affiliation? Guilty Not famil Not guilt Unsure Total
Catholic
8.38 1.93 8.90 9.84 29.05
>
Jewish
2.06 0.17 0.99 1.42 4.64
>
Muslim
1.29 0.17 0.86 0.43 2.75
>
Other/Unsure
8.94 1.03 3.44 6.40 19.81
>
Protestant/Other Chri
12.68 2.11 15.13 13.84 43.75
>
Total
33.35 5.41 29.31 31.93 100.00
>
Pearson chi2(
12
) =
81.1152
Pr =
0.000
likelihood-ratio chi2(
12
) =
83.6850
Pr =
0.000
-> tabulation of agegroup by gender
Gender?
Age group? Female Male Total
18-29
9.16 7.09 16.25
30-39
8.25 8.87 17.12
40-49
9.92 9.49 19.41
50+
24.50 22.72 47.22
Total
51.84 48.16 100.00
Pearson chi2(
3
) =
6.3004
Pr =
0.098
likelihood-ratio chi2(
3
) =
6.3115
Pr =
0.097
-> tabulation of agegroup by approveofobamasperformance
Approve of Obama's performance?
Age group? Approve Disapprov Other/Uns Total
18-29
8.78 6.17 1.25 16.20
30-39
7.71 8.71 0.62 17.05
40-49
8.74 9.26 1.29 19.29
50+
19.95 25.02 2.50 47.47
Total
45.19 49.16 5.66 100.00
Florida Crosstabs (Sep. 15-16, 2012) Monday September 17 13:58:19 2012 Page 12
Pearson chi2(
6
) =
33.4040
Pr =
0.000
likelihood-ratio chi2(
6
) =
33.9321
Pr =
0.000
-> tabulation of agegroup by favorableorunfavorableopinionofr
Favorable or unfavorable opinion
of Romney?
Age group? Favorable Other/Uns Unfavorab Total
18-29
5.64 1.89 8.61 16.14
30-39
7.31 2.41 7.12 16.85
40-49
8.01 2.30 8.94 19.26
50+
22.93 4.19 20.63 47.76
Total
43.90 10.80 45.31 100.00
Pearson chi2(
6
) =
33.1090
Pr =
0.000
likelihood-ratio chi2(
6
) =
33.0923
Pr =
0.000
-> tabulation of agegroup by obamabidenromneyryanorotherunsur
Obama/Biden, Romney/Ryan, or
Other/Unsure?
Age group? Obama/Bid Other/Uns Romney/Ry Total
18-29
9.50 0.56 6.12 16.18
30-39
7.13 1.58 7.81 16.52
40-49
8.94 0.90 9.43 19.26
50+
21.48 2.25 24.30 48.03
Total
47.05 5.29 47.65 100.00
Pearson chi2(
6
) =
45.5402
Pr =
0.000
likelihood-ratio chi2(
6
) =
42.8232
Pr =
0.000
-> tabulation of agegroup by obamaromneyjohnsonotherunsure
Obama, Romney, Johnson, Other/Unsure?
Age group? Johnson Obama Other/Uns Romney Total
18-29
1.18 9.09 0.19 5.82 16.28
30-39
1.10 6.96 1.07 7.49 16.62
40-49
0.49 8.33 1.07 9.21 19.09
50+
0.76 21.15 1.94 24.15 48.00
Total
3.54 45.53 4.26 46.67 100.00
Pearson chi2(
9
) =
87.1777
Pr =
0.000
likelihood-ratio chi2(
9
) =
87.8704
Pr =
0.000
-> tabulation of agegroup by usheadedintherightdirection
U.S. headed in the right
direction?
Age group? Right dir Unsure Wrong dir Total
18-29
6.29 2.92 6.79 16.00
30-39
6.41 2.00 8.25 16.65
40-49
6.18 2.76 10.21 19.15
50+
17.23 5.56 25.40 48.20
Total
36.11 13.24 50.65 100.00
Pearson chi2(
6
) =
22.9589
Pr =
0.001
likelihood-ratio chi2(
6
) =
22.5830
Pr =
0.001
Florida Crosstabs (Sep. 15-16, 2012) Monday September 17 13:58:19 2012 Page 13
-> tabulation of agegroup by macknelsonother
Mack, Nelson, Other?
Age group? Mack Nelson Unsure/Ot Total
18-29
6.14 6.93 2.77 15.85
30-39
6.26 6.10 3.96 16.32
40-49
8.44 7.81 2.81 19.06
50+
21.87 20.68 6.22 48.77
Total
42.71 41.52 15.77 100.00
Pearson chi2(
6
) =
34.3978
Pr =
0.000
likelihood-ratio chi2(
6
) =
32.3187
Pr =
0.000
-> tabulation of agegroup by rickscottsperformanceasgovernor
Rick Scott's performance as
Governor?
Age group? Negative Positive Unsure/Ot Total
18-29
7.04 4.02 4.70 15.76
30-39
6.84 4.54 4.74 16.12
40-49
8.20 5.79 5.07 19.06
50+
17.81 18.50 12.75 49.06
Total
39.89 32.85 27.26 100.00
Pearson chi2(
6
) =
29.1314
Pr =
0.000
likelihood-ratio chi2(
6
) =
29.3917
Pr =
0.000
-> tabulation of agegroup by hypothetical2014rickscottorcharl
Hypothetical 2014: Rick Scott or
Charlie Crist?
Age group? Crist Scott Unsure Total
18-29
6.89 5.49 3.24 15.62
30-39
7.91 6.19 2.05 16.15
40-49
9.10 7.01 2.71 18.82
50+
19.93 23.08 6.40 49.41
Total
43.83 41.78 14.39 100.00
Pearson chi2(
6
) =
35.5117
Pr =
0.000
likelihood-ratio chi2(
6
) =
34.3333
Pr =
0.000
-> tabulation of agegroup by hypothetical2014rickscottorbuddy
Hypothetical 2014: Rick Scott or
Buddy Dyer?
Age group? Dyer Scott Unsure Total
18-29
5.82 5.23 4.22 15.27
30-39
5.15 5.86 5.02 16.03
40-49
5.86 7.30 5.65 18.81
50+
12.53 23.28 14.09 49.89
Total
29.35 41.67 28.98 100.00
Pearson chi2(
6
) =
34.6804
Pr =
0.000
likelihood-ratio chi2(
6
) =
34.3502
Pr =
0.000
-> tabulation of agegroup by iszimmermanguiltyinthedeathoftre
Florida Crosstabs (Sep. 15-16, 2012) Monday September 17 13:58:19 2012 Page 14
Is Zimmerman guilty in the death of Trevon
Martin?
Age group? Guilty Not famil Not guilt Unsure Total
18-29
6.62 1.03 3.44 4.21 15.30
30-39
5.07 1.25 5.41 3.87 15.60
40-49
6.57 0.56 5.11 6.66 18.91
50+
15.08 2.58 15.34 17.19 50.19
Total
33.35 5.41 29.31 31.93 100.00
Pearson chi2(
9
) =
47.4231
Pr =
0.000
likelihood-ratio chi2(
9
) =
47.7794
Pr =
0.000
-> tabulation of gender by approveofobamasperformance
Approve of Obama's performance?
Gender? Approve Disapprov Other/Uns Total
Female
25.64 22.34 3.67 51.65
Male
19.54 26.82 1.98 48.35
Total
45.19 49.16 5.66 100.00
Pearson chi2(
2
) =
44.3403
Pr =
0.000
likelihood-ratio chi2(
2
) =
44.5872
Pr =
0.000
-> tabulation of gender by favorableorunfavorableopinionofr
Favorable or unfavorable opinion
of Romney?
Gender? Favorable Other/Uns Unfavorab Total
Female
20.15 5.71 25.79 51.65
Male
23.75 5.08 19.52 48.35
Total
43.90 10.80 45.31 100.00
Pearson chi2(
2
) =
29.4311
Pr =
0.000
likelihood-ratio chi2(
2
) =
29.4832
Pr =
0.000
-> tabulation of gender by obamabidenromneyryanorotherunsur
Obama/Biden, Romney/Ryan, or
Other/Unsure?
Gender? Obama/Bid Other/Uns Romney/Ry Total
Female
27.83 1.39 22.49 51.71
Male
19.23 3.91 25.16 48.29
Total
47.05 5.29 47.65 100.00
Pearson chi2(
2
) =
74.6392
Pr =
0.000
likelihood-ratio chi2(
2
) =
76.1112
Pr =
0.000
-> tabulation of gender by obamaromneyjohnsonotherunsure
Obama, Romney, Johnson, Other/Unsure?
Gender? Johnson Obama Other/Uns Romney Total
Female
1.41 27.12 1.10 21.76 51.39
Male
2.13 18.41 3.16 24.91 48.61
Total
3.54 45.53 4.26 46.67 100.00
Florida Crosstabs (Sep. 15-16, 2012) Monday September 17 13:58:19 2012 Page 15
Pearson chi2(
3
) =
77.3750
Pr =
0.000
likelihood-ratio chi2(
3
) =
78.7342
Pr =
0.000
-> tabulation of gender by usheadedintherightdirection
U.S. headed in the right
direction?
Gender? Right dir Unsure Wrong dir Total
Female
20.18 8.25 22.72 51.15
Male
15.92 4.99 27.94 48.85
Total
36.11 13.24 50.65 100.00
Pearson chi2(
2
) =
46.6910
Pr =
0.000
likelihood-ratio chi2(
2
) =
46.9387
Pr =
0.000
-> tabulation of gender by macknelsonother
Mack, Nelson, Other?
Gender? Mack Nelson Unsure/Ot Total
Female
19.22 22.46 9.07 50.75
Male
23.49 19.06 6.70 49.25
Total
42.71 41.52 15.77 100.00
Pearson chi2(
2
) =
26.3564
Pr =
0.000
likelihood-ratio chi2(
2
) =
26.4111
Pr =
0.000
-> tabulation of gender by rickscottsperformanceasgovernor
Rick Scott's performance as
Governor?
Gender? Negative Positive Unsure/Ot Total
Female
20.35 14.84 15.52 50.70
Male
19.54 18.01 11.74 49.30
Total
39.89 32.85 27.26 100.00
Pearson chi2(
2
) =
20.5861
Pr =
0.000
likelihood-ratio chi2(
2
) =
20.6361
Pr =
0.000
-> tabulation of gender by hypothetical2014rickscottorcharl
Hypothetical 2014: Rick Scott or
Charlie Crist?
Gender? Crist Scott Unsure Total
Female
23.41 18.53 8.86 50.80
Male
20.42 23.25 5.54 49.20
Total
43.83 41.78 14.39 100.00
Pearson chi2(
2
) =
36.0413
Pr =
0.000
likelihood-ratio chi2(
2
) =
36.2332
Pr =
0.000
-> tabulation of gender by hypothetical2014rickscottorbuddy
Florida Crosstabs (Sep. 15-16, 2012) Monday September 17 13:58:19 2012 Page 16
Hypothetical 2014: Rick Scott or
Buddy Dyer?
Gender? Dyer Scott Unsure Total
Female
16.11 17.04 16.83 49.98
Male
13.24 24.63 12.15 50.02
Total
29.35 41.67 28.98 100.00
Pearson chi2(
2
) =
57.3713
Pr =
0.000
likelihood-ratio chi2(
2
) =
57.6446
Pr =
0.000
-> tabulation of gender by iszimmermanguiltyinthedeathoftre
Is Zimmerman guilty in the death of Trevon
Martin?
Gender? Guilty Not famil Not guilt Unsure Total
Female
20.07 3.05 11.00 16.03 50.15
Male
13.28 2.36 18.31 15.90 49.85
Total
33.35 5.41 29.31 31.93 100.00
Pearson chi2(
3
) =
76.5690
Pr =
0.000
likelihood-ratio chi2(
3
) =
77.2499
Pr =
0.000
-> tabulation of approveofobamasperformance by favorableorunfavorableopinionof
> r
Approve of Favorable or unfavorable opinion
Obama's of Romney?
performance? Favorable Other/Uns Unfavorab Total
Approve
3.08 3.86 37.88 44.82
Disapprove
39.52 5.05 5.01 49.57
Other/Unsure
1.30 1.89 2.41 5.60
Total
43.90 10.80 45.31 100.00
Pearson chi2(
4
) =
1.6e+03
Pr =
0.000
likelihood-ratio chi2(
4
) =
1.8e+03
Pr =
0.000
-> tabulation of approveofobamasperformance by obamabidenromneyryanorotherunsu
> r
Approve of Obama/Biden, Romney/Ryan, or
Obama's Other/Unsure?
performance? Obama/Bid Other/Uns Romney/Ry Total
Approve
43.11 0.71 0.86 44.69
Disapprove
1.61 2.97 45.21 49.79
Other/Unsure
2.33 1.61 1.58 5.52
Total
47.05 5.29 47.65 100.00
Pearson chi2(
4
) =
2.4e+03
Pr =
0.000
likelihood-ratio chi2(
4
) =
2.9e+03
Pr =
0.000
-> tabulation of approveofobamasperformance by obamaromneyjohnsonotherunsure