Báo cáo khoa học: TICL – a web tool for network-based interpretation of compound lists inferred by high-throughput metabolomics doc
Bạn đang xem bản rút gọn của tài liệu. Xem và tải ngay bản đầy đủ của tài liệu tại đây (1.09 MB, 11 trang )
TICL – a web tool for network-based interpretation of
compound lists inferred by high-throughput metabolomics
Alexey V. Antonov
1
, Sabine Dietmann
1
, Philip Wong
1
and Hans W. Mewes
1,2
1 Helmholtz Zentrum Mu
¨
nchen, Institute for Bioinformatics and Systems Biology, Neuherberg, Germany
2 Department of Genome-Oriented Bioinformatics, Technische Universita
¨
tMu
¨
nchen, Freising, Germany
Knowledge of the molecular basis of metabolism is
crucial for our understanding of most cellular pro-
cesses [1–3]. In recent years, technologies have been
developed that allow the systematic investigation of
large numbers of different metabolites [1,4–6]. This has
led to metabolomics becoming an attractive technology
for exploring the molecular basis of complex cell disor-
ders [7–10].
In most genomics and proteomics studies aimed at
deciphering the molecular mechanisms of complex bio-
logical phenomena, the output is usually a list of
genes ⁄ proteins [11–13]. The next common step is the
application of bioinformatics and statistical methods
to obtain a statistically valid interpretation of the
derived gene list. There are dozens of bioinformatics
tools available for the interpretation of gene lists. A
standard solution is the inference of over- ⁄ under-repre-
sented gene ontology terms [14–22]. The significance of
the produced results is usually supplied in the form of
a P-value. The P-value represents a probability of
inferring a similar or greater enrichment (for any gene
ontology term) for a randomly sampled gene list [19].
More complex methods have been proposed to
exploit the database information currently available
for metabolic and signaling pathways, such as the
Kyoto Encyclopedia of Genes and Genomes (KEGG)
[23] or BioCarta (). In this
case, pathway topology was taken into account by
developing specialized scoring functions. The method
developed by Rahnenfuhrer et al. [24] includes, in
Keywords
bioinformatics tools for high-throughput
metabolomics; metabolomics; statistical
analysis and data mining; statistical and
bioinformatics tools; web tools for
metabolomics
Correspondence
A. V. Antonov, Helmholtz Zentrum Mu
¨
nchen
– German Research Center for
Environmental Health (GmbH), Institute for
Bioinformatics and Systems Biology,
Ingolsta
¨
dter Landstraße 1, D-85764
Neuherberg, Germany
Fax: +49 89 3187 3585
Tel: +49 89 3187 2788
E-mail:
(Received 12 November 2008, revised 28
January 2009, accepted 2 February 2009)
doi:10.1111/j.1742-4658.2009.06943.x
High-throughput metabolomics is a dynamically developing technology
that enables the mass separation of complex mixtures at very high resolu-
tion. Metabolic profiling has begun to be widely used in clinical research to
study the molecular mechanisms of complex cell disorders. Similar to trans-
criptomics, which is capable of detecting genes at differential states, meta-
bolomics is able to deliver a list of compounds differentially present
between explored cell physiological conditions. The bioinformatics chal-
lenge lies in a statistically valid interpretation of the functional context for
identified sets of metabolites. Here, we present TICL, a web tool for the
automatic interpretation of lists of compounds. The major advance of
TICL is that it not only provides a model of possible compound transfor-
mations related to the input list, but also implements a robust statistical
framework to estimate the significance of the inferred model. The TICL
web tool is freely accessible at />cmp.
Abbreviations
KEGG, Kyoto Encyclopedia of Genes and Genomes; SHR, spontaneously hypertensive rat; WKY, Wistar Kyoto rat.
2084 FEBS Journal 276 (2009) 2084–2094 ª 2009 Helmholtz Zentrum Mu
¨
nchen – German Research Center for Environmental Health (GmbH). Journal compilation ª 2009 FEBS
addition, the distance between genes within the meta-
bolic pathway. The impact of a pair of genes is
weighted with respect to the distance between genes
within the metabolic pathway. Another procedure
(impact analysis) proposed recently by Draghici et al.
[25,26] goes beyond gene pairs and fully captures the
topology of signaling pathways by propagating
the perturbations measured at gene levels through the
entire pathway. This technique can capture informa-
tion about the position of the genes on the pathway,
because perturbation of the genes at the top of the sig-
naling cascade will propagate through the entire path-
way, unlike perturbation of the downstream genes.
Metabolomics is a relatively new ‘omics’ technology.
Experimental studies of complex cell disorders, which
employ high-throughput metabolomics as a basic
instrument, have just started to appear. Several studies
of different diseases have demonstrated the successful
application of metabolomics in clinical research [7–9].
There is no doubt that the number of such clinical
studies will grow exponentially in the near future.
Similar to transcriptomics and proteomics, meta-
bolomics allows for the detection of a list of markers,
present at different concentrations under various
explored cell physiological conditions. In the case of
metabolomics, the markers are compounds (not genes
or gene products). There is a great demand for bioin-
formatics to provide a statistically valid interpretation
of compound lists produced experimentally. Currently,
several bioinformatics approaches are available for
metabolomics. Each approach was developed to solve
different practical problems related to the analysis of
metabolomics data [5,27–30]. Most of the proposed
tools for metabolomics deal with the mass peak anno-
tation problem [31]. The MassTrix web server has
recently been presented [30] and provides the possibil-
ity of uploading a high-precision mass spectrum, auto-
matically annotating mass peaks and mapping
identified compounds onto KEGG metabolic path-
ways. Most of the available tools aim to interpret the
whole mass spectra rather than a sparse list of com-
pounds differentially present between samples. Other
tools are available that provide visualizations of a
compound list in the context of metabolic networks
[32,33]. The KEGG atlas accepts a list of compounds
as an input. The output of the KEGG atlas is a graph-
ical visualization of compounds in the context of the
global metabolic reaction network. The KEGG atlas,
however, does not provide quantitative and statistical
analyses.
It is important to know whether experimentally
selected compounds are related, for example, whether
they belong to a chain or network of metabolic reac-
tions. A partial answer to this question can be
obtained from the KEGG atlas. However, without
quantitative analysis, there are no clues about the
quality of these relations. To fill the gap, we propose
an analytical framework for the interpretation of
molecular mechanisms that unite a list of compounds.
This analytical framework is implemented as the freely
accessible web tool TICL. As we demonstrate using
data from recently published metabolomics studies,
TICL translates compounds into a set of linked meta-
bolic reactions and provides quantitative estimates of
the significance of the inferred models.
Results
We consider several recently published experimental
studies that report lists of compounds found to be dif-
ferentially present under diverse physiological condi-
tions. We demonstrate that the proposed statistical
framework can be helpful in understanding the biologi-
cal context of the reported compound lists. We start
with the study by Lu et al. [9], which reports metabolic
variation related to hypertension and age-related
conditions. To characterize the development of hyper-
tension, the spontaneously hypertensive rat (SHR),
and its normotensive control, the Wistar Kyoto
(WKY) rat, were investigated, and their blood plasma
was analyzed using GC ⁄ time-of-flight MS. In total,
187 peaks were quantitatively determined after decon-
volution, and 78 of them were identified. Plasma com-
positional differences for many identified compounds
showed significant age-related variations for both SHR
and WKY. Also, many identified compounds showed
significant variations between hypertension-related
SHR and control WKY rats.
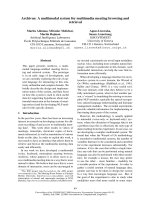
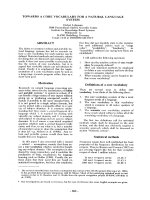
Table 2 in Lu et al. [9] reports 20 compounds that
show significantly increased or decreased levels from 10
to 18 weeks of age in both SHR and WKY rats. In
total, 16 compounds can be mapped to the global com-
pound network inferred from the KEGG. Submission
of this list to the KEGG atlas gives the graphical visu-
alization presented in Fig. 1. At first glance, these com-
pounds have nothing in common; they do not represent
any specific canonical metabolic pathway. In this case,
visual analyses of Fig. 1 cannot give a clear answer as
to whether and how the compounds are related. By
contrast, submission of this list to the TICL gives
quantitative values that describe the quality of the rela-
tions between the input compounds and provides a
confidence score for such relations in the form of a
P-value (the probability that randomly generated com-
pound lists are involved in relations of similar quality).
The report for the analyzed list is given in Table 1.
A. V. Antonov et al. TICL – a tool for interpretation of compound lists
FEBS Journal 276 (2009) 2084–2094 ª 2009 Helmholtz Zentrum Mu
¨
nchen – German Research Center for Environmental Health (GmbH). Journal compilation ª 2009 FEBS 2085
Fig. 1. Output returned by the KEGG atlas after submission of 20 compounds that have significantly increased or decreased levels from 10
to 18 weeks of age in both SHR and WKY rats. Red points correspond to submitted compounds.
TICL – a tool for interpretation of compound lists A. V. Antonov et al.
2086 FEBS Journal 276 (2009) 2084–2094 ª 2009 Helmholtz Zentrum Mu
¨
nchen – German Research Center for Environmental Health (GmbH). Journal compilation ª 2009 FEBS
From Table 1 we can see the dependency between
the numbers of input compounds, which are involved
in the network model, and the number of allowed
missing compounds between any two input compounds
to be considered connected. For example, we can
deduce that only two compounds (model 1) from the
input list are related as substrate and product of the
same reaction. If one missing compound is allowed, a
maximum of four compounds from the input list are
connected into a network (model 2). For example,
model D
5
, which allows up to four intermediate com-
pounds, covers 11 metabolites. For each model, the
P-value was estimated using a Monte Carlo procedure.
For the most significant model D
5
, the estimated
P-value was < 0.01. This means that when we ran-
domly sampled a list of 16 compounds 100 times (only
compounds from the global compound network were
used to sample a random list) and applied the network
inference procedure to the random list, there was no
case, whereas the size of the inferred model D
5
from a
random list is 11. In all these cases, it was less. Thus,
the P-value suggests that these 11 compounds repre-
sent a statistically valid metabolic network model.
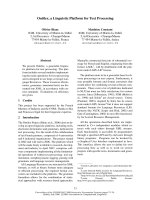
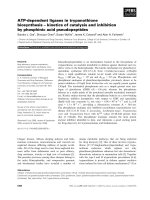
TICL provides a number of online visualization capa-
bilities. The user can also download a preformatted
text file and use the medusa package [34] to visualize
the inferred model on a computer. Figure 2 illustrates
a typical visualization output (model D
5
).
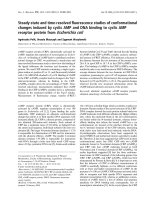
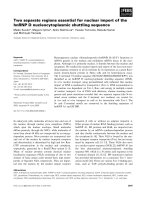
Table 3, in Lu et al. [9], reports 22 compounds
whose levels were significantly different between SHR
and WKY rats. In total, 14 compounds can be
mapped to the global compound network inferred
from the KEGG. Submission of this list to the KEGG
atlas gives the graphical visualization presented in
Fig. 3. Again, visualization of these compounds on the
global metabolic network is not sufficient to obtain a
full understanding of the quality of the relations
among the compounds. The report for the analyzed list
is presented in Table 2.
From Table 2, we can see that the second set of
compounds with significantly different levels between
hypertensive (SHR) and control (WKY) rats does not
define a statistically robust transformation network.
For example, model D
6
, which allows up to five miss-
ing compounds between any two compounds from the
input list, covers only eight input metabolites. The
statistical significance of the inferred models (for all
models D
1
, , D
6
) was insignificant (the most signifi-
cant model, D
5
, covers seven compounds, P > 0.1).
The identified compounds are related to each other,
although no more so than randomly selected com-
pounds. Thus, in the first case (age-related differences),
TICL provides statistically valid arguments that the
identified metabolites represent a set of dependent
compounds. Most probably, the identified compounds
reflect structural, age-related changes in metabolism, in
which whole metabolic blocks function differently. In
the second case (differences between SHR and WKY
rats), however, no indication of structural metabolic
variations can be found. We admit that the result
might have been influenced by the incomplete informa-
tion currently available for metabolic reactions.
Another reason might be that the identified markers
do not necessarily reflect structural metabolic varia-
tions, because there might be more complex mecha-
nisms, not directly related to metabolism, which
actually unite these compounds.
The next example considered is related to a clinical
study [7]. In this study, a set of 66 invasive ovarian
carcinomas and 9 borderline tumors of the ovary were
analyzed by GC ⁄ time-of-flight MS. After automated
mass spectral deconvolution, 291 metabolites were
detected, of which 114 (39.1%) were annotated as
known compounds. Using a t-test, 51 metabolites were
identified to be significantly (P < 0.01) different
between borderline tumors and carcinomas. Table 1, in
Denkert et al. [7], reports 26 significantly different
metabolites which are known, 21 of which are mapped
to the global metabolic network. The standard output
Table 2. The quantitative report ‘Enriched subnetworks’ returned
by TICL after the submission of 22 compounds with significantly
different levels between SHR and WKY rats.
Model
Maximum distance
between compounds
No. input compounds
in the subnetwork P-value
1 1 1 < 0.99
2 2 1 < 0.99
3 3 1 < 0.99
4 4 4 < 0.24
5 5 7 < 0.13
6 6 8 < 0.18
Table 1. The quantitative report ‘Enriched subnetworks’ returned
by TICL after the submission of 20 compounds with significantly
increased or decreased levels from 10 to 18 weeks of age in both
SHR and WKY rats.
Model
Maximum distance
between compounds
No. input compounds
in the subnetwork P-value
1 1 2 < 0.125
2 2 4 < 0.015
3 3 5 < 0.05
4 4 7 < 0.06
5 5 11 < 0.01
6 6 12 < 0.015
A. V. Antonov et al. TICL – a tool for interpretation of compound lists
FEBS Journal 276 (2009) 2084–2094 ª 2009 Helmholtz Zentrum Mu
¨
nchen – German Research Center for Environmental Health (GmbH). Journal compilation ª 2009 FEBS 2087
report from TICL for these compounds is given in
Table 3.
If we consider the metabolite pathway membership,
then only ‘Nitrogen metabolism’ is presented in the list
more then twice. Nevertheless, from Table 3 we can
see that almost all of the identified known metabolites
are dependent. For example, model D
2
, which allows
only one missing metabolite, covers eight compounds
from the input list. Model D
3
, which allows only two
missing metabolites, covers 15 input compounds and
model D
4
covers almost all (19 of 21) metabolites.
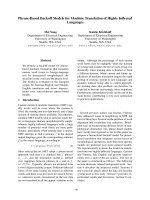
Figure 4 illustrates a typical visualization output for
model D
4
.
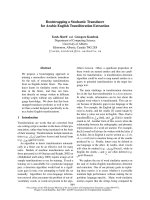
The last example we consider is related to another
clinical cancer study. In this case, the target was colon
carcinoma. A set of paired samples of normal colon
and colorectal cancer tissue was investigated by
GC ⁄ time-of-flight MS, which allowed robust detection
of a total of 206 metabolites. Subsequent analysis
revealed that 82 metabolites were significantly
different. Table 4 presents TICL output for these 82
compounds. We can see that almost all of the identi-
fied known metabolites are dependent. For example,
model D
2
, which allows only one missing metabolite,
covers 37 compounds from the input list. Model D
3
,
which allows only two missing metabolites, covers 49
input compounds. Figure 5 illustrates a typical visuali-
zation output produced using TICL for model D
3
.
In both cancer-related examples, TICL provides
statistically valid arguments that the identified meta-
bolites represent a set of dependent compounds.
Although the analyzed cases were related to different
tissues (ovarian cancer and colon cancer), in both
cases, the discovered metabolic markers were not inde-
pendent; they define a related set of metabolic reac-
tions which, in turn, define a semi-noninterrupted
Fig. 2. Visualization of the inferred network
model D
5
returned by TICL after submission
of 20 compounds that have significantly
increased or decreased levels from 10 to
18 weeks of age in both SHR and WKY rats.
Boxes are compounds from the input list,
circles are intermediate compounds. Colors
are used to specify canonical KEGG meta-
bolic pathways.
Table 3. The quantitative report ‘Enriched subnetworks’ returned
by TICL on submission of 21 known compounds found to have sig-
nificantly different concentrations between borderline ovarian
tumors and ovarian carcinomas.
Model
Maximum distance
between compounds
No. input compounds
in the subnetwork P-value
1 1 3 < 0.045
2 2 8 < 0.01
3 3 15 < 0.01
4 4 19 < 0.01
5 5 19 < 0.01
6 6 19 < 0.01
TICL – a tool for interpretation of compound lists A. V. Antonov et al.
2088 FEBS Journal 276 (2009) 2084–2094 ª 2009 Helmholtz Zentrum Mu
¨
nchen – German Research Center for Environmental Health (GmbH). Journal compilation ª 2009 FEBS
Fig. 3. The output returned by KEGG atlas after submission of 22 compounds that have levels significantly different between SHR and WKY
rats. Red points correspond to the submitted compounds.
A. V. Antonov et al. TICL – a tool for interpretation of compound lists
FEBS Journal 276 (2009) 2084–2094 ª 2009 Helmholtz Zentrum Mu
¨
nchen – German Research Center for Environmental Health (GmbH). Journal compilation ª 2009 FEBS 2089
network of metabolic transformations that covers most
of the identified compounds. Thus, in these two cases,
TICL provides new biological insights into variations
in metabolic processes in cancer and presents statistical
arguments validating these insights.
Discussion
In addition to the ability to generate a large amount
of data per experiment, high-throughput technologies
also brought the challenge of translating such data
into a better understanding of the underlying biologi-
cal phenomena. A number of tools in the field of
transcriptomics and proteomics have been developed
recently to interpret gene ⁄ protein lists in order to
address this challenge. High-throughput metabolomics
has recently started to be instrumental in exploring
metabolic variations on a genomic scale [7–10,35,36].
The output produced by experimental metabolomics is
similar to other ‘omics’ technologies in the sense that
Fig. 4. Visualization of the inferred network model D
4
returned by TICL after submission of 21 compounds found to have significantly
different concentrations in borderline ovarian tumors and carcinomas. Boxes are compounds from the input list, circles are intermediate
compounds. Colors are used to specify canonical KEGG metabolic pathways.
Table 4. The quantitative report ‘Enriched subnetworks’ returned
by TICL on submission of 82 known compounds found to have
significantly different concentrations between normal colon tissue
and colorectal cancer tissue.
Model
Maximum distance
between compounds
No. input compounds
in the subnetwork P-value
1 1 9 < 0.01
2 2 37 < 0.01
3 3 49 < 0.01
4 4 57 < 0.01
5 5 61 < 0.01
6 6 63 < 0.01
TICL – a tool for interpretation of compound lists A. V. Antonov et al.
2090 FEBS Journal 276 (2009) 2084–2094 ª 2009 Helmholtz Zentrum Mu
¨
nchen – German Research Center for Environmental Health (GmbH). Journal compilation ª 2009 FEBS
it provides a list. The difference is that it is not a
gene ⁄ protein list, but a list of compounds, whose con-
centration differs between the considered cell (tissue)
phenotypes.
The bioinformatics tools and procedures currently
available in the field of metabolomics are more rele-
vant for the annotation of mass peaks or for the inter-
pretation of whole mass peaks spectra. To our
knowledge, there is currently no procedure or tool
available that deals with a relatively sparse compound
list found to be differentially present between different
cell physiological conditions. As demonstrated here,
such lists can be translated into network models, which
cover most metabolites from the supplied list. How-
ever, the sparseness of the compound list presumes
that the inferred models may have a lot of intermedi-
ate compounds (up to 2–5 intermediate compounds
between any two compounds from the input list cov-
ered by the model). In this case, tools that offer only a
visualization of compounds in the context of the global
metabolic network are inefficient. It is evident that if
relaxing the number of possible missing compounds,
sooner or later, one will be able to cover all input
compounds. It is essential to provide a model of the
possible metabolic transformations that cover the input
compound list, and also to estimate quantitatively the
Fig. 5. Visualization of the inferred network model D
3
returned by TICL after submission of 82 compounds found to have significantly differ-
ent concentrations in normal colon tissue and colorectal cancer tissue. Boxes are compounds from the input list, circles are intermediate
compounds. Colors are used to specify canonical KEGG metabolic pathways.
A. V. Antonov et al. TICL – a tool for interpretation of compound lists
FEBS Journal 276 (2009) 2084–2094 ª 2009 Helmholtz Zentrum Mu
¨
nchen – German Research Center for Environmental Health (GmbH). Journal compilation ª 2009 FEBS 2091
quality of the produced model. TICL is the first tool
for the analysis of compound lists that implements
such quality control by providing P-values for the
inferred models.
Materials and methods
Given a compound list found to be differentially present
between biological samples, we translate this list into a
network model. In other words, we reconstruct the most
probable transformation routes that unite compounds from
the list. In some sense, this task is similar to the problem of
finding the shortest path between two compounds, but is
extended to list of compounds [27,37]. To restore the trans-
formation routes, we use a global metabolic network
inferred from the KEGG database. The major advance of
TICL is that it not only provides a model of possible com-
pound transformations related to the input list, but also
implements a robust statistical framework to estimate the
significance of the inferred model. In simple terms, the
P-values inferred by Monte Carlo simulations [17,38,39]
represent the probability of a random list having the same
quality model.
Global compound network
The KEGG REACTION database is a collection of chemi-
cal structure transformation patterns for substrate–product
pairs (reactant pairs). We can build a global ‘reaction
network’ (reactions are nodes, compounds are edges) by con-
necting edges and reactions that share the same compounds.
In general, a reaction consists of multiple reactant pairs, and
the one that appears in a KEGG metabolic pathway is called
a main pair. To build a global reaction network, we used
only compounds classified as main reaction pairs.
Network inference procedure
At the start of the procedure, we have a list of compounds
(the input list), on the one hand, and the global compound
network, on the other hand. The distance between two
arbitrary compounds is computed as the minimum number
of consecutive steps required to get from one compound to
another by working through existing paths on the global
compound network. Distance 1 means that the two com-
pounds are directly connected (related as substrate and
product of a metabolic reaction); distance 2 means that the
two compounds are connected via one intermediate com-
pound; distance 3 means that the two compounds are con-
nected via two intermediate compounds, and so on. Given
a compound list, our purpose is to infer the network model
(connect some pairs from the input list to get connected
component) that minimizes the distance between each
connected pair of compounds.
Initially, we map compounds from the input list onto the
global compounds network. At this point, all compounds
from the input list are disconnected. In the first step, all
pairs of compounds with distance 1 are connected by edges
and we look for connected subnetworks. The subnetwork
with the maximal number of compounds is referred to as
an inferred network model D
1
. In the second step, com-
pounds (from the input list) with distance 2 are connected
by edges. The subnetwork with the maximal number of
compounds is inferred and referred to as network model
D
2
. In a similar way, network models D
3
,D
4
, up to a spec-
ified number z (model D
z
) are inferred. Models D
2
,D
3,
,
D
z
incorporate compounds that are not from the input list
but are added to connect input compounds in the network
model. We refer to these added compounds as intermediate
or missing compounds.
Statistical treatment
Let us assume that we have an input compound list of
size N and using the network inference procedure described
above we infer the network models D
1
, ,D
z
, which allow
0, 1, . , z - 1 intermediate compounds to be added to the
model. Let us denote S
1
,S
2
, , S
z
to be the number of
input compounds in the inferred network models. We also
refer to S
1
,S
2
, ,S
z
as the sizes of the respective models
D
1
, , D
z
. Given the size of the input compound list (N),
we consider the sizes of the models (values S
1
,S
2
, , S
z
)to
be quality measures. We have to estimate the probability of
inferring models of the same or larger sizes from randomly
generated compound lists of size N.
To estimate the significance of the inferred models, we
compare the values S
1
,S
2
, , S
z
with background distribu-
tions BD
1
, , BD
z
computed using Monte Carlo simulation
[39]. To generate the background distributions BD
1
, ,
BD
z
, we repeat the following simulation procedure k times,
where k specifies the upper significance level. A random
gene list L
j
of size N (equal to the size of the input list) is
generated by sampling compounds from global compound
network. Index j=1 k specifies each of the k random
simulations. The network inference procedure described
above is applied to the random list L
j
and the network
models D
1
, ,D
z
are inferred. Let us denote the size (the
number of input compounds) of the inferred models D
1
, ,
D
z
for the random list L
j
as R
1j,
, R
zj
. Thus, after repeat-
ing the simulation procedure k times, we get the background
distribution R
1j
(j =1 k) for models D
1
, the background
distribution R
2j
(j = 1 k) for models D
2
, and the back-
ground distribution R
zj
(j = 1 k) for models D
z
.
To estimate significance of the inferred network model
D
1
for the input gene list, the value S
1
is compared with
the distribution R
1j
. Let n be the number of values from
the distribution R
1j
that are ‡ S
1
. The estimate of P of the
inferred network model D
1
is computed as P =(n+1) ⁄ k.
TICL – a tool for interpretation of compound lists A. V. Antonov et al.
2092 FEBS Journal 276 (2009) 2084–2094 ª 2009 Helmholtz Zentrum Mu
¨
nchen – German Research Center for Environmental Health (GmbH). Journal compilation ª 2009 FEBS
In the same way, the P-values for models D
2
, ,D
z
are
computed using values S
2
, ,S
z
and background distribu-
tions R
2j
, R
zj
. In other words, the P-value is estimated
as the share of random simulations where the size of the
inferred models for random compound lists of size N are
equal to or greater than the size S
1
,S
2
, ,S
z
of the
inferred models for input compound list (size N).
References
1 Fiehn O (2001) Combining genomics, metabolome
analysis, and biochemical modelling to understand
metabolic networks. Comp Funct Genomics 2, 155–168.
2 Goodacre R (2005) Metabolomics shows the way to
new discoveries. Genome Biol 6, 354.
3 Hertkorn N, Ruecker C, Meringer M, Gugisch R,
Frommberger M, Perdue EM, Witt M & Schmitt-
Kopplin P (2007) High-precision frequency measurements:
indispensable tools at the core of the molecular-level
analysis of complex systems. Anal Bioanal Chem 389,
1311–1327.
4 Fiehn O (2008) Extending the breadth of metabolite
profiling by gas chromatography coupled to mass spec-
trometry. Trends Anal Chem 27, 261–269.
5 Shulaev V (2006) Metabolomics technology and bioin-
formatics. Brief Bioinform 7, 128–139.
6 Shulaev V & Oliver DJ (2006) Metabolic and proteomic
markers for oxidative stress. New tools for reactive
oxygen species research. Plant Physiol 141, 367–
372.
7 Denkert C, Budczies J, Kind T, Weichert W, Tablack
P, Sehouli J, Niesporek S, Konsgen D, Dietel M &
Fiehn O (2006) Mass spectrometry-based metabolic
profiling reveals different metabolite patterns in invasive
ovarian carcinomas and ovarian borderline tumors.
Cancer Res 66, 10795–10804.
8 Denkert C, Budczies J, Weichert W, Wohlgemuth G,
Scholz M, Kind T, Niesporek S, Noske A, Buckendahl
A, Dietel M et al. (2008) Metabolite profiling of human
colon carcinoma – deregulation of TCA cycle and
amino acid turnover. Mol Cancer 7, 72.
9 Lu Y, Jiye A, Wang G, Hao H, Huang Q, Yan B, Zha
W, Gu S, Ren H, Zhang Y et al. (2008) Gas
chromatography ⁄ time-of-flight mass spectrometry based
metabonomic approach to differentiating hypertension-
and age-related metabolic variation in spontaneously
hypertensive rats. Rapid Comm Mass Spectrom 22,
2882–2888.
10 Altmaier E, Ramsay SL, Graber A, Mewes HW, Wein-
berger KM & Suhre K (2008) Bioinformatics analysis
of targeted metabolomics – uncovering old and new
tales of diabetic mice under medication. Endocrinology
149, 3478–3489.
11 Shi Q, Bao S, Song L, Wu Q, Bigner DD, Hjelmeland
AB & Rich JN (2007) Targeting SPARC expression
decreases glioma cellular survival and invasion associ-
ated with reduced activities of FAK and ILK kinases.
Oncogene 26, 4084–4094.
12 Marquez RT, Baggerly KA, Patterson AP, Liu J,
Broaddus R, Frumovitz M, Atkinson EN, Smith DI,
Hartmann L, Fishman D et al. (2005) Patterns of gene
expression in different histotypes of epithelial ovarian
cancer correlate with those in normal fallopian tube,
endometrium, and colon. Clin Cancer Res 11, 6116–
6126.
13 LaTulippe E, Satagopan J, Smith A, Scher H, Scardino
P, Reuter V & Gerald WL (2002) Comprehensive gene
expression analysis of prostate cancer reveals distinct
transcriptional programs associated with metastatic dis-
ease. Cancer Res 62, 4499–4506.
14 Adler P, Reimand J, Janes J, Kolde R, Peterson H
& Vilo J (2008) KEGGanim: pathway animations
for high-throughput data. Bioinformatics 24, 588–590.
15 Antonov AV & Mewes HW (2006) Complex functional-
ity of gene groups identified from high-throughput data.
J Mol Biol 363, 289–296.
16 Antonov AV, Schmidt T, Wang Y & Mewes HW
(2008) ProfCom: a web tool for profiling the complex
functionality of gene groups identified from high-
throughput data. Nucleic Acids Res 36, W347–W351,
doi:10.1093/nar/gkn239.
17 Antonov AV & Mewes HW (2008) Complex phyloge-
netic profiling reveals fundamental genotype–phenotype
associations. Comput Biol Chem 32, 412–416.
18 Khatri P, Draghici S, Ostermeier GC & Krawetz SA
(2002) Profiling gene expression using onto-express.
Genomics 79, 266–270.
19 Khatri P & Draghici S (2005) Ontological analysis of
gene expression data: current tools, limitations, and
open problems. Bioinformatics 21, 3587–3595.
20 Khatri P, Voichita C, Kattan K, Ansari N, Khatri A,
Georgescu C, Tarca AL & Draghici S (2007) Onto-
Tools: new additions and improvements in 2006.
Nucleic Acids Res 35, W206–W211.
21 Reimand J, Kull M, Peterson H, Hansen J & Vilo J
(2007) g:Profiler – a web-based toolset for functional
profiling of gene lists from large-scale experiments.
Nucleic Acids Res 35, W193–W200.
22 Reimand J, Tooming L, Peterson H, Adler P & Vilo J
(2008) GraphWeb: mining heterogeneous biological net-
works for gene modules with functional significance.
Nucleic Acids Res 36, W452–W459, doi:10.1093/nar/
gkn230.
23 Ogata H, Goto S, Sato K, Fujibuchi W, Bono H &
Kanehisa M (1999) KEGG: Kyoto encyclopedia of
genes and genomes. Nucleic Acids Res 27, 29–34.
24 Rahnenfuhrer J, Domingues FS, Maydt J & Lengauer
T (2004) Calculating the statistical significance of
changes in pathway activity from gene expression data.
Stat Appl Genet Mol Biol 3, Article 16.
A. V. Antonov et al. TICL – a tool for interpretation of compound lists
FEBS Journal 276 (2009) 2084–2094 ª 2009 Helmholtz Zentrum Mu
¨
nchen – German Research Center for Environmental Health (GmbH). Journal compilation ª 2009 FEBS 2093
25 Draghici S, Khatri P, Tarca AL, Amin K, Done A,
Voichita C, Georgescu C & Romero R (2007) A
systems biology approach for pathway level analysis.
Genome Res 17, 1537–1545.
26 Tarca AL, Draghici S, Khatri P, Hassan SS, Mittal P,
Kim JS, Kim CJ, Kusanovic JP & Romero R (2008)
A novel signaling pathway impact analysis (SPIA).
Bioinformatics 25, 75–82.
27 Blum T & Kohlbacher O (2008) MetaRoute: fast search
for relevant metabolic routes for interactive network
navigation and visualization. Bioinformatics 24, 2108–
2109.
28 Handorf T & Ebenhoh O (2007) MetaPath Online: a
web server implementation of the network expansion
algorithm. Nucleic Acids Res 35, W613–W618.
29 Jourdan F, Breitling R, Barrett MP & Gilbert D
(2008) MetaNetter: inference and visualization of high-
resolution metabolomic networks. Bioinformatics 24 ,
143–145.
30 Suhre K & Schmitt-Kopplin P (2008) MassTRIX:
mass translator into pathways. Nucleic Acids Res 36,
W481–W484.
31 Breitling R, Pitt AR & Barrett MP (2006) Precision
mapping of the metabolome. Trends Biotechnol 24,
543–548.
32 Letunic I, Yamada T, Kanehisa M & Bork P (2008)
iPath: interactive exploration of biochemical pathways
and networks. Trends Biochem Sci 33, 101–103.
33 Okuda S, Yamada T, Hamajima M, Itoh M, Katayama
T, Bork P, Goto S & Kanehisa M (2008) KEGG atlas
mapping for global analysis of metabolic pathways.
Nucleic Acids Res 36, W423–W426.
34 Hooper SD & Bork P (2005) Medusa: a simple tool for
interaction graph analysis. Bioinformatics 21 , 4432–4433.
35 Law WS, Huang PY, Ong ES, Ong CN, Li SF,
Pasikanti KK & Chan EC (2008) Metabonomics
investigation of human urine after ingestion of green
tea with gas chromatography ⁄ mass spectrometry, liquid
chromatography ⁄ mass spectrometry and (1)H NMR
spectroscopy. Rapid Comm Mass Spectrom 22, 2436–
2446.
36 Meyer RC, Steinfath M, Lisec J, Becher M, Witucka-
Wall H, Torjek O, Fiehn O, Eckardt A, Willmitzer L,
Selbig J et al. (2007) The metabolic signature related to
high plant growth rate in Arabidopsis thaliana. Proc
Natl Acad Sci USA 104, 4759–4764.
37 Blum T & Kohlbacher O (2008) Using atom mapping
rules for an improved detection of relevant routes in
weighted metabolic networks. J Comput Biol 15,
565–576.
38 Berriz GF, King OD, Bryant B, Sander C & Roth FP
(2003) Characterizing gene sets with FuncAssociate.
Bioinformatics 19, 2502–2504.
39 Westfall PN & Young SS (1993) Resampling-Based
Multiple Testing: Examples and Methods for p-Value
Adjustment. Wiley, New York, NY.
TICL – a tool for interpretation of compound lists A. V. Antonov et al.
2094 FEBS Journal 276 (2009) 2084–2094 ª 2009 Helmholtz Zentrum Mu
¨
nchen – German Research Center for Environmental Health (GmbH). Journal compilation ª 2009 FEBS