Báo cáo khoa học: Construction of a novel detection system for protein–protein interactions using yeast G-protein signaling pdf
Bạn đang xem bản rút gọn của tài liệu. Xem và tải ngay bản đầy đủ của tài liệu tại đây (438.48 KB, 9 trang )
Construction of a novel detection system for
protein–protein interactions using yeast G-protein
signaling
Nobuo Fukuda
1
, Jun Ishii
2
, Tsutomu Tanaka
2
, Hideki Fukuda
2
and Akihiko Kondo
1
1 Department of Chemical Science and Engineering, Graduate School of Engineering, Kobe University, Japan
2 Organization of Advanced Science and Technology, Kobe University, Japan
Protein–protein interactions are essential for normal
cellular function, and numerous studies have provided
important insight into the molecular mechanisms
underlying these interactions. In particular, develop-
ment and use of the yeast two-hybrid (Y2H) system
has greatly facilitated the study of protein–protein
interactions. In order to exhaustively identify protein
interaction pairs, including membrane-associated pro-
teins, the SOS and Ras recruitment systems (SRS or
RRS) using the Ras-signaling pathway in yeast cells as
the readout have proven to be successful [1,2]. Mem-
brane-associated proteins, which constitute approxi-
mately 40% of the total cellular proteins, include
many important drug receptors, channels and enzymes
[3]. In the SRS and RRS systems, temperature-sensi-
tive mutant strains are required for detection of pro-
tein–protein interactions. If the proteins physically
interact, the Ras-signaling pathway is activated, allow-
Keywords
G-protein signaling; membrane localization
of Gc subunit; protein–protein interaction;
yeast two-hybrid system
Correspondence
A. Kondo, Department of Chemical Science
and Engineering, Graduate School of
Engineering, Kobe University, 1-1
Rokkodaicho, Nada-ku, Kobe 657-8501,
Japan
Fax ⁄ Tel: +81 78 803 6196
E-mail:
(Received 18 December 2008, revised 18
February 2009, accepted 3 March 2009)
doi:10.1111/j.1742-4658.2009.06991.x
In the current study, we report the construction of a novel system for the
detection of protein–protein interactions using yeast G-protein signaling. It
is well established that the G-protein c subunit (Gc) is anchored to the
inner leaflet of the plasma membrane via lipid modification in the C-termi-
nus, and that this localization of Gc is required for signal transduction. In
our system, mutated Gc (Gc
cyto
) lacking membrane localization ability was
genetically prepared by deletion of the lipid modification site. Complete
disappearance of G-protein signal was observed when Gc
cyto
was expressed
in the cytoplasm of yeast cells from which the endogenous Gc gene had
been deleted. In order to demonstrate the potential use of our system, we
utilized the Staphylococcus aureus ZZ domain and the Fc portion of human
immunoglobulin G (IgG) as a model interaction pair. To design our detec-
tion system for protein–protein interaction, the ZZ domain was altered so
that it associates with the inner leaflet of the plasma membrane, and the Fc
part was then fused to Gc
cyto
. The Fc–Gc
cyto
fusion protein migrated
towards the membrane via the ZZ–Fc interaction, and signal transduction
was therefore restored. This signal was successfully detected by assessing
growth inhibition and transcription in response to G-protein signaling.
Finally, several Z variants displaying affinity constants ranging from
8.0 · 10
3
to 6.8 · 10
8
m
)1
were prepared, and it was demonstrated that our
system was able to discriminate subtle differences in affinity. In conclusion,
our system appears to be a reliable and versatile technique for detection of
protein–protein interactions, and may prove useful in future protein inter-
action studies.
Abbreviations
EGFP, enhanced green fluorescent protein; RRS, Ras recruitment system; SRS, Sos recruitment system; Z
I31A
, single-site mutant of the Z
domain by altering isoleucine at position 31 to alanine; Z
K35A
, single-site mutant of the Z domain by altering the lysine at position 35 to
alanine; Z
WT
, wild-type Z domain derived from the B domain of Staphylococcus aureus protein A.
2636 FEBS Journal 276 (2009) 2636–2644 ª 2009 The Authors Journal compilation ª 2009 FEBS
ing yeast cells to grow at 37 °C. Although this system
is advantageous for analysis of membrane-associated
proteins, the yeast growth rate using this system is
slow given that the optimal temperature for yeast repli-
cation is 30 °C.
To establish a system that allows rapid identification
of protein–protein interactions, we focused on the
yeast G-protein signaling pathway. The yeast G-pro-
tein signaling pathway is a well characterized pathway
that is activated via pheromone stimulation. Phero-
mone stimulation leads to activation of heterotrimeric
G-proteins comprising Gpa1 (Ga), Ste4 (Gb) and
Ste18 (Gc) through the G-protein-coupled receptor
(Fig. 1A). The activated G-protein subsequently disso-
ciates into Ga and Gbc complex subunits, and the
Gbc complex induces activation of the mitogen-acti-
vated protein kinase cascade. The amplified signal
results in various cellular responses, including global
changes in transcription, growth arrest in the G
1
phase, and polarized morphogenesis for mating. One
significant advantage of using G-protein signaling for
the detection of protein–protein interactions is that the
assays are undertaken at 30 °C and thus yeast cells are
able to rapidly grow at their preferred temperature.
Several methods of detection of protein–protein
interactions have been developed using G-protein sig-
naling. Medici et al. established the Gpa1–Gas chime-
ric system in which a receptor is fused to protein X
and Gpa1–Gas is fused to protein Y, restoring G-pro-
tein signaling in response to the protein X–protein Y
interaction [4]. Subsequently, Ehrhard et al. reported
the use of a Gbc interfering system, in which the inter-
action between protein X fused to Gc with the integral
membrane protein Y disturbed contact of Gb with its
effectors and thus inhibited G-protein signaling [3].
These assays can be undertaken at 30 °C and are
therefore suitable for rapid yeast growth, unlike the
SRS and RRS methods, which required temperature-
sensitive mutant strains. Furthermore, these systems
can be applied to the study of biologically important
membrane-bound proteins. Unfortunately, however,
previously reported systems using G-protein signaling
resulted in high background signals, making it difficult
to distinguish between subtle differences in affinity,
and have therefore been considered unfavorable for
extensive screening processes.
In the current study, we established a technique for
the successful identification of protein–protein interac-
tions using yeast G-protein signaling. We previously
utilized the G-protein-coupled receptor assay system,
which involves growth inhibition following G
1
arrest
and transcription of the enhanced green fluorescent
protein (EGFP) reporter gene to detect protein–protein
interactions [5]. Signal transduction defects resulting
from dissociation of the Gc subunit from the mem-
brane require localization of the Gbc complex to the
plasma membrane through the lipidated Gc subunit
[6], and our method to detect protein–protein interac-
tions is based on this finding. The sequence encoding
target protein ‘binder X’ is genetically fused to a Gc
gene from which the lipidation sites (Gc
cyto
) have been
deleted. The gene encoding the binder X–Gc
cyto
fusion
protein replaces the STE18 gene, which encodes intact
Gc. Then the lipidation motif is genetically introduced
to ‘binder Y’ and co-expressed with the binder X–Gc-
cyto
protein. Binder X–Gc
cyto
protein is expressed in
the cytosol and the lipidated binder Y protein is local-
ized to the plasma membrane. As a result, signal trans-
duction did not occur. When binder X and binder Y
interact with each other, the binder X–Gc
cyto
fusion
protein becomes localized to the plasma membrane
and thus activates G-protein signaling (Fig. 1C). In
this study, we selected the Fc portion of human IgG
and the ZZ domain derived from Staphylococ-
cus aureus protein A as the model interaction pair
(Fig. 2), and demonstrated protein–protein interactions
using growth inhibition and transcription assays. Use
C
Pheromone
A
Receptor
B
EGFP gene transcription
Signal transduction
Signal transduction
Growth arrest
(growth inhibition assay)
(transcription assay)
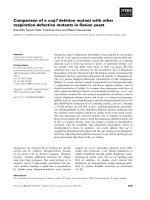
Fig. 1. Schematic outline of the experimental design. (A) The wild-
type Gc subunit induces pheromone-stimulated signaling. (B) Engi-
neered Gc lacking membrane-localization ability (Gc
cyto
) leads to a
significant defect in G-protein signaling. As a result, the Gb and
Gc
cyto
(Gbc
cyto
) complex is released into the cytosol following
dissociation from Ga due to ablation of plasma membrane associa-
tions. (C) Protein–protein interaction re-establishes pheromone-
stimulated signaling. Interaction between protein X fused to Gc
cyto
and protein Y anchored to the plasma membrane results in migra-
tion of Gbc
cyto
to the inner leaflet of the plasma membrane. In our
system, a transcription assay using the EGFP reporter gene fused
to the pheromone-inducible FIG1 gene allows positive selection. A
growth inhibition assay based on cell-cycle arrest permits negative
selection. The conditions used for this system are suitable for yeast
cell growth (30 °C).
N. Fukuda et al. Detection system for protein–protein interactions
FEBS Journal 276 (2009) 2636–2644 ª 2009 The Authors Journal compilation ª 2009 FEBS 2637
of this assay system also resulted in very low back-
ground signal.
Results and Discussion
General strategy
The aim of this study was to establish a rapid and reli-
able method for the detection of protein–protein inter-
actions using yeast G-protein signaling. In our system,
protein–protein interactions were detected utilizing the
knowledge that the Gc subunit localizes to the inner
leaflet of the plasma membrane and that this localiza-
tion is required for G-protein signaling (Fig. 1). For-
mation of Gc mutants by deletion of their lipidation
sites completely interrupts G-protein signaling [6], thus
we expected that our system would permit a more
accurate determination of protein–protein interactions.
We chose the Fc portion of human IgG and the ZZ
domain derived from protein A [7–9], and an STE18
gene encoding the yeast Gc subunit in which the lipi-
dation sites had been mutated (Gc
cyto
), as the key
components of our system. The Fc was genetically
fused to the C-terminus of Gc
cyto
(Gc
cyto
–Fc) and the
lipidation motif was genetically added to the C-termi-
nus of the ZZ domain (ZZ
mem
). Gc
cyto
–Fc and ZZ
mem
were then co-expressed a yeast strain lacking endoge-
nous STE18. Interaction between Fc and ZZ
mem
would
then result in localization of Gc
cyto
to the plasma
membrane, and signal transduction in response to
pheromone stimulation will occur (Fig. 1C).
Construction of a yeast strain lacking
endogenous Gc
In order to prepare a host strain that would accept the
mutated Gc (Gc
cyto
), which would in turn result in its
altered localization to the membrane and therefore
cause a strong defective signal (Fig. 1B), we con-
structed an endogenous Gc-defective strain termed
BWG2118 by deletion of the STE18 gene. BWG2118
was derived from the MC-F1 yeast strain that induces
expression of the EGFP reporter gene in response to
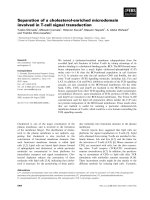
G-protein signaling (Table 1). To confirm STE18 gene
deletion in BWG2118, pheromone-dependent growth
inhibition (halo) and transcription assays were carried
out. For growth inhibition assays, cells were plated
and then exposed to synthetic pheromone spotted onto
filter disks. MC-F1, in which endogenous Gc is intact,
produced a clear halo in response to G-protein signal-
ing, but BWG2118, in which endogenous Gc is defec-
tive, did not exhibit a clear halo due to loss of
signaling ability (Fig. 3A). For transcription assays,
expression of the EGFP reporter gene under the con-
trol of the pheromone-inducible FIG1 promoter was
analyzed by flow cytometry. MC-F1 exhibited high flu-
orescence as a result of signaling, but BWG2118 did
not show EGFP reporter fluorescence even after the
addition of pheromone (Fig. 3B). The fluorescence
intensity for BWG2118 appeared similar to that for
strain BY4741, which was the original BWG2118
strain and does not encode the EGFP reporter gene
(data not shown). These results demonstrate that
G-protein signaling was interrupted due to the absence
of the STE18 gene, and that a yeast strain BWG2118,
lacking endogenous Gc, had been successfully
constructed.
Co-expression of ZZ
mem
and Gc
cyto
–Fc proteins in
an endogenous Gc-defective yeast strain
To demonstrate detection of protein–protein interac-
tions using mutated Gc, we used the ZZ domain and
the Fc portion as the model pair in this system. The
lipidation-defective Gc mutant (Gc
cyto
) was con-
structed by deleting five amino acids from the C-termi-
nus, and then fusing Gc
cyto
with Fc (Fig. 2A).
Alternatively, the ZZ domain, which demonstrates
high specific affinity for Fc, was genetically fused
to the lipidation motif sequence of yeast Gc at the
Table 1. Yeast strains used in this study.
Strain Genotype Reference
BY4741 MATa his3D1 ura3D0 leu2D0 met15D0 [11]
MC-F1 BY4741 P
fig1
-FIG1-EGFP Ishii et al., (unpublished results)
BWG2118 MC-F1 ste18D::kanMX4 Present study
BZG2118 MC-F1 ste18D::kanMX4-P
PGK
-ZZ
mem
Present study
BFG2118 BWG2118 his3D::URA3-P
ste18
-Gc
cyto
-Fc Present study
BZFG2118 MC-F1 ste18D::kanMX4-P
PGK
-ZZ
mem
his3D::URA3-P
ste18
-Gc
cyto
-Fc Present study
BFG2Z18-WT MC-F1 ste18D::kanMX4-P
PGK
-Z
WT, mem
his3D::URA3-P
ste18
-Gc
cyto
-Fc Present study
BFG2Z18-K35A MC-F1 ste18D::kanMX4-P
PGK
-Z
K35A, mem
his3D::URA3-P
ste18
-Gc
cyto
-Fc Present study
BFG2Z18-I31A MC-F1 ste18D::kanMX4-P
PGK
-Z
I31A, mem
his3D::URA3-P
ste18
-Gc
cyto
-Fc Present study
Detection system for protein–protein interactions N. Fukuda et al.
2638 FEBS Journal 276 (2009) 2636–2644 ª 2009 The Authors Journal compilation ª 2009 FEBS
C-terminus (ZZ
mem
; ZZ-SNSVCCTLM-COOH;
Fig. 2A) [6]. The strains in which ZZ
mem
and the
Gc
cyto
–Fc fusion genes were integrated into BWG2118
were termed BZG2118 (ZZ
mem
), BFG2118 (Gc
cyto
–Fc)
and BZFG2118 (ZZ
mem
⁄ Gc
cyto
–Fc) (Table 1). Expres-
sion of ZZ
mem
proteins in BZG2118 (lane 2) and
BZFG2118 (lane 4), or of Gc
cyto
–Fc fusion proteins in
BFG2118 (lane 3) and BZFG2118 (lane 4) was con-
firmed by Western blot analysis using anti-protein A
or anti-human IgG (Fig. 4A).
Migration of mutated Gc to the plasma
membrane by protein–protein interaction
restores signal transduction in an endogenous
Gc-defective yeast strain
To test our hypothesis that the mutated Gc (Gc
cyto
)
migrates to the plasma membrane and restores signal
transduction via protein–protein interaction, we inves-
tigated whether the endogenous Gc-defective yeast
strain expressing the ZZ
mem
protein or the Gc
cyto
–Fc
fusion protein induced signal transduction in growth
inhibition assays. In order to achieve this, cells were
plated and then exposed to synthetic pheromone spot-
ted onto filter disks (Fig. 4B). The endogenous
Gc-defective yeast strain (BWG2118) and the cells
expressing ZZ
mem
or Gc
cyto
–Fc (BZG2118 or
BFG2118) did not show halo formation even after
pheromone stimulation (Fig. 4B, panels 1–3). How-
ever, the yeast strain BZFG2118, which expresses
both ZZ
mem
and Gc
cyto
–Fc, did show a clear halo in
response to pheromone induction, demonstrating that
co-expression of ZZ
mem
and Gc
cyto
–Fc was able to
restore signal transduction (Fig. 4B, panel 4). We also
prepared a yeast strain expressing ZZ without the
lipidation motif in place of ZZ
mem
(termed
BFG2118 ⁄ ZZ), which co-expressed Gc
cyto
–Fc and ZZ
without the lipidation motif, as a negative control
strain. As ZZ and Fc are known to interact in the
cytosol [9], the BFG2118 ⁄ ZZ strain did not exhibit
cell-cycle arrest in the halo assay (data not shown).
In addition, as a positive control, yeast cells express-
ing the lipidation motif attached to Gc
cyto
–Fc
(Gc
cyto
–Fc
mem
) formed a clear halo in response to
pheromone induction, as expected (data not shown).
These results demonstrate that the mutated Gc
(Gc
cyto
) strain utilized in this study had completely
lost its membrane associations; however, recruitment
of Gc
cyto
to the membrane following interaction with
ZZ and Fc recovered G-protein signaling. These
results suggest that interactions between membrane
proteins or cytoplasmic proteins modified to contain
membrane lipidation motifs and cytoplasmic proteins
may be detected using our system. As the growth
inhibition assay based on cell-cycle arrest allowed for
negative selection, our system may also be success-
fully used in high-throughput screening of signal-
defective mutants to determine the specific amino
acids required for protein–protein interactions.
Evaluation of the affinity constant via
transcription assays using the EGFP fluorescence
reporter gene
To corroborate the results of the growth inhibition
assay, we performed reporter transcription assays. As
shown in Fig. 4C, co-expression of ZZ
mem
and Gc
cyto
–
Fc (BZFG2118) resulted in remarkably high fluores-
cence following transcriptional activation of the EGFP
reporter gene. The fluorescence intensity was equiva-
lent to that of the MC-F1 positive control strain
shown in Fig. 3B. In contrast, BFG2118, which
expressed Gc
cyto
–Fc without ZZ
mem
, did not show
reporter expression, and the fluorescence intensity was
equivalent to that of the negative control strain
BWG2118 (Fig. 3B). These results demonstrate that
our system resulted in very low background signal and
therefore confers a significantly high signal-to-noise
(S ⁄ N) ratio in the detection of protein–protein inter-
actions. Detection of interactions in the absence of
A
BC
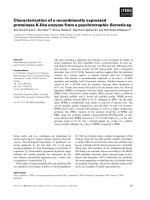
Fig. 2. Schematic outline of gene construction. (A) Structural fea-
tures of the yeast endogenous Gc gene (STE18), and design of the
Gc–Fc fusion gene excluding the lipidation motif (Gc
cyto
–Fc) and the
lipidation motif attached to the ZZ gene (ZZ
mem
). (B) Plasmid map
for integration of the ZZ
mem
gene into the yeast chromosome. (C)
Plasmid map for integration of the Gc
cyto
–Fc gene into the yeast
chromosome.
N. Fukuda et al. Detection system for protein–protein interactions
FEBS Journal 276 (2009) 2636–2644 ª 2009 The Authors Journal compilation ª 2009 FEBS 2639
background signal generation was also shown for the
growth inhibition assay (Fig. 4B). Transcription assays
using the EGFP reporter allow the quantitative assess-
ment of changes in G-protein signaling and high-
throughput selection of positive interaction pairs by
flow cytometric screening [5].
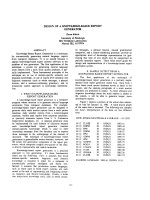
Numerous previous studies have reported detection
of protein–protein interactions; however, few methods
have allowed evaluation of affinity constant. To assess
the correlation between the affinity constant and the
fluorescence intensity, we prepared several partners for
Fc (Z
WT
, 5.9 · 10
7
m
)1
;Z
K35A
, 4.6 · 10
6
m
)1
;Z
I31A
,
8.0 · 10
3
m
)1
) instead of ZZ (6.8 · 10
8
m
)1
) [10]
(where Z
WT
is the wild-type Z domain derived from
the B domain of Staphylococcus aureus protein A,
Z
K35A
is a single-site mutant of the Z domain by alter-
ing the lysine at position 35 to alanine, and Z
I31A
is a
single-site mutant of the Z domain by altering isoleu-
cine at position 31 to alanine), and introduced them
into yeast chromosomes (BFG2Z18-WT, BFG2Z18-
K35A and BFG2Z18-I31A, as shown in Table 1).
Expression of ZZ
mem
and the ZZ
mem
variants was
confirmed by Western blot analysis (Fig. 5A), and
reporter transcription assays were performed for each
strain (Fig. 5B). The fluorescence intensities of the
strains were obviously altered according to the affinity
constants of the Fc partners. It was notable that the
relatively faint interaction between Fc and Z
I31A
,
whose affinity constant was 8.0 · 10
3
m
)1
, could be
successfully detected. Furthermore, we identified a log-
arithmic proportional relationship between fluores-
cence intensity and affinity constant (Fig. 5C). Such
accurate quantitative capability may be helpful for
discrimination of doubtful interaction candidates using
our system.
(kDa)
14
1
A
B
C
a
b
c
2 3 4
14.3
36.9
(ZZ
mem
)
(Gγ
cyto
-Fc)
42.0
(β-actin)
3 4 3 4
1 2
3 4
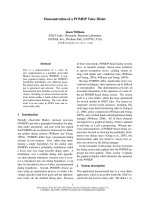
Fig. 4. Restoration of signal transduction following interaction
between ZZ
mem
and Gc
cyto
–Fc. (A) Western blot analyses were per-
formed using the following primary antibodies: (a) anti-protein A for
the ZZ domain, (b) anti-IgG for Fc, and (c) anti-b-actin as the loading
control. (B) Halo bioassays were performed with 10 ng of synthetic
a-factor pheromone spotted onto filter disks. (C) Transcription
assays were performed using flow cytometric EGFP fluorescence
analysis. The histogram plots show the analytical data for 10 000
cells. ‘1’ indicates BWG2118 (negative control strain), ‘2’ indicates
BZG2118 (the constructed strain expressing ZZ
mem
), ‘3’ indicates
BFG2118 (the constructed strain expressing Gc
cyto
–Fc), and ‘4’ indi-
cates BZFG2118 (the constructed strain expressing both ZZ
mem
and Gc
cyto
–Fc).
A
B
Fig. 3. Confirmation of signal response in the endogenous
Gc-defective yeast strain. (A) Halo bioassays were performed with
10 ng of synthetic a-factor pheromone spotted onto filter disks. (B)
Transcription assays were performed by flow cytometric EGFP fluo-
rescence analysis. The histogram plots show the analytical data for
10 000 cells. ‘1’ indicates BWG2118 (the constructed ste18D
strain), and ‘2’ indicates MC-F1 (the STE18-intact strain).
Detection system for protein–protein interactions N. Fukuda et al.
2640 FEBS Journal 276 (2009) 2636–2644 ª 2009 The Authors Journal compilation ª 2009 FEBS
In conclusion, we have established a novel detection
system based on G-protein signaling for detection of
protein–protein interactions, using a mutated Gc that
lacks membrane-localization ability. Our assay can be
performed under conditions suitable for maximal yeast
cell growth, and the effects can be assessed in terms of
transcription (positive selection) and growth inhibition
assays (negative selection). In addition, our system is a
reliable, quantitative technique that largely avoids
background signals. As a result, we were able to evalu-
ate a wide range of affinity constants from 8.0 · 10
3
to
6.8 · 10
8
m
)1
. We suggest that our system can be uti-
lized as a reliable and versatile system for detection of
protein–protein interactions using G-protein signaling.
Experimental procedures
Strains and media
Details of Saccharomyces cerevisiae BY4741 [11], MC-F1
(J. Ishii, M. Moriguchi, S. Matsumura, K. Tatematsu,
S. Kuroda, T. Tanaka, T. Fujiwara, H. Fukuda &
A. Kondo, unpublished results) and other constructed
strains used in this study and their genotypes are given in
Table 1. MC-F1 derived from BY4741 was engineered to
express the EGFP fusion gene in response to a-factor pher-
omone induction using the pheromone-inducible FIG1 gene.
The yeast strains were grown in YPD medium containing
1% w ⁄ v yeast extract, 2% peptone and 2% glucose, or in
SD medium without uracil (SD-Ura) containing 0.67%
yeast nitrogen base without amino acids (Becton Dickinson
and Company, Franklin Lakes, NJ, USA), 2% glucose,
20 mgÆL
)1
histidine, 30 mgÆL
)1
leucine and 30 mgÆL
)1
methionine. Agar (2% w ⁄ v) was added to the media
described above to produce YPD and SD-Ura agar.
Construction of plasmids for yeast chromosome
substitution
Plasmids used for deletion of STE18 gene by substitution
of the kanMX4 gene (G418 resistance gene) on the yeast
chromosome were constructed by amplifying the fragment
encoding the upstream region of STE18 (STE18p, STE18
promoter region) from MC-F1 genomic DNA using prim-
ers 1 and 2 (Table 2). This fragment was then inserted into
the XhoI site of pGK426 (J. Ishii, K. Izawa, S. Matsumura,
K. Wakamura, T. Tanino, T. Tanaka, C. Ogino,
H. Fukuda & A. Kondo, unpublished results), yielding
plasmid pGK426-GP. The fragment encoding the down-
stream region of STE18 (STE18t, STE18 terminator
region) was amplified from MC-F1 genomic DNA using
primers 3 and 4 (Table 2), and inserted into the BamHI–
EcoRI sites of pGK426-GP yielding plasmid pGK426-GPT.
The fragment containing kanMX4 was amplified from
pUG6 (EUROSCARF, Frankfurt, Germany) [12] using
primers 5 and 6 (Table 2), and inserted into the XhoI–SalI
site of pGK426-GPT yielding plasmid pGK426-GPTK.
The plasmid used for integration of the ZZ domain fused
to the lipidation motif gene (ZZ
mem
) at the STE18 locus of
the yeast chromosome was constructed by amplifying the
fragment encoding the ZZ domain from pMWIZ1 [13]
Fluorescence intensity
1
2
3
4
5
1
10
100
1000
Fluorescence intensity
10
3
10
5
10
7
10
9
Affinity constant [
M
–1
]
2
3
4
5
(kDa)
14.3
8.1
36.9
42.0
(ZZ
mem
)
(β-actin)
(Z
mem
)
(Gγ
cyto
-Fc)
1A
B
C
a
b
c
2345
Fig. 5. Quantitative analysis of the signal responses and interaction
strength. (A) Western blot analyses were performed using the fol-
lowing primary antibodies: (a) anti-protein A for the ZZ domain, (b)
anti-IgG for Fc, and (c) anti-b-actin as the loading control. (B) Flow
cytometric EGFP fluorescence analysis. (C) Logarithmic plots of flu-
orescence intensity against the affinity constants. ‘1’ indicates
BFG2118 (negative control strain), ‘2’ indicates BFG2Z18-I31A (the
constructed strain expressing Z
I31A
), ‘3’ indicates BFG2Z18-K35A
(the constructed strain expressing Z
K35A
), ‘4’ indicates BFG2Z18-
WT (the constructed strain expressing Z
WT
), and ‘5’ indicates
BZFG2118 (the strain expressing ZZ
mem
). Standard errors of three
independent experiments are presented.
N. Fukuda et al. Detection system for protein–protein interactions
FEBS Journal 276 (2009) 2636–2644 ª 2009 The Authors Journal compilation ª 2009 FEBS 2641
using primers 7 and 8 (Table 2), and inserting it into the
SalI–BamHI site of pGK426, yielding plasmid pUMZZ.
The fragment encoding the PGK1 promoter (PGK5¢), the
ZZ
mem
gene and the PGK1 terminator (PGK3¢) was ampli-
fied from pUMZZ using primers 9 and 10 (Table 2), and
inserted into the XhoI site of pGK426-GPTK, yielding plas-
mid pUMGPT-ZZK (Fig. 2).
The plasmid used for integration of the Gc
cyto
–Fc gene
at the HIS3 locus of the yeast chromosome was constructed
by amplifying the fragment encoding STE18p and Gc delet-
ing the lipidation sites (Gc
cyto
) from MC-F1 genomic DNA
using primers 11 and 12 (Table 2), and inserted into the
XhoI–BamHI sites of pGK426, yielding plasmid pUMGP-
GcM. The fragment encoding Fc was amplified from
pUF318-Fc [14] using primers 13 and 14 (Table 2), and
inserted into the BamHI–EcoRI site of pUMGP-GcM,
yielding plasmid pUMGP-GcMFc. A fragment encoding
the HIS3 terminator region (HIS3t) was amplified from
MC-F1 genomic DNA using primers 15 and 16 (Table 2),
and inserted into the NotI–SacI sites of pUMGP-GcMFc,
yielding plasmid pUMGP-GcMFcH (Fig. 2).
The plasmid used for integration of the Z
mem
gene at the
STE18 locus of the yeast chromosome was constructed by
amplifying the fragment encoding the Z domain from
pMWIZ1 using primers 17 and 18 (Table 2), and inserted
into the SalI–BamHI sites of pGK426 yielding plasmid
pUMZ-WT. To prepare single amino acid-substituted Z
variants, the following plasmids were constructed from
pUMZ-WT using the Quick-Change method (Stratagene,
La Jolla, CA, USA). For Z
K35A
and Z
I31A
, plasmids
pUMZ-K35A and pUMZ-I31A were constructed using
primers 19 and 20 and primers 21 and 22, respectively. The
fragment encoding PGK5¢, the Z
mem
genes (wild-type,
K35A and I31A) and PGK3¢ were amplified from pUMZ-
WT, pUMZ-K35A and pUMZ-I31A, respectively, using
primers 23 and 24 (Table 2), and inserted into the XhoI site
of pGK426-GPTK, yielding plasmids pUMGPT-ZK-WT,
pUMGPT-ZK-K35A and pUMGPT-ZK-I31A.
Construction of yeast strains
The strains used in this study are described in Table 1. The
genes were introduced into yeast cells using the lithium
acetate method [15].
Substitution of the STE18 gene by kanMX4 in the yeast
chromosome was achieved by amplifying the DNA frag-
ment containing STE18p–kanMX4–STE18t from pGK426-
GPTK using primers 25 and 26 (Table 2). The amplified
DNA fragment was then used to transform MC-F1, and
the transformant was selected on YPD solid medium
containing 500 ngÆ mL
)1
G418 (geneteccin; Nacalai Tesque
Inc., Kyoto, Japan) to yield the BWG2118 strain.
Integration of the ZZ
mem
gene was achieved by
amplifying a DNA fragment containing STE18p–PGK5¢–
ZZmem–PGK3¢–kanMX4–STE18t from pUMGPT-ZZK
using primers 25 and 26 (Table 2). The amplified DNA
fragment was used to transform MC-F1, and the transfor-
mant was selected on YPD solid medium containing
500 ngÆmL
)1
G418 to yield the BZG2118 strain.
Integration of the GcM–Fc gene was achieved by
amplifying a DNA fragment containing URA3–STE18p–
GcM–Fc–PGK3¢–HIS3t from pUMGP-GcMFcH using
primers with 50-nucleotide 5¢ segments that were homolo-
gous to the region directly upstream of the HIS3 gene
(primers 27 and 28; Table 2). The amplified DNA frag-
ment was then used to transform BWG2118 and
BZG2118, and the transformants were selected on SD-Ura
solid medium, yielding the BFG2118 and BZFG2118
strains, respectively.
Table 2. Primers used for construction of plasmids and yeast
strains.
Primer number Sequence (5¢-to3¢)
1 GCCCGTCGACATATTATATATATATATAGG
2 CCCGCTCGAGTCTTAGAATTATTGAGAACG
3 GCCCGGATCCTGATAGTAATAGAATCCAAA
4 CCCCGAATTCAAATTATAGAAAGCAGTAGA
5 AAGGCTCGAGAGATCTGTTTAGCTTGCCTC
6 AAAAGTCGACGAGCTCGTTTTCGACACTGG
7 TTTTGTCGACATGGCGCAACACGATGAAGC
CGTAGACAAC
8 GGGGGGATCCTTACATAAGCGTACAACAAA
CACTATTTGATTTCGGCGCCTGAGCATCA
TTTAGCTTTTT
9 TTTTCTCGAGAAAGATGCCGATTTGGGCGC
10 GGGGCTCGAGGTTTTATATTTGTTGTAAAA
11 GCCCCTCGAGATATTATATATATATATAGG
12 TAAAGGATCCCTTGTCATCGTCATCCTTGT
AGTCAACACTATTTGAGTTTGACATTTGGC
13 GAGAGAATTCGGGGGACCGTCAGTCTTCCT
CTTCCCCC
14 TTCCGAATTCTCATTTACCCGGAGACAGGG
15 CCCCGCGGCCGCTGACACCGATTATTTAAA
16 TTTTGAGCTCGGAGCCATAATGACAGCAGT
17 TTTTGTCGACATGGCGCAACACGATGAAGC
CGTAGACAAC
18 GGGGGGATCCTTACATAAGCGTACAACAAA
CACTATTTGATTTCGGCGCCTGAGCATCA
TTTAGCTTTTT
19 ATCCAAAGTTTAGCCGATGACCCAAGCCAA
20 TTGGCTTGGGTCATCGGCTAAACTTTGGAT
21 AAACGCCTTCGCCCAAAGTTTAAAAGATGA
22 TCATCTTTTAAACTTTGGGCGAAGGCGTTT
23 TTTTCTCGAGAAAGATGCCGATTTGGGCGC
24 GGGGCTCGAGGTTTTATATTTGTTGTAAAA
25 ATATTATATATATATATAGGGTCGTATATA
26 AAATTATAGAAAGCAGTAGA TAAAACAATG
27 CTTCGAAGAATATACTAAAAAATGAGCAGG
CAAGATAAACGAAGGCAAAGTTCAATTCA
TCATTTTTTTTTTATTCTTTT
28 GGAGCCATAATGACAGCAGT
Detection system for protein–protein interactions N. Fukuda et al.
2642 FEBS Journal 276 (2009) 2636–2644 ª 2009 The Authors Journal compilation ª 2009 FEBS
Construction of yeast strains containing Z
mem
genes
rather than the ZZ
mem
gene were achieved using a process
similar to construction of the BZG2118 strain, with the
exception that the plasmids pUMGPT-ZK-WT, pUMGPT-
ZK-K35A or pUMGPT-ZK-I31A were used instead of
pUMGPT-ZZK. In addition, integration of the Gc
cyto
–Fc
gene into these transformants was achieved as shown in
Fig. 2C, yielding BFG2Z18-WT, BFG2Z18-K35A and
BFG2Z18-I31A strains.
Halo bioassay to test growth arrest via the
pheromone response
An agar diffusion bioassay (halo assay) was undertaken to
measure the response to and recovery from pheromone-
induced cell-cycle arrest as described previously [16]. The
yeast strains were grown in YPD medium at 30 °C over-
night. Sterilized paper filter disks (6 mm in diameter) were
placed on the dishes, and 10 ng of a-factor pheromone was
spotted onto the disks. The cells were then inoculated into
fresh YPD medium containing 2% w ⁄ v agar (20 mL, main-
tained at 60 °C), grown until they reached an absorbance
at 600 nm (A
600
)of10
)3
, and the suspension was immedi-
ately poured into a dish. The plates were then incubated at
30 °C for 24 h.
Flow cytometric EGFP fluorescence analysis
The fluorescence intensity of EGFP fusion proteins in yeast
cells stimulated with 5 l m of a-factor in YPD medium for
6 h was measured using a FACSCalibur flow cytometer
equipped with a 488 nm air-cooled argon laser (Becton
Dickinson and Company), and the data were analyzed
using cellquest software (Becton Dickinson and Com-
pany). Parameters were as follows: the amplifiers were set
in linear mode for forward scattering and in logarithmic
mode for the green fluorescence detector (FL1, 530 ⁄ 30 nm
bandpass filter) and the orange fluorescence detector (FL2,
585 ⁄ 21 nm bandpass filter). The amplifier gain was set at
1.00 for forward scattering; the detector voltage was set to
E00 for forward scattering and 600 V for FL1, and the
threshold for forward scattering was set at 52. The EGFP
fluorescence signal was collected using a 530 ⁄ 30 nm band-
pass filter (FL1), and the fluorescence intensity of 10 000
cells was defined as the FL1-height (FL1-H) geometric
mean.
Western blot analysis
Yeast cells were cultured in YPD medium overnight. The
cells were then harvested, washed in NaCl ⁄ Pi to remove
culture media and resuspended in sample buffer for
SDS ⁄ PAGE at an A
600
of 20. Fractionated cell lysates were
prepared by glass bead vortex homogenization for 15 min.
Protein extracts were separated by 15% SDS ⁄ PAGE, and
Western blot analysis was performed using the primary
antibodies goat anti-protein A (Rockland, Gilbertsville, PA,
USA) for the ZZ or Z domain, and goat anti-human IgG
(Fc) (Kirkegaard Perry Laboratories, Gaithersburg, MD,
USA) for the Fc portion. Alkaline phosphatase-conjugated
anti-goat IgG (Vector Laboratories, Burlingame, CA, USA)
was used as the secondary antibody, and colorimetric detec-
tion of alkaline phosphatase activity was performed using
5-bromo-4-chloro-3-indolyl-phosphate and nitroblue tetra-
zolium (Promega Co., Madison, WI, USA).
Acknowledgements
This work was supported by a Research Fellowship
for Young Scientists from the Japanese Society for the
Promotion of Science, and in part by the Global COE
Program ‘Global Center for Education and Research
in Integrative Membrane Biology’ from the Ministry
of Education, Culture, Sports, Science and Technology
of Japan.
References
1 Aronheim A, Engelberg D, Li N, ai-Alawi N, Schles-
singer J & Karin M (1994) Membrane targeting of the
nucleotide exchange factor Sos is sufficient for activat-
ing the Ras signaling pathway. Cell 78 , 949–961.
2 Broder YC, Katz S & Aronheim A (1998) The ras
recruitment system, a novel approach to the study of
protein–protein interactions. Curr Biol 8 , 1121–1124.
3 Ehrhard KN, Jacoby JJ, Fu XY, Jahn R & Dohlman
HG (2000) Use of G-protein fusions to monitor integral
membrane protein–protein interactions in yeast. Nat
Biotechnol 18, 1075–1079.
4 Medici R, Bianchi E, DiSegni G & Tocchini-Valentini
GP (1997) Efficient signal transduction by a chimeric
yeast-mammalian G protein a subunit Gpa1-Gsa cova-
lently fused to the yeast receptor Ste2. EMBO J 24,
7241–7249.
5 Ishii J, Tanaka T, Matsumura S, Tatematsu K, Kuroda
S, Ogino C, Fukuda H & Kondo A (2008) Yeast-based
fluorescence reporter assay of G protein-coupled recep-
tor signalling for flow cytometric screening: FAR1-dis-
ruption recovers loss of episomal plasmid caused by
signalling in yeast. J Biochem 143, 667–674.
6 Manahan CL, Patnana M, Blumer KJ & Linder ME
(2000) Dual lipid modification motifs in Ga and Gc
subunits are required for full activity of the pheromone
response pathway in Saccharomyces cerevisiae. Mol Biol
Cell 18, 957–968.
7 Kronvall G & Williams RC Jr (1969) Differences in
anti-protein A activity among IgG subgroups. J Immu-
nol 103, 828–833.
N. Fukuda et al. Detection system for protein–protein interactions
FEBS Journal 276 (2009) 2636–2644 ª 2009 The Authors Journal compilation ª 2009 FEBS 2643
8 Nilsson B, Moks T, Fansson B, Abrahmsen L, Elmbrad
A, Holmgren E, Henrichson C, Jones TA & Uhlen MA
(1987) Synthetic IgG-binding domain based on staphy-
lococcal protein A. Protein Eng 1, 107–113.
9 Shibasaki S, Kuroda K, Nguyen HD, Mori T, Zou W
& Ueda M (2006) Detection of protein–protein interac-
tions by a combination of a novel cytoplasmic mem-
brane targeting system of recombinant proteins and
fluorescence resonance energy transfer. Appl Microbiol
Biotechnol 70, 451–457.
10 Jendeberg L, Persson B, Anderssson R, Karlsson R,
Uhlen M & Nilsson B (1995) Kinetic analysis of the
interaction between protein A domain variants and
human Fc using plasmon resonance detection. J Mol
Recognit 8, 270–278.
11 Brachann CB, Davies A, Cost GJ, Caputo E, Li J,
Hieter P & Boeke JD (1998) Designer deletion strains
derived from Saccharomyces cerevisiae S288C: a useful
set of strains and plasmids for PCR-mediated gene
disruption and other applications. Yeast 14, 115–132.
12 Gu
¨
ldener U, Heck S, Fielder T, Beinhauer J & Hege-
mann JH (1996) A new efficient gene disruption cassette
for repeated use in budding yeast. Nucleic Acids Res 24,
2519–2524.
13 Nakamura Y, Shibasaki S, Ueda M, Tanaka A, Fuku-
da H & Kondo A (2001) Development of novel whole-
cell immunoadsorbents by yeast surface display of the
IgG-binding domain. Appl Microbiol Biotechnol 57,
500–505.
14 Fukuda N, Ishii J, Shibasaki S, Ueda M, Fukuda H &
Kondo A (2007) High-efficiency recovery of target cells
using improved yeast display system for detection of
protein–protein interactions. Appl Microbiol Biotechnol
76, 151–158.
15 Gietz D, St. Jean A, Woods RA & Schiestl RH
(1992) Improved method for high efficiency
transformation of intact yeast cells. Nucleic Acids Res
20, 1425.
16 Ishii J, Matsumura S, Kimura S, Tatematsu K, Kuroda
S, Fukuda H & Kondo A (2006) Quantitative and
dynamic analyses of G protein-coupled receptor signal-
ing in yeast using Fus1, enhanced green fluorescence
protein (EGFP), and His3 fusion protein. Biotechnol
Prog 22, 954–960.
Detection system for protein–protein interactions N. Fukuda et al.
2644 FEBS Journal 276 (2009) 2636–2644 ª 2009 The Authors Journal compilation ª 2009 FEBS