Báo cáo khoa học: Regulation of secretases by all-trans-retinoic acid pot
Bạn đang xem bản rút gọn của tài liệu. Xem và tải ngay bản đầy đủ của tài liệu tại đây (800.88 KB, 11 trang )
Regulation of secretases by all-trans-retinoic acid
Anna Koryakina, Jessica Aeberhard, Sabine Kiefer, Matthias Hamburger and Peter Ku
¨
enzi
Institute of Pharmaceutical Biology, University of Basel, Switzerland
The importance of vitamin A and its active metabolite
retinoic acid (RA) for cellular growth, differentiation,
and death, as well as for embryonic development and
vision, is well documented [1]. Growing evidence
points towards an additional role of retinoids in the
mature brain, with effects on sleep [2], synaptic plastic-
ity, learning, and memory [3].
Several publications have described a crucial role of
retinoid signalling in neurodegenerative diseases, par-
ticularly in Alzheimer’s disease (AD) [4,5]. Although
fibril-destabilizing [6] and neuroprotective [7] features
of retinoids against amyloid beta (Ab)-induced toxicity
have been demonstrated, the underlying mechanisms
remain unknown.
According to the amyloid hypothesis [8], Ab accu-
mulation is one of the most important steps in AD
pathology, and results from impaired amyloid precur-
sor protein (APP) processing. Therefore, some emerg-
ing therapeutic approaches involve modulation of APP
cleavage via b-secretase inhibition, or a-secretase acti-
vation, by, for example, activation of protein kinase C
(PKC) [9]. Links between retinoids and PKC were con-
vincingly demonstrated [10], and even pointed to direct
binding between PKCs and RA receptors and control
of transcriptional activity [11].
However, besides activation of a-secretases, little is
known about their effects on b-secretase and c-secre-
tase. Moreover, tumour-promoting activity limits the
Keywords
Alzheimer’s disease; PDBu (phorbol-
12,13-dibutyrate); PKC (protein kinase C);
retinoic acid; secretases
Correspondence
P. Ku
¨
enzi, Institute of Pharmaceutical
Biology, University of Basel,
Klingelbergstrasse, 50, 4056 Basel,
Switzerland
Fax: +41 61 267 14 74
Tel: +41 61 267 15 44
E-mail:
(Received 12 January 2009, revised 19
February 2009, accepted 4 March 2009)
doi:10.1111/j.1742-4658.2009.06992.x
One of the emerging approaches for the treatment of Alzheimer’s disease
aims at reducing toxic levels of Ab-species through the modulation of
secretases, namely by inducing a-secretase or inhibiting b-secretase and⁄ or
c-secretase activities, or a combination of both. Although there is increas-
ing evidence for the involvement of retinoids in Alzheimer’s disease, their
significance in the regulation of Ab-peptide production remains unresolved.
Our work concentrated on the regulation of all secretases mediated by
all-trans-retinoic acid (ATRA), and supports the hypothesis that ATRA is
capable of regulating them in an antiamyloidogenic sense at the levels of
transcription, translation, and activation. Apart from increased a-secretase
activity, we show a complex chain of regulatory events, resulting in
impaired b-secretase trafficking and membrane localization upon protein
kinase C (PKC) activation by ATRA. Furthermore, ATRA demonstrates
substrate specificity for b-site amyloid precursor protein-cleaving enzyme
(BACE) 1 over nonamyloidogenic BACE2 in b-secretase regulation, which
probably promotes competition for amyloid precursor protein between
ADAM17 and BACE1. Additionally, we report enhanced secretion of solu-
ble amyloid precursor protein a after ATRA exposure, possibly due to
PKC activation, as pretreatment with the PKC inhibitor Go
¨
6976 abolished
all these events.
Abbreviations
Ab, antibody; AD, Alzheimer’s disease; ADAM, a disintegrin and metalloprotease; APP, amyloid precursor protein; ATRA, all-trans-retinoic
acid; Ab, amyloid beta; BACE, b-site amyloid precursor protein-cleaving enzyme; CTF, C-terminal fragment; DAG, diacylglycerol;
ER, endoplasmic reticulum; FACS, fluorescence activated cell sorting; PDBu, phorbol-12,13-dibutyrate; PKC, protein kinase C; PS, presenilin;
RA, retinoic acid; sAPPa, soluble amyloid precursor protein derived by a-cleavage; SE, standard error.
FEBS Journal 276 (2009) 2645–2655 ª 2009 The Authors Journal compilation ª 2009 FEBS 2645
use of several potential PKC activators, such as phor-
bol esters. Therefore, an assessment of the action of
RA(s) in AD might be valuable for AD patients, as
retinoids have a long history of clinical use [11,12].
To elucidate the regulation of secretases, we exam-
ined the effect of all-trans-retinoic acid (ATRA) on
a-secretase [a disintegrin and metalloprotease
(ADAM) 9, ADAM10, and ADAM17], on b-secretase
[b-site amyloid precursor protein cleaving-enzyme
(BACE) 1 and BACE2], and on the components of the
c-secretase complex [presenilin (PS) 1 and PS2].
Results
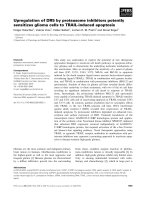
ATRA treatment upregulated mRNA and protein
levels of a-secretases
We first looked for induced mRNA levels of ADAM9
and ADAM10 upon administration of ATRA by real-
time PCR in the human neuroblastoma cell line IMR-32
[13]. Treatment with 5 lm ATRA for 2, 4, 6, 24 and
48 h increased the quantities of both ADAM9 and
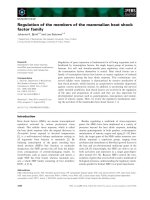
ADAM10 mRNAs, peaking at 174% and 205%, respec-
tively, of the corresponding control levels (Fig. 1A).
Enhanced ADAM9 and ADAM10 transcription cor-
related with increased protein amounts upon treatment
with 5 lm ATRA or 1 lm phorbol-12,13-dibutyrate
(PDBu). ATRA treatment led to maximal protein
levels of 127% and 168% for ADAM9 and ADAM10,
respectively (Fig. 1B), whereas the expression of
ADAM17 remained largely unchanged or within the
range of experimental error in response to ATRA
treatment (Fig. 1A,B).
Additionally, the localization of ADAM9, ADAM10
and ADAM17 rapidly changed in response to ATRA,
as shown by confocal immunofluorescence analysis: all
a-secretases showed strong translocation to the cellular
membrane (ADAM9 and ADAM10) or to perinuclear
compartments (ADAM17) after treatment with 5 lm
ATRA for the time periods indicated (Fig. 1C).
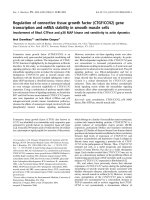
ATRA activated PKCa and PKCbII, leading to
increased APP cleavage
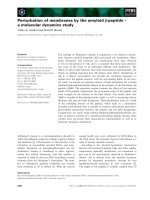
To check whether ATRA induces PKC signalling, we
treated IMR-32 cells with different amounts of ATRA
(0, 1, 2, 5 and 10 lm) for the time periods indicated (0,
5, 10 and 15 min), and observed clear phosphorylation
of PKC with 5 lm ATRA using a pan-phospho-PKC
antibody (Fig. 2A). To determine whether 5 lm ATRA
induced activation of classic PKCs for the indicated
time periods, we examined the expression, location and
phosphorylation of PKCa and PKCbII. Both PKCa
and PKCbII showed increased phosphorylation
(Fig. 2C), and translocated to the cell membrane after
10 min of ATRA exposure (Fig. 2B).
To study the effect of PKC stimulation on APP
cleavage, IMR-32 cells were treated with 5 lm ATRA
(6 h) or 1 lm PDBu (1 h). Proteins from the collected
media were then analysed for soluble APPa (sAPPa)
by western blot, and elevated release was found after
ATRA exposure, indicating increased a-secretase activ-
ity (Fig. 2D). The appearance of the soluble APP frag-
ment derived by a-cleavage (sAPPa) was partly
abolished by the addition of 1 lm Go
¨
6976, a known
inhibitor of PKCs [14]. Similarly, application of 1 lm
PDBu for 30 min or 1 h resulted in appearance of the
sAPPa fragment, an effect that was completely abol-
ished by pretreatment with Go
¨
6976.
As this effect might point towards the possibility
that ATRA is capable of reducing Ab
levels, we tried
to detect changes in intracellular and extracellular lev-
els of total Ab and the amyloidogenic fragments Ab40
and Ab42, utilizing several approaches, such as ELISA
or immunoprecipitation. Whereas extracellular Ab
could not be detected at all, changes in intracellular
levels remained negligible (not shown).
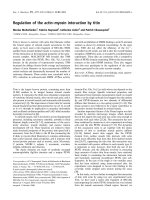
ATRA-induced signalling affects BACE1 but
not BACE2
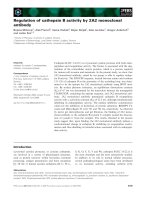
To study the effect of ATRA on BACE1 transcription,
we treated IMR-32 cells for 2, 4, 6, 24 and 48 h with
5 lm ATRA and performed real-time PCR. BACE1
mRNA levels increased to a maximum of 168% of the
control level after 4 h of ATRA treatment, and these
levels persisted for up to 24 h (Fig. 3A). This was con-
sistent with increased protein amounts, which reached
143% of control levels after 24 h (Fig. 3C), as shown
by fluorescence activated cell sorting (FACS) analysis.
Exposure to PDBu, however, only insignificantly
increased the BACE1 protein quantity, to 106%
(Fig. 3C).
At the same time, neither ATRA nor PDBu led to any
significant changes in the protein levels of BACE2, a
homologue of BACE1, and the differences perceived
remained within the range of experimental error
(Fig. 3C). Moreover, localization of BACE2 remained
unaffected upon ATRA treatment (Fig. 3B), whereas
BACE1, which initially localized in the cytoplasm and
cell membrane in untreated controls, showed a massively
changed distribution 3 h post-treatment (Fig. 3D).
As BACE1 is synthesized in the endoplasmic reticu-
lum (ER), and increased BACE1 mRNA levels were
observed in our experiments, we examined its distribu-
tion by confocal immunofluorescence microscopy,
Regulation of secretases by retinoic acid A. Koryakina et al.
2646 FEBS Journal 276 (2009) 2645–2655 ª 2009 The Authors Journal compilation ª 2009 FEBS
looking particularly for BACE1 localization in the ER.
BACE1 was initially localized in both membrane and
ER, and colocalized to some extent with calnexin, a
widely used ER marker protein. ATRA exposure for
3 h resulted in increased BACE1 colocalization with
calnexin (Fig. 3D).
–
3
IMR-32
6
ADAM9
ADAM10
ADAM17
24
ADAM10
ADAM9
ADAM10
ADAM9
*
*
*
*
*
**
**
ADAM17
*
*
ADAM17
A
B
C
5 µM ATRA (h)
Change in protein amounts (%) Change in mRNA amounts (%)
* P < 0.05
** P < 0.01
Fig. 1. ATRA activated a-secretases in IMR-
32 cells. (A) mRNA levels of ADAM9 and
ADAM10 increased in response to ATRA
treatment, as shown by real-time PCR,
whereas changes in ADAM17 levels
remained within the standard error (SE). (B)
As assessed by FACS analysis, ADAM9 and
ADAM10 protein levels were increased by
both 5 l
M ATRA or 1 lM PDBu, whereas
that of ADAM17 remained largely
unchanged. Error bars: mean ± SE. (C) Rep-
resentative confocal fluorescence images of
ADAM9 (first row), ADAM10 (second row)
and ADAM17 (third row) translocation in
response to 5 l
M ATRA addition are shown.
ADAM9 and ADAM10 demonstrated time-
dependent translocation to the cellular
membrane, whereas ADAM17 translocation
to the cytoplasm was seen after 3 h of
treatment, and continually increased over
the 24 h of testing.
A. Koryakina et al. Regulation of secretases by retinoic acid
FEBS Journal 276 (2009) 2645–2655 ª 2009 The Authors Journal compilation ª 2009 FEBS 2647
However, further incubation of IMR-32 cells with
5 lm ATRA (6 h and longer) provoked translocation of
BACE1 to the plasma membrane (Fig. 3D). Analogous
treatment with 1 lm PDBu also resulted in BACE1 trans-
location to the membrane; this effect was completely
abolished by the PKC inhibitor Go
¨
6976 (Fig. 3E).
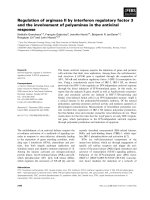
ATRA affected the activity, transcription and
localization of PS1
As APP cleavage is sequential and modulated by
ATRA at the a⁄ b-secretase level, we also investigated
possible modulation of c-secretase-dependent cleavage.
We focused on PS1 and PS2, which are homologous
transmembrane proteins forming the functional core of
the c-secretase [15].
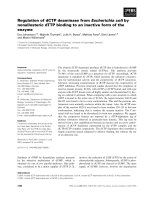
RT-PCR experiments revealed slightly increased
PS1 mRNA levels after treatment with 5 lm ATRA
for 24 h (Fig. 4A). This was accompanied by
the appearance of the full-length PS1 and its
active C-terminal fragment (CTF) in protein
samples from cells treated with ATRA or PDBu
(Fig. 4B). This effect was efficiently blocked by
addition of 1 lm Go
¨
6976. PS2 levels remained
AB
C
D
Fig. 2. ATRA treatment activated PKCs and
caused increased secretion of sAPPa in
IMR-32 cells. (A) Phosphorylation of PKC
was induced by application of various con-
centrations of ATRA, and reached a maxi-
mum upon treatment with 5 l
M ATRA. (B)
Exposure to 5 l
M ATRA for 10 min induced
translocation of PKCa and PKCbII to the
cellular membrane, as shown by confocal
microscopy. (C) PKCa and PKCbII were
immunoprecipitated using specific antibod-
ies, separated by SDS ⁄ PAGE, and subse-
quently probed with PKCa, PKCbII and
phospho-PKC antibodies. The protein levels
of PKCa and PKCbII remained similar, but
their phosphorylation levels increased upon
ATRA treatment. Densitometric analysis is
shown for phosphorylation of PKCa and
PKCbII, based on basal expression of PKCa
and PKCbII, respectively, from three inde-
pendent experiments. (D) Treatment with
5 l
M ATRA for 3, 6 and 24 h, or 1 lM PDBu
for 0.5 and 1 h, induced sAPPa secretion
into the cell culture media. This effect was
partly abolished by addition of the classic
PKC inhibitor Go
¨
6976, as shown by immu-
noblot with concentrated media. Represen-
tative results obtained in at least three
experiments based on cell counts are
shown, as well as densitometric analysis of
three independent experiments.
Regulation of secretases by retinoic acid A. Koryakina et al.
2648 FEBS Journal 276 (2009) 2645–2655 ª 2009 The Authors Journal compilation ª 2009 FEBS
unchanged upon ATRA treatment, and the active
PS2 form, a CTF of 23 kDa, remained undetectable
(not shown).
Both PSs partly colocalized with calnexin in
the ER and nucleus in control cells, as assessed
by DNA counterstaining with DRAQ5 in
confocal immunofluorescence microscopy. Whereas
PS1 displayed a weak increase in nuclear
distribution (Fig. 4C), PS2 localization remained
unchanged after 6 and 24 h of ATRA treatment (not
shown).
ATRA-dependent regulation of secretases
in other cell lines
Additional experiments, performed in the murine
neuroblastoma cell line N2a and the human
embryonic kidney cell line HEK293, basically
confirmed the results obtained with IMR-32 cells.
We observed similar increases in PKCa and PKCbII
phosphorylation (Fig. 5A,B), as well as translocation
to the cellular membrane, upon ATRA treatment
(Fig. S1).
Co-localisation analysis
D
BACE 1
5 µ
M
ATRA (h)
–
3
Calnexin
Merged
Pearson’s
coefficient
Overlap
coefficient
0.252 0.374
0.644 0.671
1 µ
M
PDBu (h)
6
1
IMR-32
0.174 0.235
0.113 0.232
1
+ 1µM Gö6976 pre-treatment
0.262 0.421
E
Co-localisation analysis
** P < 0.01
* P < 0.05
+
5 µ
M
ATRA (4 h)
–
B
BACE 2
Change in protein levels (%)
C
BACE 2
BACE 1
A
BACE 1
Change in mRNA levels (%)
*
**
**
**
Fig. 3. ATRA-induced regulation of BACE1 was partly dependent on PKC activation. (A) BACE1 mRNA levels increased in IMR-32 cells in
response to ATRA treatment for the times indicated, as shown by real-time PCR analysis. Results from four independent experiments are
given. Error bars: mean ± SE. (C) FACS analysis showed increased BACE1 protein levels in IMR-32 cells after 24 h of ATRA treatment,
whereas those of BACE2 remained within the range of experimental error. Results from at least three independent experiments are given.
Error bars: mean ± SE. (B) BACE2 was localized in the outer membrane, and this remained unchanged upon exposure to 5 l
M ATRA. Repre-
sentative images are shown. (D, E) Localization of BACE1 in IMR-32 cells in response to 5 l
M ATRA (D) or 1 lM PDBu (E) was assessed by
confocal microscopy. Colocalization analysis between BACE1 and calnexin was performed using
IMAGEJ software. Colocalized areas are
shown in white, and Pearson’s and overlap coefficients are provided for each merged image. (D) ATRA treatment for 3 h affected the
BACE1 cytoplasmic distribution and increased BACE1 colocalization with the ER marker calnexin in IMR-32 cells. Prolonged ATRA exposure
(6 h and longer) resulted in BACE1 translocation towards the cellular membrane. The images shown are based on visibility and not protein
amount. (E) PDBu treatment (1 l
M) led to BACE1 translocation, similar to that induced by ATRA (first row), but this was abolished by
cotreatment with 1 l
M Go
¨
6976 (second row).
A. Koryakina et al. Regulation of secretases by retinoic acid
FEBS Journal 276 (2009) 2645–2655 ª 2009 The Authors Journal compilation ª 2009 FEBS 2649
Levels of secreted sAPPa increased in response to
5 lm ATRA (Fig. S2E) and 1 lm PDBu (not shown)
treatments. Cotreatment with the PKC inhibitor
Go
¨
6976 partially diminished sAPPa secretion into cell
media to control levels (Fig. S2E). However, changes
in intracellular and extracellular levels of total Ab,
Ab40 and Ab42 remained irrelevant or below the limit
of detection.
Changes in mRNA and protein levels of ADAM9
and ADAM10 in N2a and HEK293 cells in response
to ATRA treatment matched the observations seen in
IMR-32 cells. ADAM9 and ADAM10 displayed
increased mRNA and protein quantities in N2a and in
HEK293 cells (Fig. S2). Additionally, translocation to
the cellular membrane (ADAM9 and ADAM10) or to
perinuclear compartments (ADAM17) upon treatment
with 5 lm ATRA were observed (Fig. S3).
Enhanced transcription of PS1 corresponded
with increased protein expression in all cell lines
(Fig. S4A,B). This was accompanied either by stable
expression of full-length protein in N2a cells or by
enhanced cleavage of PS1 in HEK293 cells (Fig. 5C).
Addition of 1 lm Go
¨
6976 abolished this effect
(Fig. S4B). All cell lines displayed a weak increase in
PS1 nuclear distribution (Fig. S4C,D).
Increased mRNA levels (Figs S5 and S6A) and
protein levels of BACE1 (Figs S5 and S6C) were
accompanied by its impaired trafficking and late
translocation to the cellular membrane due to ATRA
(Figs S5 and S6D) and PDBu treatment (Figs S5 and
S6E) in all cell lines. ATRA distinguished equally
between BACE1 and BACE2, and influenced nei-
ther the expression (Figs S5 and S6C) nor localization
(Figs S5 and S6B) of BACE2 in any of the cell lines
tested.
Discussion
One strategy in AD treatment is aimed at protecting
neurons from the production of toxic Ab species [16].
Reduction of Ab
40 ⁄ 42
levels is mainly achieved by
modulation of secretases, namely by the induction of
a-secretase activity, by inhibition of b-secretases
and ⁄ or c-secretases, or by a combination of both.
This study provided evidence that ATRA regulates all
secretases at the levels of transcription, expression, and
activation.
PKC activators upregulate a-secretases, eventually
promoting the antiamyloidogenic pathway [17]. Pub-
lished data on positive and⁄ or negative PKC modula-
tion by ATRA are controversial, which may be
explained by a biphasic effect of ATRA on PKC
activity [18]. We observed increased phosphorylation
of PKCa and PKCbII in response to 5 lm ATRA
treatment in all examined cell lines.
It is generally accepted that classic and novel PKCs
become activated by diacylglycerol (DAG), triggering
localization to the cellular membrane. Endogenous
DAG levels differ in various cell lines, and determine
the PKC activation profile. The classic model for PKC
activation involves its phosphorylation and transloca-
tion from the cytosol to the binding domain on
5 µM ATRA (h)
–
6
24
PS1/FL
PS1/CTF
5 µ
M ATRA (h)
–
24
GADPH
PS1
50 kDa
25 kDa
1 µM PDBu (h)
–
1
1
PS1/CTF
25 kDa
1 µM Gö6976
–
–
+
PS1/FL
50 kDa
5 µM ATRA (h)
–
6
6
PS1/CTF
25 kDa
1 µM Gö6976
–
–
+
PS1/FL
50 kDa
Co-localisation analysis
Presenilin 1
5 µ
M
ATRA (24 h)
–
+
DRAQ5™
Merged
0.171
0.227
A
B
C
Pearson’s
coefficient
Fig. 4. Modulation of PS1 upon activation of PKC. (A) Increased mRNA levels of PS1 were observed upon PKC activation by ATRA treat-
ment, as shown by RT-PCR analysis. (B) In IMR-32 cells, immunoblot analysis revealed increased levels of PS1 after exposure to 5 l
M ATRA
or 1 l
M PDBu. Inhibition of PKC by cotreatment with 1 lM Go
¨
6976 blocked this increase in IMR-32 cells. (C) Representative confocal fluo-
rescence images of PS1 in IMR-32 cells showed slightly increased colocalization with the DNA counterstain DRAQ5. Colocalization analysis
was performed using
IMAGEJ software. Colocalized areas are highlighted in white, and Pearson’s and overlap coefficients are provided for
each merged image. GAPDH, glyceraldehyde-3-phosphate dehydrogenase.
Regulation of secretases by retinoic acid A. Koryakina et al.
2650 FEBS Journal 276 (2009) 2645–2655 ª 2009 The Authors Journal compilation ª 2009 FEBS
cellular membranes, a translocation that we observed
in all cell lines. This event correlated with positive
modulation of a-secretases.
In contrast to other findings, we observed increased
mRNA and protein levels of ADAM9. Notably, recent
findings suggest that ADAM9 acts as an important
regulator upstream of ADAM10 by shedding and
releasing its catalytically active ectodomain [19]. These
findings are consistent with transcriptional and transla-
tional upregulation of ADAM10, and the enhanced
APP cleavage seen in our experiments. The observed
translocation of ADAM9 and ADAM10 to the cyto-
plasmic membrane further supports the idea of APP
cleavage at the membrane by these secretases.
Our experiments showed a strong correlation
between PKC activation, translocation of ADAM17
into the perinuclear space and sAPPa secretion into
the extracellular space. As PKCa and PKCd – both
classic PKC isoforms – are located in the ER [20], we
believe that other APP cleavage sites, at the Golgi and
in the ER, are also impaired as a consequence of PKC
activation. b-Secretase cleaves APP within endosomes
during APP recycling from the plasma membrane, as
well as in the Golgi and ER [21,22]. As release of
active ADAM17 ultimately occurs in the same com-
partments, namely the Golgi and ER [23], we deduce
that ADAM17 is the main BACE1 competitor for
intracellular APP cleavage.
We further explored the effects of ATRA on BACE1
at the level of transcription, translation, and activity,
and found ATRA-dependent upregulation of its mRNA
and ⁄ or protein levels. Poor correlation between
increased BACE1 transcription and b-secretase activity
has been previously reported, leading to the ideas of
control at the level of translation [24] or its localization
by phosphorylation [25]. Interestingly, BACE1 increas-
ingly colocalized with the ER marker calnexin upon
ATRA treatment in our experiments. As pro-BACE1 is
predominantly located within the ER [26], this suggests
that addition of ATRA leads to BACE1 accumulation
within the ER by obstructing its maturation.
After long-term treatment, BACE1 was mainly
detected at the cellular membrane. This localization
might further impair BACE1-derived APP cleavage,
which typically occurs intracellularly, owing to its
requirement for an acidic pH. Moreover, we believe
that membranous BACE1 mainly consists of the fully
matured form, as transportation of BACE1 is initiated
by phosphorylation on its cytoplasmic tail, which
occurs exclusively after full maturation only [25].
BACE2, a structural homologue of BACE1, was not
affected by ATRA, despite its sequence homology.
BACE2 processes APP within the Ab domain between
Phe19 and Phe20, close to the a-secretase site [27], and
has distinct transcriptional regulation and function
[28]. BACE2 localization at the cellular membrane
remained unchanged in any of the cell lines tested,
which is possibly of interest for the antiamyloidogenic
5 10
5 µM ATRA (min)
IP PKCβII
–
5 10
15
p-PKC
PKCβII
HEK 293
5 µM ATRA (min)
– 5 10
15
IP PKCα
p-PKC
PKCα
5 µM ATRA (min)
– 5 10
15
IP PKCα
p-PKC
PKCα
5 µM ATRA (min)
IP PKCβII
–
15
p-PKC
PKC βII
N2a
HEK 293
5 µ
M ATRA (h)
–
6
24
PS1
CTF
5 µM ATRA (h)
–
6
24
PS1
CTF
N2a
A
B
C
Fig. 5. Cell line-specific differences in response to PKC activation
in N2a and HEK293 cells. (A, B) Immunoprecipitation followed by
immunoblot analysis showed similar PKCa and PKCbII protein lev-
els upon ATRA treatment, and both proteins showed increased
phosphorylation in N2a (A) and HEK293 (B) cells. (C) ATRA treat-
ment slightly increased the expression of both full-length PS1 and
its active CTF domain in N2a cells (first line), but enhanced the
cleavage of full-length PS1 to its active CTF form in HEK293 cells
(second line), as shown by immunoblot.
A. Koryakina et al. Regulation of secretases by retinoic acid
FEBS Journal 276 (2009) 2645–2655 ª 2009 The Authors Journal compilation ª 2009 FEBS 2651
processing of APP, as constitutive a-cleavage occurs at
the membrane [22].
To investigate whether PKC activation affects
further steps associated with c-secretase cleavage,
we studied the effects of ATRA and PDBu on PS1
and PS2 participation in the formation of the
macromolecular c-secretase complex [15]. We could
not identify any changes in the level of expression of
PS2, which was mainly detected as a full-length protein
of 52 kDa at any of the time points tested. Moreover,
wild-type PS2 was weakly expressed in all cell lines
examined, and ATRA had no effect whatsoever.
PS1, on the other hand, showed delicate ATRA-
dependent modification, and displayed slightly
enhanced nuclear localization, with the most pro-
nounced effect being observed after 24 h. PS1 could be
detected both as full-length protein and as active endo-
proteolytic CTF, and expression of both forms
increased after exposure to ATRA at 6 and 24 h.
Interestingly, PDBu treatment had only minor effects
on full-length protein levels, but led to the appearance
of substantial amounts of the endoproteolytic frag-
ment. This effect was abolished by cotreatment with
the PKC inhibitor Go
¨
6976. Intriguingly, Walter et al.
[29] reported processed PS1 CTF as an in vivo sub-
strate for PKC, which indicates that the physiological
and ⁄ or pathological properties of the active PS1 form
might be regulated by activated PKC.
Overall, the human cell lines (IMR-32 and HEK293)
displayed faster and stronger responses to PKC stimu-
lation, and showed more stable phosphorylation, than
N2a, a cell line of murine origin. This might depend
on variations in endogenous DAG levels, determining
the PKC activation profile. We observed no marked
differences in either the incubation time required for
PKC stimulation and secretase activation, in the tran-
scription ⁄ translation ratio, or in translocation of secre-
tases between tested cell lines.
In conclusion, ATRA treatment specifically shifts
secretase-dependent APP cleavage towards the antiam-
yloidogenic, owing to activation of PKCa and
PKCbII. Both subsequently affect various steps and
players involved in APP processing. However, ATRA-
induced alterations appear to be modest in nature, and
further research is therefore needed to assess their
physiological significance.
Experimental procedures
Cell culture and treatment
The human neuroblastoma IMR-32 cell line was main-
tained in DMEM ⁄ F12 (1 : 1) (Invitrogen, Basel, Switzer-
land), and the murine neuroblastoma N2a and human
embryonic kidney HEK293 cell lines were maintained in
DMEM (Sigma-Aldrich, Buchs, Switzerland). Media were
supplemented with 10% heat-inactivated fetal bovine serum
(Amimed, Basel, Switzerland), 100 UÆmL
)1
penicillin ⁄ strep-
tomycin (Invitrogen), and 2 mml-glutamine (Invitrogen).
All cell types were grown in a humified atmosphere con-
taining 5% CO
2
.
ATRA, Go
¨
6976 and PDBu were dissolved in dimethyl-
sulfoxide and directly added to the medium for the times
indicated. Go
¨
6976 was added 30 min prior to ATRA or
PDBu treatment, unless indicated otherwise. During pro-
longed treatment, medium was exchanged every 2 days.
Preparation of protein extracts and media
samples
Cells were collected, washed with ice-cold NaCl ⁄ P
i
(pH 7.4),
and lysed in a hypotonic buffer (10 mm Hepes, pH 7.9,
60 mm KCl, 1 mm EDTA, 1 mm dithiothreitol, 0.5% NP-40)
containing protease inhibitors [1 mm phenylmethanesulfonyl
fluoride, 1· Complete Protease Inhibitors (Roche Diagnos-
tics, Rotkreuz, Switzerland)]. Cytoplasmic extracts were
collected, and cleared by centrifugation at 16 100 g for
30 min. Protein concentrations of extracts were measured
using Coomassie Protein Assay Reagent (Sigma-Aldrich).
Media were collected, snap frozen and stored at )80 °C.
Before use, the media were thawed overnight at 4 °C, and
then applied to Ultrafree MC filters (cut-off 30 kDa) (Milli-
pore Corporation, Bedford, MA, USA). The samples were
concentrated to 200 lL by centrifugation at 2300 g for
30 min, and the protein concentrations were measured as
described above.
Western blotting
Cell lysates were separated by SDS ⁄ PAGE and blotted
onto nitrocellulose membranes using standard procedures.
Membranes were blocked and incubated overnight at 4 °C
with specific primary antibodies (Abs), diluted in blocking
buffer: anti-PKCa, 1 : 1000; anti-PKCbII, 1 : 1000; anti-
actin, 1 : 4000 (all Santa Cruz, CA, USA); anti-phospho-
PKC, 1 : 1000; anti-PS1, 1 : 500; anti-PS2, 1 : 1000 (all Cell
Signaling Technology, Beverly, MA, USA); and 6E10,
1 : 1000 (Signet Laboratories, Dedham, MA, USA).
Specific bands were tagged using horseradish peroxidase-
conjugated secondary Abs, and detected with the ECL Plus
System (Amersham Pharmacia Biotech, Little Chalfont,
UK).
Immunoprecipitation
Immunoprecipitation was performed according to standard
procedures. Briefly, cells were grown in 75 cm
2
flasks to
Regulation of secretases by retinoic acid A. Koryakina et al.
2652 FEBS Journal 276 (2009) 2645–2655 ª 2009 The Authors Journal compilation ª 2009 FEBS
80% confluency, starved overnight, and subsequently trea-
ted with 5 lm ATRA for the times indicated. Cells were
harvested, washed with ice-cold NaCl ⁄ P
i
, extracted in
100 lL of lysis buffer (20 mm Tris ⁄ HCl, pH 7.4, 25 mm
MgCl
2
, 0.05% NP-40, 1 mm dithiothreitol, 1· protease
inhibitors), and cleared by centrifugation at 16 100 g for
2 min.
Three hundred micrograms of total protein was incu-
bated with 1 lg of PKCa or PKCbII (both from Santa
Cruz) antibody in 500 lL of lysis buffer for 90 min at 4 °C.
Protein complexes were precipitated by adding 40 lLofa
50% slurry of protein G Sepharose beads (Sigma-Aldrich
Chemie GmbH, Steinheim, Germany) for 90 min at 4 °C,
washed four times with wash buffer (20 mm Tris ⁄ HCl,
pH 7.4, 25 mm MgCl
2
, 0.05% NP-40, 1 mm dithiothreitol,
120 mm NaCl), and dissolved by boiling with 30 lL of 1.5·
Laemmli buffer for 3 min at 95 °C. Samples were resolved
by SDS ⁄ PAGE and transferred to nitrocellulose mem-
branes. Filters were blocked, and analysed using antibodies
against phospho-PKC, anti-PKCa and anti-PKCbII (all
from Cell Signaling Technology).
RNA extraction, real-time PCR, and sequencing
Total RNA was extracted using TRIZOL (Invitrogen),
according to the manufacturer’s instructions, and tran-
scribed to cDNA by a reverse transcriptase reaction using
Moloney murine leukemia virus reverse transcriptase
(Invitrogen).
Real-time PCR using SYBR Green PCR Master Mix
(Applied Biosystems, Foster City, CA, USA) was per-
formed for ADAM9, ADAM10 and BACE1, using the
ABI PRISM 7700 System (Applied Biosystems). b-Actin
was used as an endogenous reference to normalize the
quantification of target mRNAs. Reactions were performed
in triplicate, and threshold cycle (C
t
) values were normal-
ized automatically by the software. Following reverse
transcription, the cDNAs for b-actin, ADAM9, ADAM10
and BACE1 were amplified under these conditions: one
cycle of 52 °C for 2 min, one cycle of 95 °C for 10 min, 40
cycles at 95 °C for 15 s and 60 °C for 1 min, and melting
curve analysis at 60–95 °C.
The following primers were used: human b-actin forward,
5¢-GGACTTCGAGCAAGAGATGG-3¢; human b-actin
reverse, 5¢-AGCACTGTGTTGGCGTACAG-3¢; murine
b-actin forward, 5¢-AGCCATGTACGTAGCCATCC-3¢;
murine b-actin reverse, 5¢ -CTCTCAGCTGTGGTGGTG
AA-3¢; human ADAM9 forward, 5¢-GAATGAATCACG
ATGATGGGAG-3¢; human ADAM9 reverse, 5¢-CCAGC
GTCCACCAACTTATTAC-3¢; murine ADAM9 forward,
5¢-CTTAACATCCCGAAGCCTGAC-3¢; murine ADAM9
reverse, 5¢-CTCACTGGTCTTCCCTCTGC-3¢; human
ADAM10 forward, 5¢-TTCAGGAAGCTCTGGAGGA
A-3¢; human ADAM10 reverse, 5¢-TCCTGGTGTGCAC
TCTGTTC-3¢; murine ADAM10 forward, 5¢-AGCAACAT
CTGGGGACAAAC-3¢; murine ADAM10 reverse, 5¢-TTG
CACTGGTCACTGTAGCC-3¢; human ADAM17 forward,
5¢-CCGCTGTGTGCCCTATGT-3¢; human ADAM17
reverse, 5¢-CCAGGACAGACCCAA-3¢; human BACE1 for-
ward, 5¢-AGGTTACCTTGGCGTGTGTCG-3¢
; human
BACE1 reverse, 5¢-GAGGCAATCTTTGCACCAAT-3¢;
murine BACE1 forward, 5¢-CACCATCCTTCCTCAGCAA
TAC-3¢; murine BACE1 reverse, 5¢-GTAACAAACGGACC
TTCCACTG-3¢; human PS1 forward, 5¢-GTTACCTGCA
CCGTTGTCCT-3¢; human PS1 reverse, 5¢-CTCATCTTGC
TCCACCACCT-3¢; murine PS1 forward, 5¢-CTCGCCAT
TTTCAAGAAAGC-3¢; murine PS1 reverse, 5¢-CAGT
GCGGGTAAATCTCCAT-3¢.
Nested PCR amplifications were carried out in individual
50 lL reactions in a Perkin Elmer Thermocycler Gene-
Amp 9700 (Applied Biosystems). All amplicons were
checked by sequencing (performed by Microsynth, Balgach,
Switzerland).
Immunofluorescence microscopy and
data analysis
IMR-32, N2a and HEK 293 cells were fixed in 4% formal-
dehyde in NaCl ⁄ P
i
for a minimum of 15 min at 4 °C, per-
meabilized using 0.2% Triton-X (prepared in NaCl ⁄ P
i
containing 10% heat-inactivated fetal bovine serum), and
then incubated with primary Abs. The Abs were diluted in
NaCl ⁄ P
i
containing 10% heat-inactivated fetal bovine
serum as follows: anti-PKCa, 1 : 50; anti-PKCbII, 1 : 50
(both Santa Cruz, CA, USA); anti-PS1, 1 : 100; anti-PS2,
1 : 100 (both Cell Signaling Technology); anti-ADAM9,
1 : 50; anti-BACE2, 1 : 100 (both AbD Serotec, Du
¨
sseldorf,
Germany); anti-ADAM10, 1 : 50; anti-ADAM17, 1 : 50
(both Chemicon Europe Ltd, Chandlers Ford, UK); anti-
BACE1, 1 : 100 (Merck Chemicals Ltd, Beeston, UK; cat.
no. 195111); and anti-calnexin, 1 : 100 (BD Biosciences,
Basel, Switzerland). The immunogen in antibodies against
BACE1 is a synthetic peptide (CLRQQHDDFADDISLLK)
corresponding to amino acids 485–501 at the C-terminus of
BACE1.
Cells were then washed three times with NaCl ⁄ P
i
and
incubated for 1 h with affinity-purified Alexa-Fluor 488
goat anti-[rabbit IgG (H + L)], Alexa-Fluor 488 goat anti-
[mouse IgG (H + L)] or anti-rabbit Texas Red (all Invitro-
gen, Molecular Probes, Basel, Switzerland; diluted 1 : 1500
in NaCl ⁄ P
i
). Nuclei were stained with DRAQ5 (Alexis;
diluted 1 : 3000 in NaCl ⁄ P
i
), and visualized with a Leica
TCS SP scanning confocal microscope. Identical exposure
times were used across conditions. Series of optical sections
were taken at 1 lm intervals in line average mode with a
picture size of 512 · 512 pixels, using Leica confocal soft-
ware, version 2.5 (Leica Microsystems, Heidelberg GmbH),
and analysed with imagej 1.37t software (o.
nih.gov/ij/; National Institutes of Health, Bethesda, MD,
USA).
A. Koryakina et al. Regulation of secretases by retinoic acid
FEBS Journal 276 (2009) 2645–2655 ª 2009 The Authors Journal compilation ª 2009 FEBS 2653
For colocalization analysis, pictures were converted to
eight-bit grey scale images at a 0 < 255 fluorescence inten-
sity range, and the threshold for each channel was deter-
mined by colocalization threshold plug-in. These
automatically determined threshold values were used in the
next step of colocalization analysis, performed with jacop
plug-in [21], and Pearson’s correlation and overlap coeffi-
cients are shown (for details, see />plugins/track/jacop.html). Merged images with white areas
displaying the colocalization between BACE1 and calnexin
or PS1 and DRAQ5 (DNA counterstaining) were generated
using imagej colocalization finder plug-in.
FACS
IMR-32, N2a and HEK293 cells were fixed in 2% parafor-
maldehyde in NaCl⁄ P
i
for 10 min at 37 °C, permeabilized
using 90% ice-cold methanol, and then incubated with pri-
mary Abs overnight at 4 °C. The Abs were diluted in
NaCl ⁄ P
i
containing 1% BSA as follows: anti-ADAM9,
1 : 50; anti-BACE2, 1 : 100 (both AbD Serotec); anti-
ADAM10, 1 : 100; anti-ADAM17, 1 : 100 (both from
Chemicon Europe Ltd, Chandlers Ford, UK); anti-BACE1,
1 : 100 (Merck Chemicals Ltd, Beeston, UK); anti-Ab40,
1 : 50; anti-Ab42, 1 : 50 (both The Genetics Company Inc.,
Schlieren, Switzerland); and 6E10 Abs, 1 : 100 (Signet
Laboratories).
Cells were washed twice with 1% BSA ⁄ NaCl ⁄ P
i
and incu-
bated for 30 min with affinity-purified Alexa-Fluor 488 goat
anti-[rabbit IgG (H + L)] or Alexa-Fluor 488 goat anti-
[mouse IgG (H + L)], diluted 1 : 1500 in 1% BSA ⁄
NaCl ⁄ P
i
) (Invitrogen-Molecular Probes), and analysed on
a Dako CyAn ADP LX 7 using summit 4.3 software
(DakoCytomation, Fort Collins, CO, USA).
Statistical analyses
Real-time PCR data were quantified by applying the DDCt
model, according to the equation ratio = (E
target
)
DCt (target)
⁄
(E
reference
)
DCt (reference)
,whereDCt
target
=Ct
control
)Ct
treatment
,
DCt
reference
=Ct
control
)Ct
treatment
, and E is the amplifica-
tion efficiency of a particular pair of primers. The
amplification efficiency of each primer pair was determined
experimentally, as previously described [30]. Additionally,
the Ct values were normalized within the logarithmic
phase with the highest PCR amplification efficiency by
abi prism 7000 software. For statistical analysis by
unpaired t-test, we assumed that both treatment and con-
trol groups have a Gaussian distribution of DCt values, as
well as equal variances.
FACS data were quantified as described in manual for
summit V4.3 software. The original method was published
by Overton [31]. Briefly, FACS data were plotted on the
side scatter versus forward scatter histogram, and apoptotic
cells and cell debris were gated out. For doublet discrimina-
tion, the main cell population was gated on the Lin pulse
width histogram. Data quantification was performed using
the ‘subtraction histogram’ analysis tool in summit V4.3.
Subtraction methods give a fluorescence difference
between control and treated sample for a particular
parameter (fluorescein isothiocyanate log). The Overton
option was used for calculating this difference; this repre-
sents a ‘true’ percentage of positively labelled cells. Differ-
ences between controls and treated samples were considered
to be significant with a P-value < 0.05 in Student’s t-test.
References
1 Blomhoff R & Blomhoff HK (2006) Overview of reti-
noid metabolism and function. J Neurobiol 66, 606–630.
2 Maret S, Franken P, Dauvilliers Y, Ghyselinck NB,
Chambon P & Tafti M (2005) Retinoic acid signaling
affects cortical synchrony during sleep. Science 310,
111–113.
3 Lane MA & Bailey SJ (2005) Role of retinoid signalling
in the adult brain. Prog Neurobiol 75, 275–293.
4 Corcoran JP, So PL & Maden M (2004) Disruption of
the retinoid signalling pathway causes a deposition of
amyloid beta in the adult rat brain. Eur J Neurosci 20,
896–902.
5 Goodman AB & Pardee AB (2003) Evidence for
defective retinoid transport and function in late onset
Alzheimer’s disease. Proc Natl Acad Sci USA 100,
2901–2905.
6 Ono K, Yoshiike Y, Takashima A, Hasegawa K, Naiki
H & Yamada M (2004) Vitamin A exhibits potent anti-
amyloidogenic and fibril-destabilizing effects in vitro.
Exp Neurol 189, 380–392.
7 Sahin M, Karauzum SB, Perry G, Smith MA & Alicig-
uzel Y (2005) Retinoic acid isomers protect hippocam-
pal neurons from amyloid-beta induced
neurodegeneration. Neurotox Res 7, 243–250.
8 Hardy J & Selkoe DJ (2002) The amyloid hypothesis of
Alzheimer’s disease: progress and problems on the road
to therapeutics. Science 297, 353–356.
9 Fahrenholz F & Postina R (2006) Alpha-secretase acti-
vation – an approach to Alzheimer’s disease therapy.
Neurodegener Dis 3, 255–261.
10 Ochoa WF, Torrecillas A, Fita I, Verdaguer N, Corba-
lan-Garcia S & Gomez-Fernandez JC (2003) Retinoic
acid binds to the C2-domain of protein kinase C(alpha).
Biochemistry 42, 8774–8779.
11 Delmotte MH, Tahayato A, Formstecher P & Lefeb-
vre P (1999) Serine 157, a retinoic acid receptor alpha
residue phosphorylated by protein kinase C in vitro, is
involved in RXR.RARalpha heterodimerization and
transcriptional activity. J Biol Chem 274, 38225–
38231.
12 Evans TR & Kaye SB (1999) Retinoids: present role
and future potential. Br J Cancer 80, 1–8.
Regulation of secretases by retinoic acid A. Koryakina et al.
2654 FEBS Journal 276 (2009) 2645–2655 ª 2009 The Authors Journal compilation ª 2009 FEBS
13 Guo Q, Xie J, Chang X & Du H (2001) Prostate apop-
tosis response-4 enhances secretion of amyloid beta pep-
tide 1–42 in human neuroblastoma IMR-32 cells by a
caspase-dependent pathway. J Biol Chem 276, 16040–
16044.
14 Leppanen T, Jalonen U, Kankaanranta H, Tuominen R
& Moilanen E (2008) Inhibition of protein kinase C
beta II downregulates tristetraprolin expression in acti-
vated macrophages. Inflamm Res 57, 230–240.
15 Vetrivel KS, Zhang YW, Xu H & Thinakaran G (2006)
Pathological and physiological functions of presenilins.
Mol Neurodegener 1, 4–15.
16 Citron M (2004) Strategies for disease modification in
Alzheimer’s disease. Nat Rev Neurosci 5, 677–685.
17 Etcheberrigaray R, Tan M, Dewachter I, Kuiperi C,
Van der Auwera I, Wera S, Qiao L, Bank B, Nelson
TJ, Kozikowski AP et al. (2004) Therapeutic effects of
PKC activators in Alzheimer’s disease transgenic mice.
Proc Natl Acad Sci USA 101, 11141–11146.
18 Lopez-Andreo MJ, Torrecillas A, Conesa-Zamora P,
Corbalan-Garcia S & Gomez-Fernandez JC (2005) Reti-
noic acid as a modulator of the activity of protein
kinase Calpha. Biochemistry 44, 11353–11360.
19 Cisse MA, Sunyach C, Lefranc-Jullien S, Postina R,
Vincent B & Checler F (2005) The disintegrin ADAM9
indirectly contributes to the physiological processing of
cellular prion by modulating ADAM10 activity. J Biol
Chem 280, 40624–40631.
20 Goodnight JA, Mischak H, Kolch W & Mushinski JF
(1995) Immunocytochemical localization of eight pro-
tein kinase C isozymes overexpressed in NIH 3T3 fibro-
blasts. Isoform-specific association with microfilaments,
Golgi, endoplasmic reticulum, and nuclear and cell
membranes. J Biol Chem 270, 9991–10001.
21 Bolte S & Cordelieres FP (2006) A guided tour into
subcellular colocalization analysis in light microscopy.
J Microsc 224, 213–232.
22 Parvathy S, Hussain I, Karran EH, Turner AJ &
Hooper NM (1999) Cleavage of Alzheimer’s amyloid
precursor protein by alpha-secretase occurs at
the surface of neuronal cells. Biochemistry 38,
9728–9734.
23 Schlondorff J, Becherer JD & Blobel CP (2000) Intra-
cellular maturation and localization of the tumour
necrosis factor alpha convertase (TACE). Biochem J
347(Pt 1), 131–138.
24 De Pietri Tonelli D, Mihailovich M, Di Cesare A, Cod-
azzi F, Grohovaz F & Zacchetti D (2004) Translational
regulation of BACE-1 expression in neuronal and non-
neuronal cells. Nucleic Acids Res 32, 1808–1817.
25 Walter J, Fluhrer R, Hartung B, Willem M, Kaether C,
Capell A, Lammich S, Multhaup G & Haass C (2001)
Phosphorylation regulates intracellular trafficking of
beta-secretase. J Biol Chem 276, 14634–14641.
26 Capell A, Steiner H, Willem M, Kaiser H, Meyer C,
Walter J, Lammich S, Multhaup G & Haass C (2000)
Maturation and pro-peptide cleavage of beta-secretase.
J Biol Chem 275 , 30849–30854.
27 Fluhrer R, Capell A, Westmeyer G, Willem M, Hartung
B, Condron MM, Teplow DB, Haass C & Walter J
(2002) A non-amyloidogenic function of BACE-2 in the
secretory pathway. J Neurochem 81, 1011–1020.
28 Sun X, Wang Y, Qing H, Christensen MA, Liu Y,
Zhou W, Tong Y, Xiao C, Huang Y, Zhang S et al.
(2005) Distinct transcriptional regulation and function
of the human BACE2 and BACE1 genes. FASEB J 19,
739–749.
29 Walter J, Grunberg J, Capell A, Pesold B, Schindzielorz
A, Citron M, Mendla K, George-Hyslop PS, Multhaup
G, Selkoe DJ et al. (1997) Proteolytic processing of the
Alzheimer disease-associated presenilin-1 generates an
in vivo substrate for protein kinase C. Proc Natl Acad
Sci USA 94, 5349–5354.
30 Yuan JS, Reed A, Chen F & Stewart CN Jr (2006)
Statistical analysis of real-time PCR data. BMC Bioin-
formatics 7, 85–96.
31 Overton WR (1988) Modified histogram subtraction
technique for analysis of flow cytometry data. Cytome-
try 9, 619–626.
Supporting information
The following supplementary material is available:
Fig. S1. ATRA treatment induced translocation of
PKCs.
Fig. S2. ATRA increased transcription, translation and
activity of a-secretases.
Fig. S3. ATRA exposure mediated translocation of
a-secretases.
Fig. S4. Modulation of PS1 upon PKC activation in
N2a and HEK293 cells.
Fig. S5. Regulation of b-secretase by ATRA affected
BACE1, but not BACE2, in N2a cells.
Fig. S6. Regulation of b-secretase by ATRA affected
BACE1, but not BACE2, in HEK293 cells.
This supplementary material can be found in the
online version of this article.
Please note: Wiley-Blackwell is not responsible for
the content or functionality of any supplementary
materials supplied by the authors. Any queries (other
than missing material) should be directed to the corre-
sponding author for the article.
A. Koryakina et al. Regulation of secretases by retinoic acid
FEBS Journal 276 (2009) 2645–2655 ª 2009 The Authors Journal compilation ª 2009 FEBS 2655