Báo cáo khoa học: The occurrence of riboflavin kinase and FAD synthetase ensures FAD synthesis in tobacco mitochondria and maintenance of cellular redox status docx
Bạn đang xem bản rút gọn của tài liệu. Xem và tải ngay bản đầy đủ của tài liệu tại đây (450.11 KB, 13 trang )
The occurrence of riboflavin kinase and FAD synthetase
ensures FAD synthesis in tobacco mitochondria and
maintenance of cellular redox status
Teresa A. Giancaspero
1
, Vittoria Locato
2
, Maria C. de Pinto
3
, Laura De Gara
2,3
and Maria Barile
1
1 Dipartimento di Biochimica e Biologia Molecolare ‘E. Quagliariello’, Universita
`
degli Studi di Bari, Italy
2 Centro Interdipartimentale di Ricerche Biomediche (CIR), Universita
`
Campus Biomedico, Roma, Italy
3 Dipartimento di Biologia e Patologia Vegetale, Universita
`
degli Studi di Bari, Italy
Whereas mammals must obtain riboflavin (Rf, vita-
min B
2
) from food, plants, along with fungi and bac-
teria, can synthesize Rf de novo. The primary role of
Rf in cell metabolism derives from its conversion into
FMN and FAD, the redox cofactors of a large number
of dehydrogenases, reductases and oxidases [1].
Most flavoenzymes are compartmented in the cellu-
lar organelles, where they ensure the functionality of
mitochondrial electron transport, photosynthesis,
metabolism of fatty acids, some amino acids, choline
and betaine, and synthesis of vitamin B
6
, vitamin B
12
,
folate, and protoporphyrin. FAD is also the coenzyme
of glutathione reductase, which mediates regeneration
of reduced glutathione (GSH), a scavenger of free
radicals and reactive oxygen species and a modulator
of protein function by S-glutathionylation [2]. Ero1p-
and sulfhydryl oxidase-dependent folding of secretory
proteins also depend on FAD [3–5].
In plants, FAD is involved in ascorbate (ASC) bio-
synthesis and recycling, thus playing a crucial role in
cell defence against oxidative stress and in pro-
grammed cell death [6–10]. Interestingly, the last
enzyme in the ASC biosynthetic pathway, l-galactono-
lactone dehydrogenase (EC 1.3.2.3), is a mitochondrial
flavoenzyme [11–15]. A mitochondrial isoform exists
for all the other flavoenzymes involved in the ASC–
GSH cycle [14]. Thus, we expect that in plants, as
already demonstrated for human cells [2,16], Rf
Keywords
FAD synthetase; flavin; riboflavin kinase;
riboflavin transport; TBY-2 mitochondria
Correspondence
M. Barile, Dipartimento di Biochimica e
Biologia Molecolare ‘Quagliariello’ Universita
`
degli Studi di Bari, Via Orabona 4, I-70126
Bari, Italy
Fax: +39 0805443317
Tel: +39 0805443604
E-mail:
(Received 11 August 2008, revised 30
October 2008, accepted 31 October 2008)
doi:10.1111/j.1742-4658.2008.06775.x
Intact mitochondria isolated from Nicotiana tabacum cv. Bright Yellow 2
(TBY-2) cells can take up riboflavin via carrier-mediated systems that oper-
ate at different concentration ranges and have different uptake efficiencies.
Once inside mitochondria, riboflavin is converted into catalytically active
cofactors, FMN and FAD, due to the existence of a mitochondrial ribofla-
vin kinase (EC 2.7.1.26) and an FAD synthetase (EC 2.7.7.2). Newly
synthesized FAD can be exported from intact mitochondria via a putative
FAD exporter. The dependence of FMN synthesis rate on riboflavin con-
centration shows saturation kinetics with a sigmoidal shape (S
0.5
, V
max
and
Hill coefficient values 0.32 ± 0.12 lm, 1.4 nmolÆmin
)1
Æmg
)1
protein and
3.1, respectively). The FAD-forming enzymes are both activated by MgCl
2
,
and reside in two distinct monofunctional enzymes, which can be physically
separated in mitochondrial soluble and membrane-enriched fractions,
respectively.
Abbreviations
ADH, alcohol dehydrogenase; ASC, ascorbate; AtFMN ⁄ FHy, bifunctional riboflavin kinase FMN hydrolase; Cnp60p, mitochondrial
chaperone 60; D-AAO,
D-amino acid oxidase; EGFP, enhanced green fluorescent protein; FADS, FAD synthetase; FUM, fumarase; GSH,
glutathione; M
fr
, mitochondrial membrane-enriched fraction mt, mitochondria; PGI, phosphoglucoisomerase; RCI, respiratory control index;
Rf, riboflavin; RK, riboflavin kinase; SDH, succinate dehydrogenase; SDH-Fp, succinate dehydrogenase flavoprotein subunit; S
fr,
mitochondrial soluble fraction; TBY-2, Nicotiana tabacum cv. Bright Yellow 2.
FEBS Journal 276 (2009) 219–231 ª 2008 The Authors Journal compilation ª 2008 FEBS 219
deficiency or defective conversion of Rf into FAD
might cause impairment of cellular redox status regula-
tion. In plants, Rf treatment is also able to activate
signal transduction pathways, thus conferring resis-
tance to fungal infections [17]. This is in line with the
additional regulatory roles of this vitamin, already
described in yeasts [18], human cell lines [2] and
patients suffering from Rf-responsive multiple acyl-
CoA dehydrogenase deficiency [19].
Rf biosynthesis in plants, which has been described
in some detail in the last decade, is nearly identical to
that in yeast and bacteria. All of the enzymes of Rf
biosynthesis identified to date seem to reside in plastids
[17].
Conversion of Rf to FAD requires the sequential
actions of riboflavin kinase [ATP:riboflavin 5¢-phos-
photransferase (RK); EC 2.7.1.26] and FAD syn-
thetase [FMN:ATP adenylyltransferase (FADS);
EC 2.7.7.2]. In yeasts, humans and rats, distinct mono-
functional enzymes exist with either RK or FADS
activity [20–24]. The corresponding genes have been
identified and cloned for the first time in Saccharomy-
ces cerevisiae [25,26] and more recently in humans
[27,28]. In both rat liver and S. cerevisiae, FAD syn-
thesis also occurs in mitochondria, by virtue of the
existence of mitochondrial RK and FADS [26,29–32].
However, in prokaryotes, bifunctional enzymes with
RK and FADS activity [33–35] and monofunctional
enzymes with only RK activity [36] have been
described. No monofunctional FAD synthetases have
yet been found.
In plants, RK or FADS activity has been assayed
previously [37–40], and a monofunctional RK was
purified from mung bean [40]. In these earlier studies,
subcellular localization of RK and FADS was not
addressed, except for a single study carried out in spin-
ach, which revealed RK activity in the cytosol and in
an organellar fraction containing chloroplasts and
mitochondria [41].
Recently, a bifunctional RK-FMN hydrolase (At-
FMN ⁄ FHy), unique to plants, has been cloned and
characterized [42]. The bioinformatic prediction of its
localization is cytosolic. The cloning, recombinant
expression and purification of two new monofunctional
FADS enzymes from Arabidopsis thaliana (AtRibF1
and AtRibF2) was achieved by Sandoval et al. [43], as
this article was being written. Both enzymes reside in
plastids. Natural FADS activity was not detectable in
Percoll-isolated chloroplasts from pea (Pisum sativum)
[43]. As far as mitochondria are concerned, RK – but
not FADS – activity was revealed in solubilized pea
mitochondria [43]. The origin of mitochondrial FAD
in plants still needs to be clarified.
Rf uptake and metabolism in intact coupled Nicoti-
ana tabacum cv. Bright Yellow 2 (TBY-2) mitochon-
dria have been studied to elucidate the mechanism by
which plant mitochondria can provide their own FAD.
The activities of RK and FADS were also determined
in solubilized organelles. Our results are the first exper-
imental evidence that TBY-2 mitochondria are able to
take up Rf, to synthesize FAD, and to export FAD
outside mitochondria.
Results
Rf uptake and FAD export by intact TBY-2
mitochondria
The experiments described here were aimed at ascer-
taining whether and how TBY-2 mitochondria are
permeable to externally added Rf and whether Rf
taken up can be processed to give the enzymatically
active intramitochondrial cofactors FMN and FAD.
First, the purity of mitochondrial preparations start-
ing from protoplasts, prepared as in [13], was assessed
by following the enrichment of the membrane marker
succinate dehydrogenase flavoprotein subunit (SDH-
Fp) or of the matrix marker fumarase (FUM). As
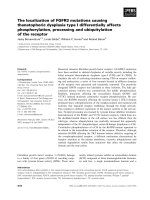
shown in Fig. 1, both proteins were about 15-fold
enriched in the mitochondrial fraction and depleted
in the fraction corresponding to plastids. The specific
activities of plastid marker enzymes phosphogluco-
isomerase (PGI, Fig. 1) and glutamate synthase (data
not shown) were six-fold enriched in the plastid frac-
tion and depleted in the mitochondrial fraction. The
cytosolic marker enzyme alcohol dehydrogenase
(ADH) [44] was significantly depleted, with a specific
activity five-fold lower in the mitochondrial fraction
than in protoplasts (Fig. 1).
The mitochondrial and the extramitochondrial
amounts of Rf, FMN and FAD in the acid-extractable
fractions were measured via HPLC and compared to
the amounts of flavin cofactors in whole protoplasts
and plastids (Table 1). In three experiments performed
with different preparations, the endogenous FAD,
FMN and Rf contents in TBY-2 mitochondria were
equal to 290 ± 66, 132 ± 51 and 2 ± 1 pmolÆmg
)1
protein, respectively (Table 1). No flavin cofactor was
detected in the postmitochondrial supernatant; this is
in line with the mitochondrial membrane integrity. It
should also be noted that plastids contain a significant
amount of flavin cofactors, which tallies with the
presence of the large number of flavoenzymes in this
subcellular compartment [17].
As Rf metabolism is expected to depend on
the organelle energy state, the functional features of
Rf uptake and metabolism in TBY-2 mitochondria T. A. Giancaspero et al.
220 FEBS Journal 276 (2009) 219–231 ª 2008 The Authors Journal compilation ª 2008 FEBS
TBY-2 mitochondria were checked in a series of preli-
minary experiments by polarographic measurements of
the oxygen uptake rate starting from either NADH or
succinate, essentially as in [18]. In a typical experiment
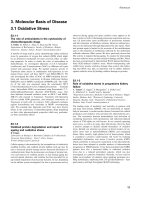
(Fig. 2A), TBY-2 mitochondria respired with NADH
(1 mm) at a rate equal to 61 nmol O
2
Æmin
)1
Æmg
)1
protein. When ADP (0.1 mm) was added, the oxygen
uptake rate increased up to 164 nmol O
2
Æmin
)1
Æmg
)1
protein, with a respiratory control index (RCI) value
equal to 2.7. When succinate (5 mm) was used as
substrate (Fig. 2B), the oxygen uptake rate, equal to
47 nmol O
2
Æmin
)1
Æmg
)1
protein in the absence of
ADP, increased up to 70 nmol O
2
Æmin
)1
Æmg
)1
protein
in the presence of ADP (with an RCI value equal to
1.5). In three experiments, performed with different
mitochondrial preparations, TBY-2 mitochondria
showed RCI values ranging from 2.0 to 3.0 and from
1.4 to 1.8 with NADH and succinate, respectively,
used as substrates.
In a set of experiments, Rf (0.2–30 lm) was added
to purified intact TBY-2 mitochondria, and flavin
changes over the endogenous values were measured by
HPLC. Experimental data were collected within the
initial linear range of Rf uptake rates (i.e. 20 s of incu-
bation) and were corrected for adherent ⁄ bound
vitamin as described in Experimental procedures. Data
were expressed as rates of flavin transport ⁄ synthesis in
relation to Rf concentration (Fig. 3).
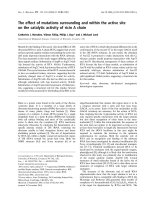
At the lower concentrations of Rf used (0.2–3.0 lm),
no increase in mitochondrial Rf, FMN and FAD con-
tents was observed (Fig. 3, mt Pellet), whereas FAD
appeared in the extramitochondrial phase (Fig. 3,
mt SN). This observation is consistent with the occur-
rence of FAD export into the postmitochondrial super-
natant, following Rf import and intramitochondrial
FAD synthesis. No appearance of FMN was observed
in the postmitochondrial supernatant. Owing to the
rapid conversion of Rf into FAD and its rapid efflux in
the postmitochondrial supernatant, the rate of FAD
export matched with the rate of Rf uptake (Fig. 3,
mt SN). The dependence of the ‘apparent’ Rf uptake
rate on vitamin concentration showed saturation
characteristics, with a maximum of about 117
pmolÆmin
)1
Æmg
)1
protein at 0.4 lm (Fig. 3, mt SN). At
Rf concentrations higher than 0.4 lm (Fig. 3, mt SN)
the rate of FAD export decreased. These limitations
prevented a detailed characterization of the transport
process. However, by fitting the first set of data (up to
0.4 lm Rf) according to the Michaelis–Menten equation
[Eqn (1) in Experimental procedures], ‘apparent’ K
m
Pr
oto
Specific activity (nmol·min
–1
·mg
–1
protein) Specific activity (nmol·min
–1
·mg
–1
protein)
Specific activity (nmol·min
–1
·mg
–1
protein) SDH-Fp (·10
3
A·mm
2
·mg
–1
protein)
m
t
Pl
ast
i
ds
Pr
oto
m
t
Pl
ast
i
ds
Proto mt Plastids Proto mt Plastids
Proto mt Plastid
PGI ADH
FUM
α-F
A
D
SDH-Fp
100
250
200
150
100
50
0
250
300
200
150
100
50
0 0
40
80
120
160
200
80
60
40
20
0
Fig. 1. Purity of TBY-2 mitochondria. In TBY-2 protoplasts (proto),
mitochondria (mt) and plastids (0.05–0.1 mg) the amount of SDH-
Fp, detected with a-FAD, and the FUM, PGI and ADH activities
were measured, as reported in Experimental procedures. The
values of the enzymatic activities are the mean (± SD) of three
experiments performed with different cellular preparations.
Table 1. Endogenous flavin content in TBY-2 mitochondria. Intact
TBY-2 mitochondria, resuspended in isotonic medium, were rapidly
centrifuged at 15 000 g for 5 min to obtain a mitochondrial pellet
and a postmitochondrial supernatant. Flavin content was deter-
mined in neutralized perchloric acid extracts of mitochondrial pellet,
postmitochondrial supernatant, protoplasts and plastids by HPLC,
as described in Experimental procedures. The means (± SD) of the
flavin endogenous content determined in three experiments
performed with different preparations are reported. ND, not
detectable.
Endogenous flavin content
(pmolÆmg
)1
protein)
FAD FMN Rf
Mitochondrial pellet 290 ± 66 132 ± 51 2 ± 1
Postmitochondrial supernatant ND ND ND
Protoplasts 246 ± 4 114 ± 2 10 ± 1
Plastids 842 ± 13 360 ± 10 13 ± 1
T. A. Giancaspero et al. Rf uptake and metabolism in TBY-2 mitochondria
FEBS Journal 276 (2009) 219–231 ª 2008 The Authors Journal compilation ª 2008 FEBS 221
and V
max
were calculated; their values were 0.09 lm and
145 pmolÆmin
)1
Æmg
)1
protein, respectively.
When Rf concentration was increased in the range
from 10 to 30 lm, a significant increase in Rf amount
was observed in the mitochondrial pellet (Fig. 3,
mt Pellet), with a concomitant reduction in the rate of
FAD appearance in the postmitochondrial supernatant
(Fig. 3, mt SN). Under these experimental conditions,
the dependence of the Rf uptake rate on the postmi-
tochondrial supernatant showed saturation characteris-
tics with a sigmoidal shape (Fig. 3, inset, mt Pellet).
Data fitting was performed according to allosteric
kinetics [Eqn (2) in Experimental procedures] with a
Hill coefficient equal to 2.6. The kinetic parameters,
expressed as ‘pseudo’ S
0.5
and V
max
, were 9.2 lm and
9.3 nmolÆmin
)1
Æmg
)1
protein, respectively.
To ensure that the FAD appearance observed at low
Rf concentrations was not due to extramitochondrial
metabolism, FMN (1 lm) and ATP (1 mm) were
added to the postmitochondrial supernatant, collected
from intact mitochondria or from mitochondria dis-
rupted by either osmotic shock or digitonin treatment
(Fig. 4). In intact mitochondria, there was no FAD
appearance, but conversion of FMN to Rf was
observed (4.2 pmol in 15 min of incubation; Fig. 4A).
This was presumably due to FMN hydrolase activity
(EC 3.1.3.2) [42,45]. After disruption of the mitochon-
drial membranes, FAD synthesis, as well as FMN
hydrolysis, was seen in the mitochondria disrupted by
digitonin treatment (8.7 pmol FAD; Fig. 4A), thus
proving the existence of FADS activity in the mito-
chondrial inner compartment. As a control (Fig. 4B),
disruption of the mitochondrial inner membrane integ-
rity was evaluated by measuring both the latency of
the matrix marker enzyme FUM and the release of a
58 kDa protein [mitochondrial chaperone 60
(Cnp60p)], revealed by western blotting.
Taken together, these results strongly favour the
existence of (at least) two transport systems involved
Oxygen decrease
TBY-2
NADH (1 m
M
)
ADP (0.1 m
M
)
ADP (0.1 m
M
)
Succinate (5 m
M
)
ADP (1 m
M
)
KCN (1 m
M
)
ADP (1 m
M
)
KCN (1 m
M
)
117
58
70
47
2 min
360 nmol O
2
·mg protein
–1
61
164
mt
TBY-2
mt
AB
Fig. 2. Polarographic measurements of the NADH-dependent (A) and succinate-dependent (B) oxygen uptake rate in TBY-2 mitochondria.
TBY-2 mitochondria (0.1 mg) were incubated in respiration medium, as described in Experimental procedures. The additions were made at
the points indicated by arrows. The numbers along the trace refer to the oxygen uptake rate expressed as nmol O
2
Æmin
)1
Æmg
)1
protein.
0
0
30
60
90
120
150
0
2000
4000
6000
8000
10 000
mt Pellet
I-mt SN
0
0 5 10 15 20 25 30 35
2000
4000
6000
8000
10 000
0.5 1.51 2 2.5
Riboflavin concentration (µ
M)
Flavin transport /synthesis rate (pmol·min
–1
·mg
–1
protein)
Riboflavin concentration (µM)
FAD
Rf
3.0
10 20 30
Fig. 3. Riboflavin uptake by and FAD export from intact TBY-2
mitochondria. Intact TBY-2 mitochondria (0.1–0.2 mg) were incu-
bated at 2 °C in 500 lL of transport medium. The uptake reaction
was started by addition of Rf at the indicated concentrations, and
stopped 20 s later by rapid centrifugation. Rf actually taken up in
the mitochondrial pellet (mt pellet) (e) and FAD in the intact mito-
chondria supernatant (I-mt SN) (d) were determined in neutralized
perchloric acid extracts by HPLC, as described in Experimental
procedures. The y-axis represents the flavin transport ⁄ synthesis
rates expressed as pmolÆmin
)1
Æmg
)1
protein. Values are the mean
of three replicates (± SD) performed using the same mitochondrial
preparation.
Rf uptake and metabolism in TBY-2 mitochondria T. A. Giancaspero et al.
222 FEBS Journal 276 (2009) 219–231 ª 2008 The Authors Journal compilation ª 2008 FEBS
in Rf uptake into ⁄ FAD export out of mitochondria, as
already observed in mitochondria from mammals and
yeasts [29–32]. Moreover, the data here reported imply
the existence of intramitochondrial enzymes that allow
for FMN and FAD synthesis starting from exogenous
Rf and endogenous ATP.
RK and FADS – Rf-metabolizing activities in
TBY-2 mitochondria
In a further set of experiments, TBY-2 mitochondria
were ruptured by osmotic shock or solubilized by
detergent treatment (i.e. digitonin or Lubrol PX). Rup-
tured TBY-2 mitochondria were incubated for different
incubation times (ranging from 1 to 60 min) at 37 °C
with ATP (1 mm) and either Rf or FMN in the pres-
ence of MgCl
2
(5 mm) (Fig. 5). The amounts of FAD,
FMN and Rf in the neutralized perchloric acid
extracts of the suspension were measured by HPLC.
Data were subtracted for endogenous FAD and FMN
contents, which were equal to 243 ± 55 and
172 ± 16 pmolÆmg
)1
protein, respectively, in the
experiment reported in Fig. 5. A control was also set
up so that the endogenous flavin cofactor content
remained constant during the incubation period (data
not shown).
With Rf (0.5 lm) as a substrate, FMN rapidly
appeared in the mitochondrial suspension according to
the existence of RK activity (Fig. 5A). The time course
of FMN synthesis was described by a pseudo-first-
order rate equation in which the amount of FMN
increased linearly with time up to 773 pmolÆmg
)1
protein, at a rate equal to 1.1 nmolÆmin
)1
Æmg
)1
protein. FMN synthesis was accompanied by the
appearance of a small amount of FAD, at a rate of
4.5 pmolÆmin
)1
Æmg
)1
protein. The dependence of FMN
synthesis rate on the substrate concentration showed
saturation characteristics with a sigmoidal shape. Data
A
B
70
I-mt SN D-mt SN
Rf
FAD
mV
FAD
Rf
60
50
40
30
20
10
250
120
100
80
60
40
20
0
200
150
100
50
0
0
4 6 8
Time (min)
FUM
α-Cnp
Cnp60p
I D
mt SN
OS
I D OS
I D
mt SN
Specific activity (nmol·min
–1
·mg
–1
protein)
Cnp60p (·10 A min
2
mg
–1
protein)
OS
10 12
4 6 8
Time (min)
10 12
Fig. 4. FMN metabolism in the postmitoc-
hondrial supernatant. Postmitochondrial
supernatants (0.1–0.2 mg) were collected
from either intact (I-mt SN), digitonin-solubi-
lized (D-mt SN) or osmotically shocked (OS-
mt SN) TBY-2 mitochondria, as described in
Experimental procedures. (A) I-mt SN and
D-mt SN were incubated at 37 °C for up to
15 min with FMN (1 l
M) and ATP (1 mM)in
500 lLof50m
M Tris ⁄ HCl (pH 7.5), and the
flavin amount was determined in neutralized
perchloric acid extracts by HPLC. (B) FUM
activity and the amount of Cnp60p, detected
with a-Cnp, were measured in the I-mt SN,
D-mt SN and OS-mt SN. Values, reported in
the histogram, are the mean (± SD) of three
replicates performed using the same mito-
chondrial preparations.
T. A. Giancaspero et al. Rf uptake and metabolism in TBY-2 mitochondria
FEBS Journal 276 (2009) 219–231 ª 2008 The Authors Journal compilation ª 2008 FEBS 223
fitting according to allosteric kinetics (Eqn 2) gave a Hill
coefficient equal to 3.1, and S
0.5
and V
max
values equal
to 0.32 ± 0.12 lm and 1375 ± 45 pmolÆmin
)1
Æmg
)1
protein, respectively (Fig. 5B). The FMN synthesis rate
was inhibited when the Rf concentration was raised to
30 lm (Fig. 5B), and totally inhibited when either
Mg
2+
was omitted or EDTA (1 mm) was added to the
incubation mixture (data not shown).
With FMN (1 lm) as a substrate, mitochondrial
FAD synthesis was observed (Fig. 5C). The time
course of conversion of FMN to FAD was described
by a pseudo-first-order rate equation in which the
amount of FAD increased linearly with time up
to 81 pmolÆmg
)1
protein at a rate equal to 5 pmolÆ
min
)1
Æmg
)1
protein. Following 1 h of incubation,
FMN hydrolysis was detected, with 20 pmolÆmg
)1
protein of Rf being present in the mitochondrial sus-
pension. When the FMN concentration was increased
to 50 lm (Fig. 5D), the amount of FAD increased
almost linearly in the first 10 min of the reaction, at a
rate of 413 pmolÆmin
)1
Æmg
)1
protein. The amount of
FAD reached a maximum value of 3600 pmolÆmg
)1
protein within 15 min of incubation. Prolonging the
incubation time resulted in a significant decrease in
the amount of FAD. With prolonged incubation, the
hydrolytic process became relevant, causing a progres-
sive increase in Rf at a rate equal to 131 pmolÆmi-
n
)1
Æmg
)1
protein. Because of FMN hydrolysis, a
correct estimation of the kinetic parameters of FADS
in such a ‘crude’ mitochondrial extract was not possi-
ble. Both FAD formation and FMN hydrolysis were
prevented by omitting Mg
2+
(data not shown).
The amount of endogenous FAD and the rate of
FAD formation in solubilized mitochondria were also
measured in a continuous spectrophotometric assay by
using the apoenzyme of d-amino acid oxidase
(EC 1.4.3.3) in a coupled enzymatic assay, described in
Fig. 6 and in more detail in [30,32]. A typical experi-
ment is reported in Fig. 6B. Solubilized mitochondria
(Fig. 6B, dotted line) were incubated first in the
absence of the FADS substrate pair ()FMN, )ATP).
A decrease in NADH absorbance was observed, corre-
sponding to 246 pmolÆmg
)1
protein of mitochondrial
endogenous FAD, which is expected to be loosely
bound and ⁄ or not bound to protein. The value here
tallies pretty well with the value obtained from HPLC
measurements (Table 1). Solubilized mitochondria
were then ultrafiltered prior to the assay (Fig. 6B,
dashed and continuous lines), with the aim of remov-
ing endogenous intramitochondrial flavins that could
inhibit FAD synthesis. Consistently, no FAD could be
detected in the absence of the FADS substrate pair
0 10
0
20
40
60
80
100
0
200
400
600
800
1000
0
300
600
900
1200
1500
4000
D C
A
B
3000
2000
1000
0
20 30
Time
(
min
)
40 50 60
0 5 10 15
Time (min)
FAD
FAD
FMN
Rf
Rf
FAD
40 60
0 10 20 30
Time
(
min
)
Flavin (pmol·mg
–1
protein)
Flavin (pmol·mg
–1
protein) Flavin (pmol·mg
–1
protein)
FMN synthesis rate
(pmol·min
–1
·mg
–1
protein)
40 50 60
0 0.5 1 1.5
Riboflavin concentration (µ
M)
2 20 30
Fig. 5. Rf and FMN metabolism in
osmotically shocked TBY-2 mitochondria.
Osmotically shocked TBY-2 mitochondria
(0.1–0.2 mg) were incubated at 37 °Cin
500 lLof50m
M Tris ⁄ HCl (pH 7.5) supple-
mented with ATP (1 m
M) and MgCl
2
(5 mM),
in the absence or presence of either Rf or
FMN. At the appropriate times, the reaction
was stopped, and Rf (e), FMN (n) and FAD
(d) contents were determined in neutralized
perchloric acid extracts by HPLC, corrected
for endogenous flavin content. (A) Time
course of FMN and FAD synthesis after
addition of 0.5 l
M Rf. (B) Dependence of
the rate of FMN synthesis on Rf concentra-
tions. (C,D) Time courses of FAD synthesis
and Rf appearance after addition of either
1 l
M or 50 lM FMN. Values are the mean
of three replicates (± SD) performed using
the same mitochondrial preparations.
Rf uptake and metabolism in TBY-2 mitochondria T. A. Giancaspero et al.
224 FEBS Journal 276 (2009) 219–231 ª 2008 The Authors Journal compilation ª 2008 FEBS
(Fig. 6B, dashed line, )FMN, )ATP) or in the absence
of either FMN or ATP alone. Upon incubation of
ultrafiltered solubilized mitochondria with both FMN
and ATP (Fig. 6B, continuous line, +FMN, +ATP),
FAD synthesis was observed with a rate equal to
2.5 pmolÆmin
)1
. This rate was linearly related to
the amount of the mitochondrial protein used
(74 pmolÆmin
)1
Æmg
)1
protein; Fig. 6C), corresponding
to a total mitochondrial activity of 488 pmolÆmin
)1
at
1 lm FMN. When the ultrafiltration procedure was
omitted, the rate of formation of FAD by solubilized
mitochondria (+FMN, +ATP, data not shown) was
about 10-fold lower, and therefore in broad agreement
with the rate calculated via HPLC (Fig. 5C).
From the results obtained using TBY-2 mitochon-
dria, we could not establish whether the mitochondrial
RK and FADS activities reside in a single bifunctional
enzyme, such as RibC in Bacillus subtilis [33], or
whether they are two distinct enzymes as in other
eukaryotes. To overcome this problem, we searched
for conditions in which the two activities might be
physically separated. Therefore, RK and FADS were
checked in a mitochondrial-soluble fraction (S
fr
) and
in a mitochondrial membrane-enriched fraction (M
fr
),
obtained as described under Experimental procedures,
and compared with those of FUM and SDH, used as
matrix and inner mitochondrial membrane marker
enzymes, respectively (Fig. 7). When RK substrate
pairs were added to S
fr
(Fig. 7A) or M
fr
(Fig. 7A¢), 3.5
and 0.6 pmol of newly synthesized FMN were deter-
mined respectively in the two fractions. About 85.5%
of total RK activity was recovered in the S
fr
, in fairly
good accordance with the matrix marker enzyme
FUM activity (the total activity recovered in the S
fr
being equal to 82.5% in Fig. 7C). When the FADS
substrate pair was used, 1.5 and 2.1 pmol of newly
A
B
C
NADH,H
+
H
2
O
2
O
2
H
2
O
NH
4
FAD D.S.
4
3
2
1
0
0 0.01 0.02 0.03
Protein amount (mg)
(– FMN, –ATP)
(– FMN, – ATP)
(+ FMN, + ATP)
FAD synthesis rate (pmol·min
–1
)
A
340
decrease
0.04 0.05
FAD FMN
FADS
PPi
AT P
D-Ala
ΔA = 0.1
2 min
apo-DAAO
NAD
+
LDH
Olo-DAAO
Lac
Pyr
D-Ala
+
Fig. 6. Enzymatic evidence of FAD synthesis in solubilized TBY-2 mitochondria. The amount of FAD was enzymatically assayed in
Lubrol PX-solubilized TBY-2 mitochondria, as shown in (A) and described in Experimental procedures. An aliquot of solubilized TBY-2 mito-
chondria was depleted of free flavins and other low molecular mass molecules by ultrafiltration procedures. (B) Solubilized (dotted line) or
ultrafiltered solubilized (dashed and continuous lines) TBY-2 mitochondria were incubated with or without FAD substrate pairs (FMN 1 l
M
and ATP 1 mM) for 15 min at 37 °C in 100 lLof50mM Tris ⁄ HCl (pH 7.5) supplemented with MgCl
2
(5 mM). (C) The dependence on
protein amount of the rate of FAD synthesis in ultrafiltered solubilized TBY-2 mitochondria is reported.
T. A. Giancaspero et al. Rf uptake and metabolism in TBY-2 mitochondria
FEBS Journal 276 (2009) 219–231 ª 2008 The Authors Journal compilation ª 2008 FEBS 225
synthesized FAD were determined, respectively, in the
S
fr
(Fig. 7B) and in the M
fr
(Fig. 7B¢). With regard to
total FADS activity, about 60% was recovered in the
M
fr
, in fairly good agreement with the 65% recovery
of the SDH enzymatic activity (Fig. 7C¢). Taken
together, these findings show that mitochondrial RK
and FADS activities reside in distinct enzymes that are
physically separated in the S
fr
and M
fr
, respectively.
Discussion
Because of its importance in energetic metabolism, as
well as in human and animal nutrition [1,17,46,47], the
biosynthetic pathway of several vitamins and coen-
zymes is one of the more interesting topics for
biochemical analysis in plants.
The experiments described here deal with the mecha-
nism by which plant mitochondria obtain their own
flavin cofactors, starting from Rf synthesized de novo
in the plastids [17]. To this end, use was made of
bioenergetically active and highly purified mitochon-
dria prepared starting from protoplasts of TBY-2 cells,
which can take up externally added Rf via saturable
mechanisms that operate at different concentration
ranges and have different uptake efficiencies.
At the lower concentration of Rf used (0–3.0 lm),
which roughly corresponds to the physiological con-
centration of the vitamin measured in protoplasts, no
flavins accumulate in the organelle. Conversely, FAD
is the only flavin cofactor detected in the postmitoc-
hondrial supernatant. These results are in line with the
existence of both a mitochondrial FAD synthesis path-
way and a mitochondrial FAD exporter, as in rat liver
and S. cerevisiae mitochondria [30–32]. Indeed, the
rate of FAD appearance depends on up to five events:
Rf uptake, conversion into FMN, conversion of FMN
A
mV
mV
Time (min)
FMN
Rf
FAD
FMN
FMN
FAD
FMN
Rf
15 7
6
5
4
3
2
1
0
mV
Enzyme activity (nmol·min
–1
)
7
12
10
8
6
4
2
0
Enzyme activity (nmol·min
–1
)
12
10
8
6
4
2
0
6
5
4
3
2
1
0
12
9
6
3
0
mV
15
12
9
6
3
0
4 6 8 10 12
Time (min)
4 6 8 10 12
Time (min)
FUM SDH
FUM SDH
4 6 8 10 12
Time (min)
4 6 8 10 12
B C
A′
′
B
′
C
′
Fig. 7. Distribution of the RK and FADS activities in the mitochondrial subfractions. Soluble (S
fr
) (A–C) and membrane-enriched (M
fr
)(A¢–C¢)
fractions, obtained from TBY-2 mitochondria as described in Experimental procedures, were assayed for mitochondrial RK (A,A¢) and FADS
(B,B¢), as in Fig. 5. As a control in the same fractions, the total activities of FUM and SDH (C,C¢), used as mitochondrial matrix and inner
membrane marker enzymes, were determined.
Rf uptake and metabolism in TBY-2 mitochondria T. A. Giancaspero et al.
226 FEBS Journal 276 (2009) 219–231 ª 2008 The Authors Journal compilation ª 2008 FEBS
into FAD, FAD export, and inhibition of FMN syn-
thesis. At least under our in vitro conditions, at low
vitamin concentrations, Rf uptake is expected to be
the rate-limiting step of the overall process, as no
intermediates accumulate. Thus, the kinetic parameters
of the Rf transporter are calculated from those
describing FAD appearance in the postmitochondrial
supernatant.
When higher Rf concentration are used (10–30 lm),
Rf transport rate increases, causing high Rf concentra-
tions inside the limited space of the mitochondrial
matrix. Under this condition, mitochondrial RK is
completely inhibited (see below and [30–32]). This
results in Rf accumulation in the organelle and no
FAD export in the postmitochondrial supernatant. In
this concentration range, the sigmoidal shape might be
characteristic of the Rf transporter itself. Whether or
not, in vivo, such high concentrations of Rf could
physiologically be realized, it might still be a possibility
in microcompartments of the intramembrane space
during the recycling hydrolytic pathway of mitochon-
drial FAD [45].
Further experiments are in progress to identify suit-
able inhibitors of flavin transport across mitochondrial
membrane and to further characterize and to identify
the mitochondrial Rf uptake and FAD export trans-
porter(s).
At present, we have no putative candidate gene
encoding any mitochondrial Rf transporter. In fact,
fasta searches ( />using as query sequences the first identified prokaryotic
Rf transporter, YpaA from B. subtilis [48], the first
identified eukaryotic plasma membrane Mch5p from
S. cerevisiae [49], and the novel identified human and
rat riboflavin plasma membrane transporters (hRFT1
and rRFT1) [50], revealed no sequence homologs in
either A. thaliana or Oryza sativa. In contrast, fasta
searches revealed more than 30 sequence homologs of
the mitochondrial FAD exporter (Flx1p) from S. cere-
visiae [32,51]. Among these, a mitochondrial localiza-
tion is predicted for two uncharacterized proteins
encoded by At1g25380 and At2g47490 in A. thaliana
(see The Arabidopsis Information Resource database,
TAIR, ), and for the
uncharacterized protein encoded by Os03g0734700 in
O. sativa (see UniProt ⁄ TrEMBL database, http://
www.ebi.ac.uk/trembl). The hypothesis that these
proteins are orthologs of Flx1p is at the moment
under investigation.
In this article, we also give the first experimental evi-
dence for the existence of a FADS in plant mitochon-
dria, which catalyses FAD synthesis from FMN and
ATP, and we confirm the existence of a mitochondrial
RK [26,30–32,41,43]. Using ruptured mitochondria,
functional characterization of the mitochondrial RK
and FADS was performed (Figs 5–7). Both of the
TBY-2 mitochondrial FAD-forming enzymes are acti-
vated by MgCl
2
, a feature common to other RK(s)
and FADS(s) previously characterized from prokary-
otic and eukaryotic sources [20–22,27,28,33–42].
The dependence of the rate of FMN synthesis on Rf
concentration shows saturation characteristics with a
sigmoidal shape. The S
0.5
value of RK is in the same
order of magnitude as the K
m
measured for the RK
partially purified from the plant Solanum nigrum [39],
and one order of magnitude higher than the K
m
value
of the bifunctional AtFMN ⁄ FHy enzyme from A. tha-
liana [42]. Earlier enzymological studies [52] and latest
structural data [24] suggest that the activity of RK(s)
is largely regulated by the relative concentrations of
substrates ⁄ products, as well as by specific interactions
with other regulators (i.e. bivalent cations).
A detailed kinetic study of FADS is prevented by
the rapid conversion of FMN to Rf, stimulated by
MgCl
2
. This is expected to be due to an FMN hydro-
lase activity, present in the ruptured TBY-2 mitochon-
dria. Plant FMN hydrolases have been recently
assayed in both chloroplast and mitochondrial extracts
from pea. Owing to this high FMN-hydrolysing activ-
ity, no natural FADS activity has been detected before
in plants [43]. We succeeded in detecting FADS activ-
ity in ruptured TBY-2 mitochondria by HPLC and
then enzymatically. The approximately 100-fold
increase in the initial rate of FADS production, which
we have measured with increasing FMN concentra-
tions from 1 to 50 lm (Fig. 5C,D), is consistent with
the K
m
values (18–20 lm) determined for the mono-
functional recombinant FADS(s) [43]. It can be argued
that in ruptured mitochondria, unlike in intact organ-
elles, FMN appears and its concentration exceeds that
of FAD (compare Figs 5 and 3). The simplest explana-
tion for this is based on the existence of ‘channelling’
between RK and FADS in intact mitochondria, which
is lost in ruptured mitochondria.
Indeed, our studies revealed that RK and FADS are
two physically separated enzymes, one being found in
the mitochondrial matrix and the other being mem-
brane associated.
The genes encoding organellar RK(s) remains
unidentified. The products of AtRibF1 and AtRibF2,
homologs of the bifunctional bacterial RibC and
recently characterized in A. thaliana, perform only
FADS activity. Conversely, AtFMN ⁄ FHy is the cyto-
solic RK [42].
Our fractionation studies reveal that mitochondrial
FADS activity in TBY-2 mitochondria represents
T. A. Giancaspero et al. Rf uptake and metabolism in TBY-2 mitochondria
FEBS Journal 276 (2009) 219–231 ª 2008 The Authors Journal compilation ª 2008 FEBS 227
about 3% of the total activity determined in the pro-
toplasts, as estimated by comparison with the distribu-
tion of the marker enzyme FUM, and assuming that
the highest amount of FUM activity is present in the
mitochondrial fraction. Conversely, FADS activity is
maximally present in plastids (its specific activity at
1 lm FMN is equal to 466 pmolÆmin
)1
Æmg
)1
protein,
i.e. 23% of the total activity determined in the protop-
lasts); the same distribution is obtained for the plastid
marker enzyme PGI. These results tally well with con-
focal microscopy studies carried out on A. thaliana
protoplasts transformed with enhanced green fluores-
cent protein (EGFP)–AtRibF1 or EGFP–AtRibF2
[43]. The hypothesis for the localization of FADS
(AtRibF1 and AtRibF2) isoforms in mitochondria
cannot, moreover, be ruled out on the basis of bioin-
formatics (see TAIR). Whether and how it can be
achieved remains to be established.
The final picture emerging is that of cross-talk
between plastids, cytosol and mitochondria during
flavin cofactor biosynthesis, which completes the
scheme reported in [43]. Rf is synthesized de novo in
plastids [17] and converted therein into FMN and
FAD [41,43]. Alternatively, Rf can be exported into
the cytosol and taken up by mitochondria, where an
autonomous FAD-forming pathway is expected to
respond to the demand for nascent apoflavoprotein
deriving from outside [53–55]. Mitochondrial FAD in
plants, as well as in yeasts [18,31] and mammals [30],
can also be exported to the cytosol. Whether or not
the exported FAD participates in regulating the
expression of nascent mitochondrial flavoproteins, as
in yeast [18], remains an intriguing question for future
analysis.
Experimental procedures
Materials
All reagents and enzymes were from Sigma-Aldrich
(St Louis, MO, USA). Mitochondrial substrates were used
as Tris salts at pH 7.0. Solvents and salts used for HPLC
were from J. T. Baker (Deventer, The Netherlands).
Cell culture
TBY-2 cells were routinely propagated and cultured at
27 °C, essentially as described in [13].
Protoplast, mitochondria and plastid preparation
Protoplasts were obtained from TBY-2 cells (50 g) washed
with a preplasmolysis buffer (0.65 m mannitol and 25 mm
Tris ⁄ Mes, pH 5.5) and treated with Caylase (Cayla, Tou-
lose, France) and pectinase (Sigma-Aldrich), as described in
[13]. Intact purified mitochondria and plastids were
obtained by protoplast fractionation and lysis, followed by
differential centrifugation and by a self-generated Percoll
density gradient (0–40%), as described in [13]. Protoplasts,
mitochondria and plastids were ruptured by osmotic shock
by resuspending them in a washing medium without manni-
tol (hypotonic medium) or by treatment with the detergent
Lubrol PX (0.3 mgÆmg
)1
protein) or digitonin (0.4 mgÆ mg
)1
protein). Postmitochondrial supernatant was collected from
either intact, osmotically shocked or digitonin-treated mito-
chondria after centrifugation at 15 000 g for 5 min. Mito-
chondria ruptured by osmotic shock were centrifuged at
20 000 g for 30 min to separate S
fr
and M
fr
, as in [13]. The
protein concentration was assayed according to Bradford
[56].
Mitochondrial integrity and oxygen uptake
measurements
The intactness of mitochondrial inner membranes was
checked by measuring the release of the matrix FUM, as in
[57]. Oxygen uptake measurements were carried out at
25 °C using a Gilson 5 ⁄ 6 oxygraph with a Clark electrode.
Mitochondria (0.1 mg) were added to 1.5 mL of respiration
medium containing 0.3 m mannitol, 10 mm Hepes, 5 mm
MgCl
2
,10mm KCl and 0.1% BSA (the pH of the medium
was adjusted to 7.2 with NaOH). NADH (1 mm) or succi-
nate (5 mm) was used as a respiratory substrate. The rate
of oxygen uptake, measured as the tangent to the
initial part of the progress curve, was expressed as nmo-
lO
2
Æmin
)1
Æmg
)1
protein.
Rf uptake and metabolism
Freshly isolated mitochondria (0.1–0.2 mg of protein)
were incubated at 2 °C in 500 lL of transport medium
consisting of 0.3 m mannitol, 10 mm Hepes and 5 mm
MgCl
2
(the pH was adjusted to 7.5 with NaOH). One
minute later, Rf was added. At the appropriate time, the
uptake reaction was stopped by rapid centrifugation. Rf,
FMN and FAD contents of supernatants and pellets
were measured in aliquots (5–80 lL) of neutralized per-
chloric acid extracts by means of HPLC (Gilson HPLC
system including a model 306 pump and a model 307
pump equipped with a Kontron Instruments SFM 25
fluorimeter and unipoint system software), and corrected
for endogenous flavin content, essentially as described in
[32]. The amount of flavin actually taken up into the
organelle was calculated after correction was made for
molecules present in the adherent space and ⁄ or nonspecif-
ically bound to the membranes, as described elsewhere
[32].
Rf uptake and metabolism in TBY-2 mitochondria T. A. Giancaspero et al.
228 FEBS Journal 276 (2009) 219–231 ª 2008 The Authors Journal compilation ª 2008 FEBS
RK and FADS activity assay
Detergent-solubilized or osmotically shocked mitochondria
or postmitochondrial supernatants (0.1–0.2 mg) were prein-
cubated at 37 °C for 1 min in 500 lL of a medium consisting
of 50 mm Tris ⁄ HCl (pH 7.5); where indicated, 5 mm MgCl
2
or 1 mm EDTA was added. Either Rf or FMN (at the indi-
cated concentrations) and ATP (1 mm) were added in order
to assay for RK or FADS activity, respectively. At the
appropriate time, 50 lL aliquots were taken, extracted with
perchloric acid, and neutralized. Rf, FMN and FAD were
analysed using HPLC (see above). The amount of FAD was
also measured enzymatically by using the FAD-detecting
system, as described in [30,32]. Briefly, the amount of FAD
was determined by revealing the reconstituted holo-d-amino
acid oxidase (D-AAO) activity derived from FAD binding
to the apo-D-AAO, using d-alanine (25 mm) as substrate.
The rate of NADH oxidation in the l-lactate dehydro-
genase-coupled reaction was followed spectrophoto-
metrically at 340 nm by means of a Perkin Elmer k19
spectrophotometer, and calculated as a tangent to the linear
part of the progress curve. This rate was proven to be pro-
portional to FAD concentration. Calibration curves were
obtained by using standard FAD solutions, and corrections
were also made to account for the inhibition due to FMN
and ATP added to the reconstitution assay.
Western blotting
Proteins from protoplasts, mitochondria and plastids were
separated by SDS ⁄ PAGE [58] and transferred as in [32].
The immobilized proteins were incubated with a 2000-fold
dilution of either a polyclonal antibody against FAD cova-
lently bound to proteins (i.e. a-FAD, a kind gift from
R. Brandsch, Freiburg, Germany; for details see [32]) or an
antiserum against the chaperonin (i.e. a-Cnp, a kind gift
from C. Indiveri, Universita
`
della Calabria, Calabria, Italy).
a-FAD- and a-Cnp-immunoreactive materials were visual-
ized with the aid of a secondary alkaline phosphatase-
conjugated anti-rabbit IgG. Quantitative evaluations were
carried by densitometric analysis using imagequant 5.2
Software (Molecular Dynamics, Sunnyvale, CA, USA).
Other enzymatic assays
SDH and PGI activities were measured as in [18]. Gluta-
mate synthase activity was determined by measuring the
decrease of absorbance at 340 nm due to NADH oxidation
in a reaction mixture containing 50 mm sodium phosphate
buffer (pH 7.5), 10 mm 2-oxoglutarate, 10 mm glutamine
and the biological sample, essentially as described in [59].
ADH activity was tested by measuring the increase in
absorbance at 340 nm due to NAD
+
reduction after addi-
tion of 20% ethanol in a reaction mixture containing
50 mm Tris ⁄ HCl (pH 9) and 0.867 mm NAD
+
[44].
Kinetic data analysis
Data fitting was performed according to either the
Michaelis–Menten equation:
v ¼ V
max
S=ðK
m
þ SÞð1Þ
or the allosteric kinetics equation
v ¼ V
max
S
n
=ðK
m
þ S
n
Þð2Þ
where S
0.5
=
n
ÖK
m
.
To fit the experimental data and to obtain estimates of
the kinetic parameters, use was made of the grafit soft-
ware (Version 3.00, 1992, by R. J. Leatherbarrow, Eritha-
cus Software, Horley, UK).
Acknowledgements
This work was supported by grants from MIUR-FIRB
2003 project RBNE03B8KK, ‘Molecular recognition in
protein–ligand, protein–protein and protein–surface
interaction: development of integrated experimental
and computational approaches to the study of
systems of pharmaceutical interest’ and from
Universita
`
degli Studi di Bari (Fondi di Ateneo per la
ricerca) to M. Barile, and from MIUR-PRIN
project no. 2004052535, ‘Cross-talk between organelles
in response to oxidative stress’ to L. De Gara.
T. A. Giancaspero was supported by a postgraduate
fellowship (Assegno di Ricerca) financed by MIUR-
FIRB 2003 project RBNE03B8KK and by Universita
`
degli Studi di Bari (Bari, Italy). The technical assis-
tance of V. Giannoccaro (Universita
`
degli Studi di
Bari, Bari, Italy) is gratefully acknowledged.
References
1 Powers HJ (2003) Riboflavin (vitamin B-2) and health.
Am J Clin Nutr 77, 1352–1360.
2 Werner R, Manthey KC, Griffin JB & Zempleni J
(2005) HepG2 cells develop signs of riboflavin deficiency
within 4 days of culture in riboflavin-deficient medium.
J Nutr Biochem 16, 617–624.
3 Tu BP & Weissman JS (2000) Oxidative protein folding
in eukaryotes: mechanism, and consequences. J Cell
Biol 164, 341–346.
4 Thorpe C, Hoober KL, Raje S, Glynn NM, Burnside J,
Turi GK & Coppock DL (2002) Sulfhydryl oxidases:
emerging catalysts of protein disulfide bond formation
in eukaryotes. Arch Biochem Biophys 405, 1–12.
5 Urade R (2007) Cellular response to unfolded proteins
in the endoplasmic reticulum of plants. FEBS J 274,
1152–1171.
T. A. Giancaspero et al. Rf uptake and metabolism in TBY-2 mitochondria
FEBS Journal 276 (2009) 219–231 ª 2008 The Authors Journal compilation ª 2008 FEBS 229
6 Mittler R, Vanderauwera S, Gollery M & Van Breuse-
gem F (2004) Reactive oxygen gene network of plants.
Trends Plant Sci 9, 490–498.
7 Foyer CH & Noctor G (2005) Redox homeostasis and
antioxidant signaling: a metabolic interface between
stress perception and physiological responses. Plant Cell
17, 1866–1875.
8 de Pinto MC, Paradiso A, Leonetti P & De Gara L
(2006) Hydrogen peroxide, nitric oxide and cytosolic
ascorbate peroxidase at the crossroad between defence
and cell death. Plant J 48, 784–795.
9 Ishikawa T & Shigeoka S (2008) Recent advances in
ascorbate biosynthesis and the physiological significance
of ascorbate peroxidase in photosynthesizing organisms.
Biosci Biotechnol Biochem 72, 1143–1154.
10 Paradiso A, Berardino R, de Pinto MC, Sanita
`
di Toppi
L, Storelli MM, Tommasi F & De Gara L (2008)
Increase in ascorbate-glutathione metabolism as local
and precocious systemic responses induced by cadmium
in durum wheat plants. Plant Cell Physiol 49, 362–374.
11 Wheeler GL, Jones MA & Smirnoff N (1998) The
biosynthetic pathway of vitamin C in higher plants.
Nature 393, 365–368.
12 Bartoli CG, Pastori GM & Foyer CH (2000) Ascorbate
biosynthesis in mitochondria is linked to the electron
transport chain between complexes III and IV. Plant
Physiol 123, 335–344.
13 de Pinto MC, Tommasi F & De Gara L (2000)
Enzymes of the ascorbate biosynthesis and ascorbate–
glutathione cycle in cultured cells of Tobacco Bright
Yellow 2 cells. Plant Physiol Biochem 38, 541–550.
14 Chew O, Whelan J & Millar AH (2003) Molecular defi-
nition of the ascorbate–glutathione cycle in Arabidopsis
mitochondria revealed dual targeting of antioxidant
defences in plants. J Biol Chem 278, 46869–46877.
15 Leferink NGH, Heuts DPHM, Fraaije MW & van Ber-
kel WJH (2008) The growing VAO flavoprotein family.
Arch Biochem Biophysics 474, 292–301.
16 Manthey KC, Rodriguez-Melendez R, Hoi JT & Zem-
pleni J (2006) Riboflavin deficiency causes protein and
DNA damage in HepG2 cells, triggering arrest in G1
phase of the cell cycle. J Nutr Biochem 17, 250–256.
17 Roje S (2007) Vitamin B biosynthesis in plants. Phyto-
chemistry 68, 1904–1921.
18 Giancaspero TA, Wait R, Boles E & Barile M (2008) Suc-
cinate dehydrogenase flavoprotein subunit expression in
Saccharomyces cerevisiae – involvement of the mitochon-
drial FAD transporter, Flx1p. FEBS J 275, 1103–1117.
19 Gianazza E, Vergani L, Wait R, Brizio C, Brambilla D,
Begum S, Giancaspero TA, Conserva F, Eberini I, Buf-
ano D et al. (2006) Coordinated and reversible reduc-
tion of enzymes involved in terminal oxidative
metabolism in skeletal muscle mitochondria from a
riboflavin-responsive, multiple acyl-CoA dehydrogenase
deficiency patient. Electrophoresis 27, 1182–1198.
20 Schrecker AW & Kornberg A (1950) Reversible enzy-
matic synthesis of flavin adenine dinucleotide. J Biol
Chem 182, 795–803.
21 Kashchenko VE & Shavlovski
i GM (1976) Purification
and properties of the riboflavin kinase of the yeast
Pichia guilliermondii. Biokhimiia 41, 376–383.
22 McCormick DB (2000) A trail of research on cofactors:
an odyssey with friends. J Nutr 130, 323S–330S.
23 Bauer S, Kemter K, Bacher A, Huber R, Fischer M &
Steinbacher S (2003) Crystal structure of Schizosacchar-
omyces pombe riboflavin kinase reveals a novel ATP
and riboflavin-binding fold. J Mol Biol 326, 1463–1473.
24 Karthikeyan S, Zhou Q, Mseeh F, Grishin NV, Oster-
man AL & Zhang H (2003) Crystal structure of human
riboflavin kinase reveals a b barrel fold and a novel
active site arch. Structure 11, 265–273.
25 Wu M, Repetto B, Glerum DM & Tzagoloff A (1995)
Cloning and characterization of FAD1, the structural
gene for flavin adenine dinucleotide synthetase of Sac-
charomyces cerevisiae. Mol Cell Biol 15, 264–271.
26 Santos MA, Jime
´
nez A & Revuelta JL (2000) Molecular
characterization of FMN1, the structural gene for the
monofunctional flavokinase of Saccharomyces cerevisi-
ae. J Biol Chem 275, 28618–28624.
27 Brizio C, Galluccio M, Wait R, Torchetti EM, Bafunno
V, Accardi R, Gianazza E, Indiveri C & Barile M (2006)
Over-expression in Escherichia coli and characterization
of two recombinant isoforms of human FAD synthetase.
Biochem Biophys Res Commun 344, 1008–1016.
28 Galluccio M, Brizio C, Torchetti EM, Ferranti P, Gian-
azza E, Indiveri C & Barile M (2007) Over-expression
in Escherichia coli, purification and characterization of
isoform 2 of human FAD synthetase. Protein Exp Purif
52, 175–181.
29 Barile M, Passarella S, Bertoldi A & Quagliariello E
(1993) Flavin adenine dinucleotide synthesis in isolated
rat liver mitochondria caused by imported flavin mono-
nucleotide. Arch Biochem Biophys 305, 442–447.
30 Barile M, Brizio C, Valenti D, De Virgilio C & Passa-
rella S (2000) The riboflavin ⁄ FAD cycle in rat liver
mitochondria. Eur J Biochem 267, 4888–4900.
31 Pallotta ML, Brizio C, Fratianni A, De Virgilio C,
Barile M & Passarella S (1998) Saccharomyces cerevisiae
mitochondria can synthesise FMN and FAD from
externally added riboflavin and export them to the
extramitochondrial phase. FEBS Lett 428, 245–249.
32 Bafunno V, Giancaspero TA, Brizio C, Bufano D, Pas-
sarella S, Boles E & Barile M (2004) Riboflavin uptake
and FAD synthesis in Saccharomyces cerevisiae mito-
chondria: involvement of the Flx1p carrier in FAD
export. J Biol Chem 279, 92–102.
33 Kearney EB, Goldenberg J, Lipsick J & Perl M (1979)
Flavokinase and FAD synthetase from Bacillus
subtilis specific for reduced flavins. J Biol Chem 254,
9551–9557.
Rf uptake and metabolism in TBY-2 mitochondria T. A. Giancaspero et al.
230 FEBS Journal 276 (2009) 219–231 ª 2008 The Authors Journal compilation ª 2008 FEBS
34 Efimov I, Kuusk V, Zhang X & McIntire WS (1998)
Proposed steady-state kinetic mechanism for Corynebac-
terium ammoniagenes FAD synthetase produced by
E. coli. Biochemistry 37, 9716–9723.
35 Manstein DJ & Pai EF (1986) Purification and charac-
terization of FAD synthetase from Brevibacterium
ammoniagenes. J Biol Chem 261, 16169–16173.
36 Solovieva IM, Tarasov KV & Perumov DA (2003)
Main physicochemical features of monofunctional
flavokinase from Bacillus subtilis. Biochemistry 68,
177–181.
37 Giri KV, Krishnaswamy PR & Rao NA (1957) Occur-
rence of flavokinase activity in plants. Nature 179,
1134–1135.
38 Giri KV, Appaji Rao N, Cama HR & Kumar SA
(1959) Studies of flavine dinucleotide-synthesizing
enzyme in plants. Biochem J 75, 381–386.
39 Sadasivam S & Shanmugasundaram ER (1966) Studies
on the flavokinase of Solanum nigrum. Enzymologia 31,
203–208.
40 Sobhanaditya J & Appaji Rao N (1981) Plant flavokin-
ase. Biochem J 197, 227–232.
41 Mitsuda H, Tsuge H, Tomozawa Y & Kawai F (1970)
Multiplicity of acid phosphatase catalyzing FMN hydro-
lysis in spinach leaves. J Vitaminol (Kyoto) 16, 52–57.
42 Sandoval FJ & Roje S (2005) An FMN hydrolase is
fused to a riboflavin kinase homolog in plants. J Biol
Chem 280, 38337–38345.
43 Sandoval FJ, Zhang Yi & Roje S (2008) Flavin nucleotide
metabolism in plants: monofunctional enzymes
synthesize FAD in plastids. J Biol Chem 283, 30890–
30900.
44 Shimomura S & Beevers H (1983) Alcohol dehydro-
genase and an inactivator from rice seedlings. Plant
Physiol 71, 736–741.
45 Barile M, Brizio C, De Virgilio C, Delfine S, Quagliari-
ello E & Passarella S (1997) Flavin adenine dinucleotide
and flavin mononucleotide metabolism in rat liver – the
occurrence of FAD pyrophosphatase and FMN phos-
phohydrolase in isolated mitochondria. Eur J Biochem
249, 777–785.
46 Depeint F, Bruce WR, Shangari N, Mehta R & O’Brien
PJ (2006) Mitochondrial function and toxicity: role of
the B vitamin family on mitochondrial energy meta-
bolism. Chem-Biol Interact 163, 94–112.
47 Lunn JE (2007) Compartmentation in plant meta-
bolism. J Exp Bot 58 , 35–47.
48 Kreneva RA, Gelfand MS, Mironov AA, Iomantas
YA, Kozlov YI, Mironov AS & Perumov DA (2000)
Study of the phenotypic occurrence of ura gene inacti-
vation in Bacillus subtilis. Genetika 36, 1166–1168.
49 Reihl P & Stolz J (2005) The monocarboxylate trans-
porter homolog Mch5p catalyzes riboflavin (vitamin B2)
uptake in Saccharomyces cerevisiae.
J Biol Chem 280,
39809–39817.
50 Yonezawa A, Masuda S, Katsura T & Inui K (2008)
Identification and functional characterization of a novel
human and rat riboflavin transporter, RFT1. Am J
Physiol Cell Physiol 295, 632–641.
51 Tzagoloff A, Jang J, Glerum M & Wu M (1996) FLX1
codes for a carrier protein involved in maintaining a
proper balance of flavin nucleotides in yeast mitochon-
dria. J Biol Chem 271, 7392–7397.
52 Lee SS & McCormick BD (1985) Thyroid hormone reg-
ulation of flavocoenzyme biosynthesis. Arch Biochem
Biophys 237, 197–201.
53 Robinson KM & Lemire BD (1996) Covalent attachment
of FAD to the yeast succinate dehydrogenase flavopro-
tein requires import into mitochondria, presequence
removal, and folding. J Biol Chem 271, 4055–4060.
54 Brizio C, Otto A, Brandsch R, Passarella S & Barile M
(2000) A protein factor of rat liver mitochondrial
matrix involved in flavinylation of dimethylglycine
dehydrogenase. Eur J Biochem 267, 4346–4454.
55 Brizio C, Barile M & Brandsch R (2002) Flavinylation
of the precursor of mitochondrial dimethylglycine dehy-
drogenase by intact and solubilised mitochondria. FEBS
Lett 522, 141–146.
56 Bradford M (1976) A rapid and sensitive method for
the quantisation of microgram quantities of protein
utilizing the principle of protein-dye binding. Anal
Biochem 72, 248–254.
57 Valenti D, Vacca RA, de Pinto MC, De Gara L,
Marra E & Passarella S (2007) In the early phase of
programmed cell death in Tobacco Bright Yellow 2
cells the mitochondrial adenine dinucleotide transloca-
tor, adenylate kinase and nucleoside diphosphate
kinase are impaired in a reactive oxygen spe-
cies-dependent manner. Biochim Biophys Acta 1767,
66–78.
58 Laemmli UK (1970) Cleavage of structural proteins
during the assembly of the head of bacteriophage T4.
Nature 227, 680–685.
59 Chen FL & Cullimore JV (1988) Two isoenzymes of
NADH-dependent glutamate synthase in root nodules
of Phaseolus vulgaris L: purification, properties and
activity changes during nodule development. Plant
Physiol 88, 1411–1417.
T. A. Giancaspero et al. Rf uptake and metabolism in TBY-2 mitochondria
FEBS Journal 276 (2009) 219–231 ª 2008 The Authors Journal compilation ª 2008 FEBS 231

![Tài liệu Báo cáo khoa học: The stereochemistry of benzo[a]pyrene-2¢-deoxyguanosine adducts affects DNA methylation by SssI and HhaI DNA methyltransferases pptx](https://media.store123doc.com/images/document/14/br/gc/medium_Y97X8XlBli.jpg)