TENTH FIVE YEAR PLAN 2008-2013: MAIN DOCUMENT ppt
Bạn đang xem bản rút gọn của tài liệu. Xem và tải ngay bản đầy đủ của tài liệu tại đây (1.9 MB, 169 trang )
i
Tenth Plan Document, Volume 1
TENTH FIVE YEAR PLAN
Gross National Happiness Commission
Royal Government of Bhutan
VOLUME 1: MAIN DOCUMENT
2008-2013
ii
Tenth Plan Document, Volume 1
© Copyright Gross National Happiness Commission (2009)
Published by: Gross National Happiness Commission
Royal Government of Bhutan
ISBN 978-99936-769-0-4
ISBN 978-99936-769-2-8 (For Set)
iii
Tenth Plan Document, Volume 1
His Majesty Jigme Khesar Namgyel Wangchuck
iv
Tenth Plan Document, Volume 1
v
Tenth Plan Document, Volume 1
vi
Tenth Plan Document, Volume 1
vii
Tenth Plan Document, Volume 1
CONTENTS
ACRONYMS xii
GLOSARY xiii
CHAPTER 1 1
1.1: Background 1
1.2: An Overview of Ninth Plan Achievements 1
1.3: Economic Performance 2
1.3.1: Growth 2
1.3.2: Structural Changes in the Economy 3
1.3.3: Consumption, Investment and Savings 4
1.3.4: Change in Prices 4
1.3.5: Balance of Payments and External Resources 4
1.3.6: Ninth Plan Development Outlay and Expenditure 6
1.4: Social Development Trends 7
1.4.1: Education & Literacy 7
1.4.2: Health and Nutrition 9
1.4.3: Safe Drinking Water and Sanitation 10
1.5: Human Development Progress 11
CHAPTER 2 14
2.1: Introduction 15
2.2: Development Outlook and Vision 15
2.2.1: Evolving Strategies to Achieve Gross National Happiness 15
2.2.2: A Vision of Bhutan in the Year 2020 17
2.2.3: International Development Goals 19
CHAPTER 3 22
3.1: Poverty Reduction 23
3.2Vitalizing Industry 26
3.2.1 Strengthening the Manufacturing and Trade Sector 26
3.2.2: Accelerated Development of Hydropower 29
3.2.3: Promoting and Facilitating the Development of Cultural Industries 31
3.3: National Spatial Planning 32
3.3.1: Managing Sustainable Urban Development and Housing 33
3.3.2: Conservation of the Environment 35
3.4: Synergizing Integrated Rural-Urban Development for Poverty Alleviation 36
3.5: Expansion of Stratigic Infrastructure 40
viii
Tenth Plan Document, Volume 1
3.6: Investing in Human Capital 43
3.6.1: Striving for Excellence in Education 44
3.6.2: Human Resource Development for the Public and Private Sectors 46
3.7: Enhancing the Enabling Environment 47
3.8: Tenth Plan Targets 49
3.8.1: Economic and Employment Targets 50
3.8.2: Social and Human Development Targets 51
3.9: e Planning Process and Implementation Modality 51
3.9.1: Participatory Planning Approach 51
3.9.2: e Results-Based Planning Approach 52
3.9.3: Mechanisms for Plan Implementation 53
3.9.4: Resource Allocation Mechanism 54
3.9.5: Monitoring & Evaluation Process 54
CHAPTER 4 56
4.1: Introduction 57
4.2: Macro-Economic Outlook for the Tenth Plan 57
4.3: Sectoral Growths 58
4.4: Balance of Payments Position 59
4.5: Development Outlay and Public Finance Projections 59
4.5.1: Tenth Plan Outlay 59
4.5.2 Financing of Tenth Plan Outlay 60
4.5.3:Indicative Resource Allocations for the Tenth Plan 61
4.6: Financial Sector Intermediation 63
CHAPTER 5 66
5.1: Decentralized Government 67
5.1.1: Introduction 67
5.1.2: Opportunities and Challenges for Eective Decentralized Governance 67
5.1.3: Operational Framework for Local Governments in the Tenth Plan 68
5.1.4: Strategic Objectives 69
5.1.5: Financial Outlay for the Local Government 70
5.2: Employment 71
5.2.1: Recent Trends in the Employment and Unemployment Situation 71
5.2.2:Causes of Unemployment 72
5.2.3: Objectives and Strategies to Promote Employment 73
5.2.4: Targets for the Employment Sector 74
ix
Tenth Plan Document, Volume 1
5.3: Women in Development 74
5.3.1: Policy and Strategies for Women in Development 75
5.3.2: Strategic Measures to Promote Gender Mainstreaming 77
5.4: Information and Communications Technology 77
5.4.1: ICT Challenges 78
5.4.2: ICT Policy and Strategies 78
5.5: Environment 79
5.5.1: Opportunities and Challenges 80
5.5.2: Environment Policy and Strategies 81
5.6: HIV/AIDS 82
5.6.1: Introduction 82
5.6.2: Challenges 83
5.6.3: Policy and Strategies 83
CHAPTER 6 84
6.1: Introduction 85
6.2: Opportunities and Challenges 85
6.3: Policy and Strategies 86
6.4: Targets for the RNR Sector 88
6.5: Financial Outlay for the RNR Sector 91
CHAPTER 7 92
7.1: Trade 93
7.1.1: Opportunities and Challenges 93
7.1.2: Policy and Strategies 94
7.1.3: Targets for the Trade Sector 95
7.1.4: Financial Outlay for the Trade Sector 95
7.2: Industry 95
7.2.1: Opportunities and Challenges 95
7.2.2: Policy and Strategies 95
7.2.3: Targets for the Industrial Sector 96
7.2.4: Financial Outlay for the Industrial Sector 96
7.3: Tourism 96
7.3.1: Opportunities and Challenges 96
7.3.2: Policy and Strategies 97
7.3.3: Targets for the Tourism Sector 99
7.3.4: Financial Outlay for the Tourism Sector 99
x
Tenth Plan Document, Volume 1
7.4: Geology and Mines 99
7.4.1: Policy and Strategies 99
7.4.2: Targets for the Geology and Mines Sector 100
7.4.3: Financial Outlay for the Geology and Mines Sector 100
CHAPTER 8 102
8.1: Introduction 103
8.2: Opportunities and Challenges 103
8.3: Policy and Strategies 104
8.4: Targets for the Energy Sector 105
8.5: Financial Outlay for the Energy Sector 105
CHAPTER 9 106
9.1: Introduction 107
9.1.1: Constraints and Challenges 107
9.1.2: Basic and Secondary Education Objectives and Strategies 109
9.1.3: Targets for the Education Sector 113
9.1.4: Financial Outlay for the Education Sector 113
9.2 Tertiary Education 113
9.2.1: Constraints and Challenges 114
9.2.2: Strategies 115
9.2.3: Financial Outlay for the Tertiary Education Sector 117
CHAPTER 10 118
10.1: Introduction 119
10.2: Policy Objectives and Strategies 119
10.3: Targets for the Health Sector 122
10.4: Financial Outlay for the Health Sector 122
CHAPTER 11 124
11.1: Introduction 125
11.2: Opportunities and Challenges 126
11.3: Policy and Strategies 126
11.4: Targets for the Road Sector 128
11.5: Financial Outlay for the Road and Bridge Sector 128
CHAPTER 12 130
12.1: Introduction 131
12.2: Opportunities and Challenges 131
12.3: Policy and Strategies 132
xi
Tenth Plan Document, Volume 1
12.4: Targets for the Urban Development 132
12.5: Financial Outlay for the Urban Development 132
CHAPTER 13 134
13.1: Introduction 135
13.2: Opportunities and challenges 135
13.3: Policy and Strategies 136
13.4: Financial Outlay for the Information and the Media Sector 136
CHAPTER 14 138
14.1: Surface Transport Sub-Sector 139
14.1.1: Introduction 139
14.1.2: Opportunities and Challenges 139
14.1.3: Policy and Strategies 140
14.1.4: Financial Outlay for the Surface Transport Sub-Sector 143
14.2: Air Transport Sub-Sector 143
14.2.1: Introduction 143
14.2.2: Challenges and Opportunities 143
14.2.3: Policy and Strategies 143
14.2.4: Financial Outlay for the Air Transport Sub-Sector 144
CHAPTER 15 146
15.1: Introduction 147
15.2: Opportunities and Challenges 147
15.3: Policy and Strategies to Conserve and Promote Cultural Heritage 148
15.4: Financial Outlay for the Cultural Sector 150
CHAPTER 16 152
16.1: Introduction 153
16.2: Opportunities and Challenges 153
16.3: Policy and Strategies 154
16.4: Targets for the Sports Sector 155
16.5: Financial Outlay for the Sports Sector 155
xii
Tenth Plan Document, Volume 1
ACRONYMS
AIDS Acquired Immuno Deciency Syndrome
ANC Ante Natal Care
APF Alternative Planning Framework
ATP Apprenticeship Training Program
BDI Bhutan Development Index
BHMC Bhutan Health and Medical Council
BHTF Bhutan Health Trust Fund
BHU Basic Health Unit
BHW Basic Health Worker
BIMSTEC Bay of Bengal Initiative for Multi-Sectoral Technical and Economic Cooperation
BLSS Bhutan Living Standards Survey
BoP Balance of Payments
BPFFS Budget Policy and Fiscal Framework Statement
CPI Consumer Price Index
DEC District Environment Committees
DGPC Druk Green Power Corporation
DPR Detail Project Report
DRA Drug Regulatory Authority
DVTCD Draktsho Vocational and Training Centre for the Disabled
EA Environmental Assessment
ECCE Early Childhood Care and Education
EFRC Environment Friendly Road Construction
EmOC Emergency Obstetric Care
FYP Five Year Plan
GDP Gross Domestic Product
GG Plus Good Governance Plus
GLOF Glacial Lake Outburst Flood
GNH Gross National Happiness
HACCP Hazard Analysis Critical Control Point
HDI Human Development Index
HIES Household Income and Expenditure Survey
HIV Human Immunodeciency Virus
HRD Human Resource Development
ICOR Incremental Capital Output Ratio
ICT Information and Communications Technology
IDD Iodine Deciency Disorder
IEC Information Education and Communication
IMR Infant Mortality Rate
IPP Individual Power Producer
Kcal Kilo Calorie
LDC Least Developed Country
LFPR Labor Force Participation Rate
LSE Lower Secondary Education
MCH Maternal and Child Health
MDGs Millennium Development Goals
MMR Maternal Mortality Ratio
MoA Ministry of Agriculture
MoE Ministry of Education
MoF Ministry of Finance
MoH Ministry of Health
MSME Micro Small and Medium Enterprises
MSTF Multi-Sectoral Task Force
MTEF Medium Term Expenditure Framework
MTR Mid Term Review
MTTF Medium Term Fiscal Framework
NCWC National Commission for Women and Children
xiii
Tenth Plan Document, Volume 1
NEC National Environment Commission
NFE Non-Formal Education
NID National Institute for the Disabled
NITM National Institute of Traditional Medicine
NLFS National Labor Force Survey
NSB National Statistical Bureau of Bhutan
NSDS National Sustainable Development Strategy
NWFP Non Wood Forest Products
Nu Ngultrum
NUS National Urbanization Strategy
ODA Ocial Development Assistance
ORC Outreach Clinic
PAAR Poverty Assessment and Analysis Report
PAR Poverty Analysis Report
PCS Position Classication System
PHC Primary Health Care
PHCB Population and Housing Census Bhutan
PoA Program of Action
PPP Power Purchasing Parity
PRSP Poverty Reduction Strategy Paper
PVR Poverty Vulnerability Indicators
RBM Results Based Management
RGoB Royal Government of Bhutan
RIHS Royal Institute of Health Services
RMA Royal Monetary Authority of Bhutan
RNR Renewable Natural Resource
RTM Round Table Meeting
RWSS Rural Water Supply and Sanitation
SAARC South Asian Association for Regional Cooperation
SDGs SAARC Development Goals
SME Small and Medium Enterprise
SMF Simple Macroeconomic Framework
STI Sexually Transmitted Infection
U-5MR Under-ve Mortality Rate
VET Vocational Education and Training
VSDP Village Skills Development Program
VTI Vocational Training Institutes
GLOSARY
Chimi People’s representative and member of National Assembly
Drangpon Judge
Druk Gyalpo His Majesty e King of Bhutan
Drungtsho Indigenous physicians
Dzong Fortress
Dzongkha National language
Dzongkhag District
Dzongkhag Yargye Tshogdu District Development Committee
Gewog Block
Gewog Yargye Tshogchung Block Development Committee
Gup Elected Gewog Leader
Lhenkhag Ministry
Lhengye Shungtshog Cabinet
Menpa Indigenous compounders
Tsa rim Chhenmo e Constitution
romde Municipal bodies
Tshogdu National Assembly
Tshogpa Village Representative
XIV
Tenth Plan Document, Volume 1
CHAPTER 1
REVIEW OF DEVELOPMENT
PERFORMANCE IN THE NINTH PLAN
01
REVIEW OF DEVELOPMENT PERFORMANCE IN THE NINTH PLAN
1
REVIEW OF DEVELOPMENT PERFORMANCE IN THE NINTH PLAN
1.1: BACKGROUND
e Ninth Plan was launched in July 2002 initially for a ve year period with a total outlay of Nu. 70
billion. e plan period has been extended by one year to end in June 2008 in order to complete
all the Ninth Plan activities so that the Tenth Plan could start a fresh with the launching of the
Constitution and installation of the new government in 2008. e ve year planning mechanism
has been an eective instrument through which the country has made impressive progress in its
socio-economic transformation towards the actualization of Gross National Happiness (GNH). e
Ninth Plan to date has been the most ambitious plan, both in the size of the outlay that represented
a three-quarter increase over the Eighth Plan and in the immense scope of development outcomes
that it set out to accomplish. A signicant feature of the Ninth Plan was to introduce and implement
Gewog based planning system wherein the decision-making for development activities and nancial
powers were eectively devolved to the local government levels.
e Ninth Plan had ve major goals and these were to improve the quality of life and income,
especially of the poor; ensure good governance; promote private sector growth and employment
generation; preserve and promote cultural heritage and conservation of the environment; and
achieve rapid economic growth and transformation. An important part of the development
strategy towards attaining these plan objectives involved prioritizing infrastructure development
and improving the quality of and access to social services.
Other critical strategies of the Ninth Plan included consolidating governance reforms through
strengthening the decentralization process, enhancing popular participation and initiating
democratization eorts. Additionally, the development activities for the plan period were to be
implemented while maintaining a stable macro-economic environment through sound macro-
economic management policies aimed at sustaining growth, expanding investments and savings,
keeping domestic and external borrowings within sustainable limits, limiting budget decits,
controlling ination and generally meeting the rising recurrent development expenditures through
enhanced domestic revenues. ese goals continue to remain highly pertinent for the Tenth Plan
too.
1.2: AN OVERVIEW OF NINTH PLAN ACHIEVEMENTS
An evaluation of the major political, economic, physical and social indicators and developments
over the Ninth Plan period provides a picture of signicant and tangible achievements. Most of the
planned development activities were implemented successfully and a majority of the important
development targets fullled.
Over the Ninth Plan, the country successfully maintained past trends of sustained rapid economic
growth. Indeed, the country has never witnessed such high growth levels before in any of the earlier
plan periods, including massive expansions of the economic and social physical infrastructure.
More importantly, this has been accomplished in a highly sustainable manner with minimal impact
on the physical, social and cultural environments. ere has also been remarkable progress made
in advancing social and human development conditions in the country on the basis of the Royal
Government’s strong social redistributive policies and investments made over the plan. As a result,
Bhutan remains rmly on track to achieve the MDGs and has come that much closer to realizing
its long-term Vision 2020 goals.
e following highlights some of the concrete achievements in socio-economic development
attained over the Ninth Plan period. Bhutan’s per capita income has risen to an all time high of US
2
Tenth Plan Document, Volume 1
$ 1,414 in 2006 from US$ 835 in 2002. Even in absolute terms this represents a fairly high level of
GDP per capita by both LDC and regional standards. e country’s HDI value has similarly been
rising steadily over the plan period with HDI value assessed at over 0.613 in 2006 as compared to
0.583 in 2003.ese HDI gains over the Ninth Plan period have come not only from growth in real
income but have accrued as a result of across the board improvements in social indicators such as
poverty reduction, expanded educational enrollments, impressive declines in child and maternal
mortality and securing high access levels in the provisioning of water and sanitation facilities.
As such, Bhutan continued to retain its place among the medium human development countries
throughout the Ninth Plan period. ese accomplishments appear particularly noteworthy given
that only a few decades ago, Bhutan was ranked among the poorest countries in the world with
extremely low levels of human and social development.
Politically, the Ninth Plan period also stands out as a critical watershed era in the history of the
country. Most notably, the period witnessed the draing and national consultation on the Tsa rim
Chhenmo or Constitution that formally marked the historic transition in the country’s political
system to a Democratic Constitutional Monarchy. e Constitution was adopted in 2008 and a
new government that is elected directly by the people installed on the basis of the constitutional
provisions. Unlike the experience of many countries where such far-reaching political changes were
oen brought in with tumultuous social upheaval and violence, the democratization processes in
our country were solely ushered in under the enlightened, seless and benevolent leadership of
His Majesty the Fourth King. Remarkably, these historic political changes were also introduced at
a time of unprecedented peace, economic prosperity, improved social conditions and general well-
being for the nation and its people.
1.3: ECONOMIC PERFORMANCE
1.3.1: Growth
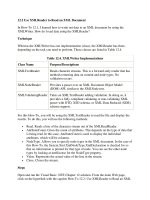
Real GDP grew at an average of 9.6% over the Ninth Plan period between 2003 and 2007, taking
into consideration an estimated growth of over 21.4% in 2007. GDP per capita in 2006 was estimated
at US$ 1,414.01 as compared to US$ 835 in 2002.
e growth rate of 9.6% exceeded the
8.2% growth targeted for the Ninth Plan.
is represents an exceptionally high and
sustained rate of growth that matches
the pace of growth in the fastest growing
economies around the world. Real GDP
grew from Nu. 23.5 billion at the start
of the Ninth Plan in 2002 to Nu. 37.5
billion in 2007. e major impetus for this
sustained growth was derived from the
continuous and sustained expansion of
the electricity sector [see Table 1.1]. e
spike in the electricity sector growth in the
nal year of the plan was directly linked
to the completion of the Tala hydro-
electric power project and the subsequent
enhanced generation and export of energy
to India.
Chart 1.1
Real GDP Growth in Ninth Plan
0%
5%
10%
15%
20%
25%
2000 2003 2004 2005 2006 2007
01
REVIEW OF DEVELOPMENT PERFORMANCE IN THE NINTH PLAN
3
REVIEW OF DEVELOPMENT PERFORMANCE IN THE NINTH PLAN
Table 1.1: GDP and sector growth rates
GDP Growth and Sectoral
Growth Rates
2000 2003 2004 2005 2006 2007
Real GDP Growth 7.2% 7.2% 6.8% 6.5% 6.3% 21.4%*
Agriculture, Livestock &
Forestry
4.6% 2.1% 1.8% 0.4% 1.9% 0.4%
Mining -2.8% -1.1% -5.2% 17.1% 19.0% 23.2%
Electricity -9.8% 18.3% -1.7% 9.4% 34.6% 120.8%
Construction 32.8% 2.8% 8.3% -2.5% -9.7% 5.7%
Manufacturing 3.2% 6.4% 5.4% 3.5% 3.8% 5.8%
Trade, Financial & Other
Related Services
8% - 15% 21% 11.5% 6%
Public Administration & Social
Services
1.6% 7.8% 0.6% 13.2% 4.4% 3.2%
Transport & Communications 1.4% 0.4% 21.90% 8.7% 7.4% 11.3%
Source: Derived from NSB, National Account Statistics 1990-2007
e agriculture, livestock and forestry sector grew on average by 1.3%, much lower than the planned
growth rate of 2.5%. In contrast, the 36% annual average growth in the electricity sector over the
plan period far surpassed the envisaged growth. is signicant dierence is largely explained
by the enhanced tari revisions for electricity exports and that revenue generation from the Tala
Hydro-electric power project was expected to impact the economy in the rst year of the Tenth
Plan rather than at the close of the Ninth Plan as it did. e trade and other services sector grew at
an average of 13% and exceeded plan projections. Similarly, the public administration and social
services sector grew faster than projected. e construction and the transport and communications
sectors grew strongly but growth was short of the planned targets. Growth in the manufacturing
sector though was extremely low.
1.3.2: Structural Changes in the Economy
As has been the trend over the decades, the economy continues to transform into a more modern
economy with the tertiary and secondary sectors growing much more rapidly than the primary
sector. ese shis though – largely due to signicant growths in the electrical and construction
sectors - have not yet been accompanied by dynamic growth and marked improvements in the
manufacturing and industrial base of the country which still remains relatively under-developed.
Given the more rapid growth in the modern sectors of the economy, the share of the primary sector
in the economy has declined steadily from 29% of GDP at the start of the Ninth Plan to 20.3% in
2007. At the start of the Eighth Plan in 1997, the share of the primary sector stood at close to a
third of GDP. Macro-economic projections further suggest that this trend of a declining share of
the primary sector in the national economy is likely to continue over the current plan period.
In comparison to the signicantly slower growth in the primary sector with annual average growths
of less than 2%, the secondary and tertiary sectors averaged much higher growth rates over the
4
Tenth Plan Document, Volume 1
plan period resulting in signicant changes in the GDP composition. e secondary sector at the
end of the plan period constituted 43.3% of GDP, while the tertiary sector accounted for 36.4%
of GDP and the primary sector for 19.5%. In 2007, the agriculture livestock and forestry sector
was surpassed by the electricity sector for the rst time as the most important contributor to the
national economy. e latter now contributes close to a quarter of the GDP or 23.4% as compared
to 18.6% for the agriculture, livestock and forestry sector, and 13.5% and 6.4% for the construction
and manufacturing sectors respectively in 2007.
1.3.3: Consumption, Investment and Savings
Over the Ninth Plan period, total consumption grew steadily at 10% and on average amounted to
around 64% of GDP with private consumption accounting for about 68% of total consumption.
Investments also grew at comparable levels (9.4%) and on average amounted to around 58% of GDP
through the period, with private investments comprising about 79% of total investments. Savings
grew even more rapidly and approximately comprised on average around a third of GDP between
2002 and 2007. e increased saving rates were primarily due to higher private (corporate) savings
that by the end of the plan period accounted for over 90% of the total gross domestic savings.
Bhutan over the Ninth Plan period thus enjoyed exceptionally high and sustained rates of growths
in savings and investment that has helped fuel the country’s high economic growth rates. e
incremental capital-output ratio (ICOR) has been rising quickly and in Bhutan’s context is explained
by the cyclical eect of the construction and commissioning of mega-hydropower projects that also
result in the peaking of GDP growth from time to time.
1.3.4: Change in Prices
Ination (measured by the rate of change in consumer price index) over the plan period remained
below 6% and approximately averaged around 3.5% annually. is compares favorably to the average
annual ination rate of 6.5% over the eighth plan period. is relatively lower rate of ination was a
result of the declining rate of price increases in both food and non-food items, with much sharper
drops for the latter principally on account of stable clothing prices. Notably, ination for non-food
items declined from around 8% in 2001 down to around 5.4% in 2006. However, in the later years
of the plan the CPI rose sharply to over 5% in 2005, 2006 and 2007.e GDP deator over the Ninth
Plan years too has remained below 6% and averaged about 4.3% annually.
1.3.5: Balance of Payments and External Resources
Bhutan’s overall balance of payments situation over the Ninth Plan period has generally been
comfortable and showed small surpluses on account of the signicant inows of grant and loan
assistance. is inow of external resources has helped balance out the trade and other invisibles
account decits resulting in an overall positive balance of payments position that averaged around
5% of GDP over the plan period. e trade decit has been markedly large, climbing to record
levels even in the face of strong and sustained export growth. In 2004/2005, the trade decit crossed
Nu.10 billion or 27% of GDP. However, the trade decit has since declined and in 2006/07 Bhutan
enjoyed a small trade surplus on Nu. 555 million.
01
REVIEW OF DEVELOPMENT PERFORMANCE IN THE NINTH PLAN
5
REVIEW OF DEVELOPMENT PERFORMANCE IN THE NINTH PLAN
Imports and Exports
As in past years, Bhutan’s major trading partner was India with 92% of Bhutan’s imports and
exports over the plan period coming in from and going to India. Total imports have been surging
sporadically and on average grew at over 32% over the plan period. Imports over the plan period
were largely on account of capital machinery and equipment, fuel, vehicles, food and a wide range
of consumer products. In 2006/07, the total value of imports was estimated at Nu. 22.19 billion.
Exports during the plan period grew at an annual average rate of 35% and in 2006/07 were valued
at Nu. 22.64 billion. Export growths for the Ninth Plan have thus vastly exceeded export growth
rates in the Eighth Plan period which averaged only around 9%. ere have been no changes in
the composition of the exports or its principal markets, which predominantly comprise the sale of
hydro-electricity and mineral products to India. Electricity continued to dominate the country’s
exports and roughly comprised around half of total exports over the plan period.
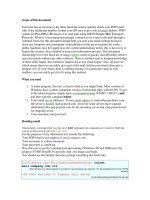
External Resources
Despite trends reecting
a decline in ocial
development assistance to
developing countries around
the world, total ocial
development assistance to
Bhutan registered more
than a 45 percent increase
in the Ninth Plan. Aid
disbursements averaged
around Nu. 6.5 billion p.a. or
approximately 19% of GDP
over the plan period.
While there has been a
signicant increase in
external grants and loans accruing to the country in absolute terms, Bhutan’s dependence on ODA
to nance the country’s development expenditures has been decreasing steadily. As compared to
ODA levels that nanced around 70% and 60% of the total development outlays of the Seventh and
Eighth Plans, ODA funding has just nanced around half of the total Ninth Plan outlay. Additionally,
ODA as a percentage of the total GDP has declined remarkably and has come down to less than
20% at present from levels in the eighties that exceeded half of GDP as reected in Chart 1.2
Bilateral sources provided around 75% of the country’s development assistance and as in past
plans, India remained the country’s major development partner. e other important development
partners for the country were the ADB, WB, Denmark, Japan and the UN systems. Reecting the
Royal Government’s Ninth Plan priorities, most of the development assistance that the country
received was allocated to the social, the RNR, energy, infrastructure and communication sectors.
e country had virtually no foreign direct investments until the Eighth Plan period. In the Ninth
Plan, FDI grew steadily from Nu.101 million in 2001 to Nu. 274 million in 2005/06 and climbed to
a record Nu.3,238 million in 2006/07.
0%
10%
20%
30%
40%
50%
60%
0
1000
2000
3000
4000
5000
6000
7000
8000
9000
80s
90s
2002
2003
2004
2005
2006
2007
ODA as % of GDP
Million Nu
Chart 1.2 External Assistance to Bhutan
2002-2007
ODA
ODA to GDP%
6
Tenth Plan Document, Volume 1
Reserves and Debt
Reecting the positive overall balance of payments situation over the plan period, the country’s
reserves have been growing steadily. As of September 2007, this amounted to US$ 611.1 million up
from US$ 315 million in 2001. Gross reserves over the plan period have generally been adequate
to nance around twenty months of current levels of imports though in 2007 this came down to
around 13.4 months.
e country’s external debt though has also been growing steadily on account of long term
investments into hydro-power development, extensive infrastructure development and social
investments. Under the World Bank’s debt sustainability analysis Bhutan was “debt distressed.”
e total stock of outstanding external debt more than doubled from US$ 291.8 in 2001 to US$
755.7 million as of March 2008 and GDP comparative terms, the debt to GDP ratio increased from
62.9% to 74.4%. While extremely high in relation to the size of the national economy, much of
this debt can be regarded as being sustainable in the context of expectations that these investments
will provide sizeable future economic and social capital returns. Debt servicing ratio has also been
maintained at sustainable levels and was estimated at 5.6% of total exports over the plan period.
1.3.6: Ninth Plan Development Outlay and Expenditure
e public expenditures for the Ninth Plan are projected to be about 93% percent of the original plan
allocation of Nu.70 billion. e budget decit for the plan period on the whole has been maintained
below 5% of GDP. e social sector received the largest share of the Ninth Plan budget with around
a quarter of the total realized budget. Around 19% and 18.5% of the total realized budget were spent
for the general public administration and services and the transport, communications and public
works sectors respectively. e agriculture and the trade, industries and energy sectors received
around 9% and 8.5% of the realized budget.
Table 1.2: Summary Ninth Plan Budget Expenditures (In Million Nu)
2002/03 2003/04 2004/05 2005/06
2006/07
(proj)
2007/08
(proj)
Revenue 4,785 5,055 6,066 6,093 10,038 11,129
External Grants 2,269 5,367 5,033 5,478 7,156 5,183
Total Revenue +
External Grants
7,054 10,423 11,099 11,571 17,194 16,312
Current 4,581 5,149 6,506 6,888 8,756 9,471
Capital 5,310 4,653 9,056 7,764 9,461 9,703
Total Expenditure
(without Druk Air Planes) 9,890 9,802 15,562 14,652 18,217 19,174
Lending (net) -48 -6 39 49 -1103 -1283
Overall Surplus/
Decit
-2891 580 -4106 -3745 80 -1539
Budget Surplus/
Decit as % of GDP
-10% 1.75% -11% -8% 0% -3%
01
REVIEW OF DEVELOPMENT PERFORMANCE IN THE NINTH PLAN
7
REVIEW OF DEVELOPMENT PERFORMANCE IN THE NINTH PLAN
1.4: Social Development Trends
Improving the social conditions of people through enhancing access to and the eciency and quality
of social services was a strategic thrust area of the Ninth Plan. is high priority was appropriately
reected in the signicant scaling up of resources allocated for the social sector which received
more than a quarter of the Ninth Plan’s total development outlay, which includes social sector
expenditures at both the central and the Dzongkhag and Gewog levels.
In this regard, the country has exceeded its commitment to the global 20:20 compact agreed on at
the World Summit for Social Development in 1995. e compact required developing countries to
devote 20 percent of their national budget for basic social programs. Bhutan remains among the
very few countries in the world to have done so.
As a result of these sustained social investments, Bhutan achieved signicant progress in advancing
the general social conditions in the country, a development reected in continued improvements
in most of the social and human development indicators. A comparison of the major social
indicators over the Seventh, Eighth and Ninth Plans illustrated in Table 1.3 provides an indication
of these sustained improvements. A more detailed treatment of the prevailing social and human
development context over the plan period is provided in the following sections.
1.4.1: Education & Literacy
Progress in terms of access to education over the Ninth Plan period has been particularly notable.
With the construction of 128 new schools and the signicant expansion and upgrading existing
schools, the total enrolment of students has increased from 129,160 in 2003 to 157,112 in 2008.
Enrolment growth at the higher secondary level has risen the fastest, averaging close to 20.9 %
a year between 2002 and 2008. At the middle/lower secondary and primary levels, enrolment
growths have been more modest at 6.6% and 2.7 % respectively over the same period. While the
sheer growth in numbers of enrolling students has placed an enormous burden on the educational
system, strenuous eorts have been made to maintain and further improve the quality of education.
Maintaining the quality of education in the light of this unrelenting growth of enrolment has been
a major challenge and is likely to remain an important and signicant one for the future.
Reecting this brisk growth in enrolment, the Gross Primary Enrolment Rate (GPER) has increased
from 81% in 2002 to 112 % in 2008. As such, the Ninth Plan target to attain a GPER between 90-95%
was comfortably achieved. With enrolment rate for girls growing at a faster rate at both primary
and secondary levels, the country has achieved gender parity in primary and basic education.
Signicant gains in the girls enrolment rate at higher secondary level has also moved the country
much closer in achieving gender parity at this level from 0.61 in 2002 to 0.86 in 2008.
Primary and secondary school completion rates have also improved signicantly over the plan
period. It rose from 77% to 87% at the primary level and from 43% to 54% at the secondary
level (basic education) between 2006 and 2008. is improved eciency within the primary and
secondary education system is partly attributable to the improvements in the teacher student ratio
in schools which has improved from around 1:38 at the end of the Eighth Plan to 1:32 at the end of
the Ninth Plan (combined primary and secondary estimate). Most schools have achieved the Ninth
Plan targeted teacher student ratio of one teacher for every thirty two students.
8
Tenth Plan Document, Volume 1
Table 1.3 Social and Human Development Indicators
End of
7th FYP
(1997)
End of
8th FYP
(2002)
End of
9th FYP
(2007)
Education
GPER 72% 81% 112.0%
NPER - 62% 88.0%
Primary School Completion Rate - 77.% 87%*
Teacher Student Ratio (Primary) 1:41 1:39 1:30
Teacher Student Ratio(Secondary) 1:38 1:36 1:26
Gender Parity in Education
-Gender Parity Index (GPI) -Primary - 0.90 1.00
-GPI –Lower & Middle Secondary - 0.87 1.05
-GPI –Higher Secondary - 0.61 0.86
Girls for every 100 boys
- Girl-Boy Ratio (Primary) - 88 98
- Girl-Boy Ratio (Lower & Middle Secondary) - 87 100.7
- Girl-Boy Ratio (Higher Secondary) - 61 81.3
- Girl-Boy Ratio (Tertiary): - 39 54
National Literacy - - 59.5%
Adult Literacy - - 53%
Health & Sanitation
Life Expectancy 66.1 - -
Population Growth Rate 3.11 2.52 1.33
IMR (per 1,000) 70.71 60.12 40.13
U-5MR (per 1,000) 96.91 842 61.53
MMR (per 100,000) 3801 2552 150-200
Trained Birth Attendance (%) 10.91 23.62 51%
Access to improved sanitation
80%
(1996)
88%
(2000)
89%
Access to improved drinking water
- 78% (2000) 84%
Nutrition (Children)
% underweight
17 - -
% stunted
40 - -
% wasted
2.6 - -
Human Development Index ( HDI)
0.550
(1998)
0.583
(2003)
0.613
(2006)
Some of the other notable achievements in the education sector over the Ninth Plan relate to
establishment of the Royal University of Bhutan; upgrading the basic education level from the
eighth standard to the tenth standard; the establishment of decentralized education monitoring and
support services; the continued promotion of Dzongkha and facilitating its usage; the introduction
of computer science and applications as an optional subject in the ninth and tenth standards; setting
up of national and regional level school sports programs; and various initiatives to upgrade the
qualication and competency of in-service and new teachers.
01
REVIEW OF DEVELOPMENT PERFORMANCE IN THE NINTH PLAN
9
REVIEW OF DEVELOPMENT PERFORMANCE IN THE NINTH PLAN
In view of the urgency to provide employment for the growing numbers of educated youth entering
the labor force, the Royal Government attached a high priority to vocational training. Over the
Ninth Plan, the annual intake capacity of vocational training programs was enhanced by around
35% from around 1,271 to 1,700. In addition to formal training programs in the VTIs, several
other alternative modes of training were also organized under the Apprenticeship, Village Skills
Development and Special Skills Development training programs. However the annual intake of
all training programs fell below the targeted gure as only four of the thirteen new vocational
institutes proposed could be established due to a lack of resources. In addition to enhancing access,
signicant eorts were also directed at improving the quality of vocational training through the
adoption and implementation of a VET policy, the establishment of a Skills Training Resource
Division and the development of the Bhutan Vocational Qualications Framework.
Table 1.4 Health Human Resources & Infrastructure
To address the low levels of adult literacy,
the Non-Formal Education Program
helped train close to 14,000 learners
through 736 instructors by the end of
the 9
th
Plan (2008). is represents a
signicant increase from 9,700 learners
and 256 NFE instructors at the start of the
plan period. Not only has the instructor
student ratio for NFE programs improved
signicantly, qualication levels for
new instructors have also been raised
to a minimum of the twelh standard.
However, adult literacy levels are still low
and assessed to be 53% as reected by the
PHCB 2005. National literacy levels too
are not signicantly higher at 60%. is
falls signicantly short of the Ninth Plan
target to attain literacy level of 70% but
this may have been an unrealistic target
in the rst place as it was projected on
the basis of weak baseline data of existing
literacy and adult literacy levels.
Source: AHB 2002, 2006.
1.4.2: Health and Nutrition
Over the Ninth Plan period, primary health care coverage has been sustained at above 90%.
Additionally, immunization coverage levels were also maintained at over 85% for all Dzongkhags.
is sustained level of primary health coverage has contributed signicantly in raising the health
status of the country’s population which is reected in marked improvements in health indicators
across the board.
2002 2006
Health Human Resources
Doctors 122 145
Dungtshos and Menpas 55 66
Doctors per 10,000 population 1.7 2.3
Nurses 495 529
Health assistants 173 210
Nurses per 10,000 population 6.9 8.3
Technicians 335 438
Health Workers 176 253
Total Workers 1,356 1,641
Health Infrastructure
Hospitals 29 29
Indigenous hospital 1
Basic Health Units 166 176
Out-reach Clinics 455 485
Indigenous hospital units 19 21
Total hospital beds 1,023 1,400
Hospital beds per 10,000
population
14 17
Total health facilities 670 711
10
Tenth Plan Document, Volume 1
ere have been considerable achievements in reducing child mortality over the plan period.
Under-ve mortality rates have been brought down by around 29% from 84 per thousand live
births to 60 per thousand live births over the plan period. As such the country remains comfortably
on track to achieve the MDG target of reducing U5MR by two-thirds. ere has been an even faster
rate of progress in reducing infant mortality rates with IMR levels being successfully scaled down
by around one third from 60.5 per thousand live births to 40.1 in a little over ve years. At this rate
of progress, it is highly probable that the country will achieve the MDG target of reducing IMR by
two thirds well ahead of time.
Similarly, maternal mortality rates have been brought down by 16%, declining from 255 to around
215 per hundred thousand live births. is sustained decline in maternal deaths is partly attributable
to an increase in skilled birth attendance which doubled from 24% to 51% between 2000 and 2005.
e establishment of nine comprehensive and twenty basic Emergency Obstetric Care centers
during the Ninth Plan would also have contributed to the further decline of maternal mortality in
the country.
e Ninth Plan period also witnessed a substantial expansion in both human resources and
infrastructure in the health infrastructure as depicted in Table 1.4. e ratio of doctors to population
(for every 10,000 individuals) improved from 1.7 at the start of the plan in 2002 to 2.3 in 2006.
e nurse-population ratios likewise progressed from 6.9 to 8.3 per 10,000 population. With the
completion of the construction and or upgradation of the Jigme Dorji Wangchuck National Referral
Hospital, the Mongar Regional Referral Hospital, Phuentsholing General Hospital and the Dagana,
Trashigang, and Trongsa district hospitals, there was virtually a y percent increase in the number
of hospital beds available to the general population at large.
e general nutritional (including micronutrients situation) status of the people has been improving
over the decade due to focused interventions and the improved availability of food. An MDG target
indicator of halving the rate of under-ve children who are underweight has been achieved as this
indicator has been brought down from 38% in 1989 to 19% in 2000. Likewise there have been
similar achievements in reducing stunting and wasting among children. Additionally, there is no
major gender dierence in the nutritional status of children and where small dierences exist, girls
are usually better o.
e most notable achievements though have been the improvements in the micro-nutrient
deciency situation. A major health achievement over the Ninth Plan was the elimination of iodine
deciency disorder (IDD) as a public health problem with Bhutan becoming the rst country in the
region to have achieved this. Today, the incidence of goitre occurrence is less than 5% as compared
to 65% two decades ago. e micronutrient deciency of Vitamin A is also no longer a public
health problem though iron deciency anemia among pregnant women is still a critical concern.
1.4.3: Safe Drinking Water and Sanitation
e provision of safe drinking water and sanitation has been critical to improving the health status
of Bhutan’s population as there is a close link between enhanced coverage levels of safe drinking
water and sanitation and the decreased incidence of infectious diseases such as diarrhoea, typhoid
and cholera.
e proportion of the population with access to safe drinking water increased from 78% to 84.2%
from 2000 to 2005 with improvements particularly noticeable in rural areas. Currently, around
75% of the country’s rural residents have access to safe drinking water sources reecting a sharp
01
REVIEW OF DEVELOPMENT PERFORMANCE IN THE NINTH PLAN
11
REVIEW OF DEVELOPMENT PERFORMANCE IN THE NINTH PLAN
reduction in the rural-urban gap in terms of their access. is is in large part due to the highly
eective implementation of the Rural Water Supply (RWS) schemes all around the country. As
the MDG target of reducing by half those without access to safe drinking water has already been
achieved well in advance, the future challenge will be to achieve and maintain universal access to
safe drinking water, particularly in rural areas of the country.
In addition to improved access, considerable eorts were also directed during the plan period
to enhance the quality of drinking water and monitor these qualitative aspects in light of their
signicance to public health and eorts to decrease the spread of water-borne diseases.
Access to sanitation has similarly shown marked improvements over the decade though it has only
marginally improved by a percentage point over the plan period. e proportion of the Bhutanese
population with access to toilet facilities was 89.2% in 2005 as compared to 88% in 2000. In rural
areas sanitary latrines were also available to 86.6% of the rural population. e MDG target in this
context of halving the proportion of people without access to safe sanitation was also achieved
some time ago. is represents a notable achievement as these levels of access to safe sanitation are
comparable to those in considerably more developed countries with much higher levels of human
development and GDP per capita levels.
1.5: Human Development Progress
e Royal Government has consistently sought to assess development in terms beyond the income
or economic growth dimension. In light of the current absence of a country specic and relevant
development index that takes into account the core principles and dimensions of GNH, the Human
Development concept and its measurement, the Human Development Index (HDI) has been a
useful interim tool to assess all-round development in the country. In addition to helping assess
national development progress, the HDI also provides meaningful comparisons across countries
and over time through the annual Global Human Development Reports.
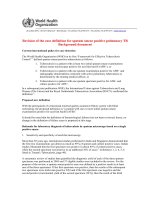
e HDI is a composite index that seeks to
capture holistic development progress in
countries towards promoting a long and
healthy life, knowledge and a decent standard
of living. It comprises the three indicators
of life expectancy, educational attainment
and real GDP per capita in PPP terms. As
reected in Chart 1.3 that traces the HDI
value trends spanning roughly the last four
plan periods, it is clearly evident that the
country has eectively and rapidly scaled
up its HDI, roughly doubling in value over
the last two decades. is extremely positive
trend has resulted in Bhutan’s movement out
of the low human development countries into
the category of medium human development
countries. With a HDI value of 0.613 in 2006, Bhutan currently is ranked 131 among all countries.
In assessing current levels of the HDI value for 2006 and analysing the reasons for their sustained
improvements, certain trends become apparent. Over the eighties the HDI value grew largely on
account of improvements in life expectancy and real GDP per capita growth. Over the nineties
0.325
0.427
0.521
0.550
0.583
0.613
0
0.1
0.2
0.3
0.4
0.5
0.6
0.7
1984
1991
1994
1998
2003
2006
Chart 1.3
HDI Value for Bhutan
1984-2006