How safety conscious are European Countries towards children ? pptx
Bạn đang xem bản rút gọn của tài liệu. Xem và tải ngay bản đầy đủ của tài liệu tại đây (8.79 MB, 60 trang )
A
How safety conscious
are European Countries
towards children
?
CHILD SAFETY REPORT CARD 2012
Europe Summary
for 31 countries
Text or parts of the text may be copied, provided that reference is made to the authors, title of the publication and publisher.
Suggested citation: MacKay M and Vincenten J. Child Safety Report Card 2012: Europe Summary for 31 Countries. Birmingham:
European Child Safety Alliance, Eurosafe; 2012.
This report card arises from the project TACTICS (Project number 20101212), which has received funding from the European
Union in the framework of the Health Programme. The ndings and views expressed are those of the authors and do not
necessarily reect the views of the partner organisations.
ISBN 978-1-909100-66-4 (PDF version)
ISBN 978-1-909100-67-1 (printed version)
© June 2012
European Child Safety Alliance
28 Calthorpe Road,
Edgbaston,
Birmingham
B15 1RP, UK
Tel: +44 121 248 2000
Fax: +44 121 248 2001
Email:
www.childsafetyeurope.org
Message by Malcolm Harbour, MEP, Chair of Internal Market and Consumer
Protection Committee
As European politicians we have a responsibility to ensure that we provide the
highest level of consumer protection for our most vulnerable citizens.
Children need our very special attention. Injuries are the number one cause of
childhood deaths and disabilities across Europe. So we need to understand the causes,
and devise and implement injury reduction policies and programmes.
The Child Safety Report Card 2012 provides an invaluable tool to encourage new policy initiatives. It
uses 100 evidence based measures, across 31 countries, to show how safety consciousness is embodied
in national plans. It assesses the impact of current actions being taken to improve child safety and
highlights “best practice”.
The Report Card also shows the need for better monitoring of safety standards and consistent
implementation of regulations at both the EU and Member State levels.
I am pleased to support the European Child Safety Alliance and thank them for their work on this very
important initiative.
Message by John Dalli, European Commissioner for Health and Consumer Policy
Injuries are the leading cause of death and disability for children in the European Union.
Its incidence, however, varies widely, with a ve-fold difference in child injury mortality
rates between EU Member States.
I believe we must do everything we can to ensure the safety of the youngest and
most vulnerable members of our society across Europe. This is why the EU Health
programme supports initiatives to reduce accidents and injuries.
The Child Safety Report Card 2012: Europe Summary for 31 countries is one such successful initiative.
Its assessment of the current level of safety in Member States and of evidence-based actions makes a
valuable contribution in reducing child deaths and disability.
Deaths caused as a result of childhood injury cause unimaginable suffering for the families left behind.
The European Union and its Member States must cooperate and act to ensure the right of all children
to safety. This initiative provides support to raise the level of health, well being and growth for children
in Europe.
What are child safety report cards?
Child injury is a leading cause of death for children in Europe and the #1 leading cause for children
and adolescents 5-19 years of age. Deaths are the ‘tip of the injury burden iceberg’ with many more
children suffering enormous long-term consequences in terms of physical disability and psychological
effects, which in turn represents a large cost to society. The child safety report cards are a tool that
was specically designed to bring attention to this deadly and debilitating threat.
There are large differences in rates of injury between countries and within countries and injury has
a steeper social class gradient than any other cause of childhood death or long-term disability. As
such, child injury is a major public health issue – one that is killing and injuring members of the next
generation of adults and wage earners who should provide social and economic funding for countries
in Europe in the future. Yet for some reason child injury does not provoke the response one might
expect, given the heavy burden and the length of time this critical issue has existed.
Child safety report cards were devised to allow:
a comparative assessment of the burden of unintentional child injury
a comparative assessment of the adoption, implementation and enforcement of national level
policy measures that are known to work
a within country review of strengths, weaknesses and gaps; thereby providing guidance on
where to focus action
a benchmarking exercise both within countries over time and across countries, which can serve
to inspire and motivate further progress
an important mechanism to identify, share, utilise and adapt the experience gained from across
Europe
a rst insight into the links between effective policies and health outcomes.
The child safety report cards for 2012 are an overview that summarise countries’ levels of safety
provided to their youngest and most vulnerable citizens through national policy up to July 2011. They
are based on an examination of evidenced good practice policies to support child and adolescent
safety in each country and include policies in nine areas of unintentional injury in addition to leadership,
infrastructure and capacity actions that support child injury prevention efforts. The 2012 report cards
represent rst time report cards for four countries and updates for the remaining 27.
1
This Europe
Summary for 31 countries provides an overview and summary of the report card results of all 31
countries that participated in the child safety report cards in 2012.
What is new in 2012?
In this round of report cards, produced as part of Tools to Address Childhood Trauma, Injury and
Children’s Safety (TACTICS) project, we have assessed several new policies related to unintentional
injury in addition to those that were assessed in 2007 and 2009. As a result, we present three sets of
scores in this European summary report – one for the newly expanded set of indicators for the 31
countries that participated in 2012 (pages 6-7), one based on the original set of indicators from 2007
for the 16 countries that participated in both the 2007 and 2012 report cards (pages 8-9) and one
based on the expanded set of indicators used in 2009 for the 24 countries that participated in both
2009 and 2012 (pages 10-11). In addition, we examine whether there have been statistically signicant
changes in overall performance scores over the ve years since the rst report cards were produced.
As part of TACTICS we are also beginning to look more closely at the issue of inequalities and
inequity as they relate to child injury. Although a more comprehensive report on child injury and
inequity will be released in 2014, we begin to explore the issue in this report including looking at the
related report card results (pages 46-48).
1
1 First report cards: Bulgaria, Croatia, Romania and Slovakia; 31 countries includes England, Scotland and Wales as
constituent countries of the United Kingdom.
2
How do the countries measure up?
Despite the injury reductions and safety improvements over the last 20 to 30 years, injury remains
a leading cause of death for children and adolescents in every Member State in Europe. More
children aged 5-19 years die of injuries than all other causes combined.
It has been estimated by researchers that if strategies known to be effective were
uniformly implemented up to 90% of injuries could be prevented. One way to
quantify the potential gains for injury prevention in Europe is to examine the deaths in excess of
what would have been expected if all countries had the same child injury death rate as the EU
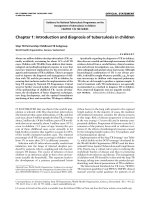
Member State with the lowest rate. It is estimated that in 2010 alone, there would
have been over 3800 fewer deaths to children and adolescents in the 31
countries participating in the TACTICS report cards if rates in all countries
had matched the Netherlands’s injury rate.
2
And beyond that, there are still gains to be
had in the Netherlands, which means the potential life savings across the countries are even greater.
Potential for life saving in children and adolescents
in participating TACTICS countries
(number of deaths using the EU MS with the lowest rate)
Source: WHO European Detailed Mortality Database (EDMD); 2010 or most recent year available; Cyprus, Iceland,
Luxembourg and Malta excluded because of small numbers.
0
Bulgaria
Belgium
Greece
Lithuania
Czech Republic
Netherlands
Hungary
Israel
Portugal
Austria
Finland
Ireland
Sweden
Slovakia
Norway
Croatia
Denmark
Latvia
Estonia
Slovenia
France
Poland
Germany
United Kingdom
Italy
Romania
Spain
0 1220
215
552
285
198
222
703
419
453
225
575
745
768
424
773
11
24
58
37
62
57
60
13
64
64
56
41
47
79
0
91
173
104
147
208
20
14
23
67
47
62
61
110
61
62
88
111
134
106
198
107
38
111
122
75
400
31
38
81
104
109
119
121
123
125
126
144
152
181
185
198
198
211
215
269
283
777
860
943
990
1127
1192
668
2 The measure for potential life savings (avoidable deaths) compares countries using the most recent year of data available to the EU
Member State with the lowest overall injury rate in the reference year: for this report the Netherlands rate of 5.05/100,000
number of deaths at European lowest rate
number of potential lifes saved
total number of reported deaths
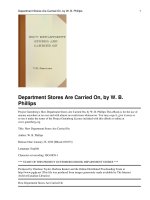
Of the 35,000+ children and adolescents under age 20 years who die each year in the EU, about
24% or roughly 9,100 deaths are due to injuries. Over two thirds of these are unintentional
injuries (those injuries which occur without intent of harm). There is great variability between the
best performing countries compared to poorer performing countries with just under a 5 times
difference in ‘all injury’ rates and over a 6 times difference in ‘unintentional injury’ rates between
the countries with the highest and lowest rates. Of the 31 countries that participated in these
report card assessments, the highest rates for both ‘all injury’ and ‘unintentional injury’ are found
in Lithuania, Bulgaria and Romania.
3
0 25
Lithuania
Bulgaria
Romania
Latvia
Estonia
Poland
Belgium
Croatia
Ireland
EU27
Greece
Finland
Slovakia
Norway
Czech Republic
Hungary
Denmark
France
Austria
Slovenia
Spain
Italy
Israel
Portugal
Germany
United Kingdom
Sweden
Netherlands
25
4.99
5.02
6.01
6.16
6.81
7.05
7.21
7.27
7.36
7.49
7.60
7.81
8.09
8.54
9.19
9.27
9.31
9.43
9.57
10.66
10.84
10.93
11.64
12.04
16.06
17.20
17.37
23.91
3.06
2.73
4.98
4.40
5.86
4.76
6.31
6.54
5.23
5.32
5.97
6.61
5.52
6.95
6.09
8.26
6.06
8.95
7.46
6.61
8.74
8.13
8.56
8.93
12.99
14.65
15.22
17.38
Source: WHO European Detailed Mortality Database (EDMD) for 2010 or most recent year of data; Cyprus, Iceland,
Luxembourg and Malta excluded due to small numbers.
All injury and unintentional injury deaths for children and adolescents
(Europe age adjusted rate per 100 000 population 0-19 years)
Further there are signicant differences in injuries by age and gender, the youngest and the oldest in
the age group experiencing higher rates.
0
5
10
15
25
30
35
40
15-19 years10-14 years5-9 years1-4 years< 1 year
male - all injuries
male - unintentional
females - all injuries
female - unintentional
Source: WHO European Detailed Mortality Database (EDMD); EU average for 2008-2010 or most recent three years of data.
unintentional injury
all injury
4
Overall child safety grades
All countries in Europe have adopted, implemented and enforced some policy actions that support
child and adolescent safety, but this third set of Child Safety Report Cards signals that much more
can be done to make life safer for children and adolescents. The overall level of safety provided to
children and adolescents with respect to unintentional injuries in the 31 countries participating in
these report cards was assessed by examining and grading the level of adoption, implementation and
enforcement of evidenced based national policies in:
1) nine areas of safety relevant to children and adolescents
• moped/motor scooter safety,
• passenger/driver safety,
• pedestrian safety,
• cycling safety,
• water safety/drowning prevention,
• fall prevention,
• poisoning prevention,
• burn/scald prevention, and
• choking/strangulation prevention.
2) three areas looking at strategies to support child safety efforts
• leadership,
• infrastructure and
• capacity.
Countries were given a score out of 5 stars, where 5 stars was the best possible score for each of
these 12 areas based on their adoption, implementation and enforcement of national policy specic
to each area. An overall grade was calculated by adding together the number of stars over the 12
areas out of a total of 60.
Netherlands
Belgium
England
Scotland
Northern
Ireland
Norway
Iceland
Cyprus
Denmark
Sweden
Poland
Czech Rep
Austria
Estonia
Malta
Italy
Greece
Spain
Portugal
Hungary
Germany
France
Israel
Finland
Wales
Ireland
Latvia
Lithuania
Slovenia
Bulgaria
Croatia
Slovakia
Romania
Luxembourg
49 – 60 excellent
37– 48.5 good
25 – 36.5 fair
13 – 24.5 poor
0 – 12.5 unacceptable
non-participants
Performance grade out of 60 stars
TACTICS average: 35.0 stars
Overall child
safety grades in
Europe
(31 countries)
5
Child Safety Scores in 31 countries
The table on the following page provides the overall safety performance grade and the scores out of
5 stars for each of the 12 issues in the 31 participating countries for policies up to July 2011.
The scores for the individual issue areas and overall score and grade differ between countries.
None of the participating countries have adopted and implemented all of the recommended
evidence-based policies for all sub-areas examined. However, nine countries (Austria, Denmark,
Finland, Iceland, Ireland, Latvia, Romania, Slovenia and Spain) have adopted all the moped/
motor scooter safety measures; three countries (Czech Republic, Germany and Slovenia) have
adopted all the pedestrian safety measures; ve countries (Austria, Croatia, Czech Republic,
Latvia and Slovenia) have adopted all the cycling safety measures and two (Czech Republic and
Sweden) have adopted all the capacity-related actions to support child safety.
Countries with lower scores in a specic sub-area can look to the experiences and successes
of countries with stronger scores to assist in making their countries safer for children and
adolescents.
Key ndings
Countries that participated in the report card assessments received grades in the middle of the
scale, with none receiving a grade of excellent, indicating room for improvement in all countries.
Sixteen countries (Austria, Czech Republic, Finland, Germany, Iceland, Ireland, Israel, Italy, Latvia,
Malta, Netherlands, Poland, Scotland, Slovenia, Spain and Sweden) received an overall grade of
good performance, thirteen received an overall grade of fair performance (Belgium, Croatia,
Denmark, England, France, Hungary, Lithuania Luxembourg, Norway, Romania, Portugal, Slovakia
and Wales) and two received an overall grade of poor performance (Bulgaria and Greece).
Generally speaking child safety grades based on adoption, implementation and enforcement of
evidenced good practice policy correspond reasonably well to the overall rate of unintentional
injury deaths (i.e., countries with lower injury rates achieved higher safety grades in this
assessment; Pearson correlation coefcient -0.462, p<0.01).
There is room for improvement in all countries, as none have adopted and implemented all the
recommended evidence-based policies.
The detailed results for individual policies for each injury area are not included in this summary
report card but are available in the country specic report cards, which can be downloaded from the
European Child Safety Alliance website at www.childsafetyeurope.org
6
= 49-60 stars – excellent performance,
= 37-48.5 stars – good performance,
= 25-36.5 stars – fair performance,
Pedestrian
safety
Passenger/
driver safety
Moped/motor
scooter safety
Cycling safety
Water safety/
drowning
prevention
Fall
prevention
Poisoning
prevention
Burn/scald
prevention
Choking/
strangulation
prevention
Child safety
leadership
Child safety
infrastructure
Child safety
capacity
Overall score Overall grade
Austria
4.5 3.5 5 5 2.5 1.5 3 2.5 2.5 1.5 3 3 37.5
Austria
Belgium
3.5 3 4 2.5 1.5 2 3 2.5 2.5 1 1 2 28.5
Belgium
Bulgaria
3.5 2.5 4 3.5 2.5 1.5 0.5 1 1 1 1.5 0.5 23
Bulgaria
Croatia
4.5 2.5 3.5 5 0.5 0.5 1.5 1 1.5 3 3.5 2.5 29.5
Croatia
Czech
Republic
5 3 3.5 5 4 2 3 2.5 2.5 4 4 5 43.5
Czech
Republic
Denmark
3.5 2 5 2.5 1 3 3.5 3 3 1 2 2.5 32
Denmark
England
3.5 3.5 4 1 1 3 3.5 3 3 4 3.5 3 36
England
Finland
4.5 4 5 4.5 3 3 3.5 3.5 3 3 3.5 4.5 45
Finland
France
3.5 2.5 4.5 2.5 3.5 1.5 2 2.5 2 2 3 2 31.5
France
Germany
5 3 3.5 3.5 1 2 4.5 2.5 4 4 3 3 39
Germany
Greece
0.5 0 3 0 1.5 0 1 0.5 0.5 2.5 2 3 14.5
Greece
Hungary
4.5 2.5 4.5 3 1.5 1.5 3 1.5 2 3.5 3.5 4 35
Hungary
Iceland
4 4.5 5 4.5 3.5 3.5 4.5 3.5 2.5 3.5 3 2.5 44.5
Iceland
Ireland
4 4 5 3.5 3 2.5 3 3.5 2.5 3 3.5 3 40.5
Ireland
Israel
3.5 3.5 4.5 4.5 3.5 1 3 2 1 3.5 4 4 38
Israel
Italy
1.5 2 4.5 2.5 3.5 3 4.5 3 4 3 3.5 3.5 38
Italy
Latvia
3.5 4 5 5 2 1.5 3 3 3 2.5 3.5 3 39
Latvia
Lithuania
3.5 2.5 4.5 2.5 2 2 2 3 3 2 2 3 32
Lithuania
Luxembourg
4 2.5 4 2.5 2 1 1 2 2 2 2 2.5 27.5
Luxembourg
Malta
4 3 4.5 4.5 2.5 2 3 3 2.5 2 3 4.5 38.5
Malta
Netherlands
4 3 4.5 3.5 2.5 4 4.5 3.5 2.5 4.5 4 3 43.5
Netherlands
Norway
2.5 3 4 2.5 2 2.5 3 2.5 3 3 3.5 3.5 35
Norway
Poland
4 3 4.5 4 3.5 2 4 3 2.5 4.5 4 4.5 43.5
Poland
Portugal
1.5 3 4 1 2 2 3.5 2,5 2 3 2 3.5 30
Portugal
Romania
3.5 3 5 2.5 1.5 1 0.5 2 2 2.5 2 0.5 26
Romania
Scotland
4 3.5 4.5 3.5 1 2 2.5 3 3 4 3 3.5 37.5
Scotland
Slovakia
3.5 2.5 4.5 3.5 1 1 1.5 1 2 1.5 1.5 3.5 27
Slovakia
Slovenia
5 3.5 5 5 4 2 2.5 2 2.5 4.5 3.5 2.5 42
Slovenia
Spain
2.5 3 5 4.5 3 1.5 3.5 2.5 2.5 3.5 3 4.5 39
Spain
Sweden
3 2 4.5 3.5 1.5 3 3.5 4 3 3.5 4.5 5 41
Sweden
Wales
2 3 4 1 1 1.5 2.5 3 2.5 3 4.5 3 31
Wales
TACTICS
average
3.5 3.0 4.5 3.5 2.0 2.0 3.0 2.5 2.5 3.0 3.0 3.0 35
TACTICS
average
Child Safety Scores in 31 countries
7
Pedestrian
safety
Passenger/
driver safety
Moped/motor
scooter safety
Cycling safety
Water safety/
drowning
prevention
Fall
prevention
Poisoning
prevention
Burn/scald
prevention
Choking/
strangulation
prevention
Child safety
leadership
Child safety
infrastructure
Child safety
capacity
Overall score Overall grade
Austria
4.5 3.5 5 5 2.5 1.5 3 2.5 2.5 1.5 3 3 37.5
Austria
Belgium
3.5 3 4 2.5 1.5 2 3 2.5 2.5 1 1 2 28.5
Belgium
Bulgaria
3.5 2.5 4 3.5 2.5 1.5 0.5 1 1 1 1.5 0.5 23
Bulgaria
Croatia
4.5 2.5 3.5 5 0.5 0.5 1.5 1 1.5 3 3.5 2.5 29.5
Croatia
Czech
Republic
5 3 3.5 5 4 2 3 2.5 2.5 4 4 5 43.5
Czech
Republic
Denmark
3.5 2 5 2.5 1 3 3.5 3 3 1 2 2.5 32
Denmark
England
3.5 3.5 4 1 1 3 3.5 3 3 4 3.5 3 36
England
Finland
4.5 4 5 4.5 3 3 3.5 3.5 3 3 3.5 4.5 45
Finland
France
3.5 2.5 4.5 2.5 3.5 1.5 2 2.5 2 2 3 2 31.5
France
Germany
5 3 3.5 3.5 1 2 4.5 2.5 4 4 3 3 39
Germany
Greece
0.5 0 3 0 1.5 0 1 0.5 0.5 2.5 2 3 14.5
Greece
Hungary
4.5 2.5 4.5 3 1.5 1.5 3 1.5 2 3.5 3.5 4 35
Hungary
Iceland
4 4.5 5 4.5 3.5 3.5 4.5 3.5 2.5 3.5 3 2.5 44.5
Iceland
Ireland
4 4 5 3.5 3 2.5 3 3.5 2.5 3 3.5 3 40.5
Ireland
Israel
3.5 3.5 4.5 4.5 3.5 1 3 2 1 3.5 4 4 38
Israel
Italy
1.5 2 4.5 2.5 3.5 3 4.5 3 4 3 3.5 3.5 38
Italy
Latvia
3.5 4 5 5 2 1.5 3 3 3 2.5 3.5 3 39
Latvia
Lithuania
3.5 2.5 4.5 2.5 2 2 2 3 3 2 2 3 32
Lithuania
Luxembourg
4 2.5 4 2.5 2 1 1 2 2 2 2 2.5 27.5
Luxembourg
Malta
4 3 4.5 4.5 2.5 2 3 3 2.5 2 3 4.5 38.5
Malta
Netherlands
4 3 4.5 3.5 2.5 4 4.5 3.5 2.5 4.5 4 3 43.5
Netherlands
Norway
2.5 3 4 2.5 2 2.5 3 2.5 3 3 3.5 3.5 35
Norway
Poland
4 3 4.5 4 3.5 2 4 3 2.5 4.5 4 4.5 43.5
Poland
Portugal
1.5 3 4 1 2 2 3.5 2,5 2 3 2 3.5 30
Portugal
Romania
3.5 3 5 2.5 1.5 1 0.5 2 2 2.5 2 0.5 26
Romania
Scotland
4 3.5 4.5 3.5 1 2 2.5 3 3 4 3 3.5 37.5
Scotland
Slovakia
3.5 2.5 4.5 3.5 1 1 1.5 1 2 1.5 1.5 3.5 27
Slovakia
Slovenia
5 3.5 5 5 4 2 2.5 2 2.5 4.5 3.5 2.5 42
Slovenia
Spain
2.5 3 5 4.5 3 1.5 3.5 2.5 2.5 3.5 3 4.5 39
Spain
Sweden
3 2 4.5 3.5 1.5 3 3.5 4 3 3.5 4.5 5 41
Sweden
Wales
2 3 4 1 1 1.5 2.5 3 2.5 3 4.5 3 31
Wales
TACTICS
average
3.5 3.0 4.5 3.5 2.0 2.0 3.0 2.5 2.5 3.0 3.0 3.0 35
TACTICS
average
= 13-24.5 stars – poor performance,
= 0-12.5 stars – unacceptable performance
8
Comparison of report card scores
2007-2012 and 2009-2012
Changes 2007-2012
Thirteen countries participated in all three sets of report cards (2007, 2009 and 2012) and three others
participated in 2007 and 2012 allowing a comparison of scores based on the original 94 indicators in
16 countries (see table below).
All countries increased their scores in at least one sub-area (range 1-11).
All sub-area averages showed an increase of at least 0.5 stars over the 16 countries except for
moped/motor scooter, passenger, pedestrian and water safety. However the variation for each sub-
area across the different years was too small to undertake trend analyses of individual sub-areas.
The sub-area with the most countries reporting an improved score was falls (12/16) and this
was for the most part the result of establishing an action plan, educational programme and/or a
media campaign addressing the issue. Other areas with a greater number of countries reporting
an increased score were burns/scalds (11/16) and pedestrian safety (10/16), child safety leadership
(10/16) and child safety capacity (10/16).
Pedestrian
safety
Passenger
safety
Moped/motor
scooter safety
Cycling safety
Water safety/
drowning
prevention
Fall
prevention
Poisoning
prevention
Burn/scald
prevention
Choking/
strangulation
prevention
Child safety
leadership
Child safety
infrastructure
Child safety
capacity
Overall score
2007
2009
2012
2007
2009
2012
2007
2009
2012
2007
2009
2012
2007
2009
2012
2007
2009
2012
2007
2009
2012
2007
2009
2012
2007
2009
2012
2007
2009
2012
2007
2009
2012
2007
2009
2012
2007
2009
2012
Austria
3 5 5 2.5 3 3 4 4.5 4.5 1 4 5 2 3 2.5 1.5 2.5 2 1 3 3 1 2.5 2.5 2 2.5 2.5 1 1.5 1 4 3 3.5 4 4 4 27 38.5 38.5
Austria
Belgium
3.5 4 3.5 2.5 3 2.5 3 3 3.5 1 1 2.5 2.5 2.5 2 3 2.5 2 3.5 4 2.5 3 3 2.5 2.5 2.5 2.5 1 1 0 1.5 1.5 1 1 1.5 2 28 29.5 26.5
Belgium
Czech
Republic
3 4 3.5 3.5 3 3 3 5 5 3 4.5 5 2 3.5 4 0.5 2 2 1.5 2.5 2.5 1.5 3 2 2 2 2.5 3 4.5 4.5 4 4 5 4 4 5 31 42 44
Czech
Republic
Denmark
4 - 3.5 3.5 - 2 4.5 - 4.5 4 - 2.5 2 - 1 1.5 - 3.5 2.5 - 3.5 2.5 - 3 2.5 - 3 2.5 - 1 5 - 2.5 5 - 3 39.5 - 33
Denmark
France
3.5 4 3.5 3 3.5 2.5 4.5 5 4.5 3 4 2.5 2.5 3.5 3.5 3 3 1.5 3.5 2.5 1.5 3 3.5 2.5 3 3 2 2 2 1 2 3 3 4 3 2.5 37 40 30.5
France
Germany
4 4 5 3 3 3 3.5 3.5 3.5 4 4 3.5 1 1 1 1.5 1.5 3 2.5 2.5 4 2 2.5 3 2.5 3 4.5 3.5 4.5 4 3 3 3 5 5 4.5 35.5 37.5 42
Germany
Greece
1.5 4 0.5 3 4.5 0.5 4 4 2.5 1 0 0 1.5 2 1 1.5 1 0 0 1.5 0 0.5 0.5 0.5 1.5 1.5 0.5 0 1.5 2 3.5 4 3 3 4 4 21 28.5 14.5
Greece
Hungary
3 4 4.5 3 3 2.5 5 4.5 4.5 4 3 3 1.5 1.5 2 1.5 2 2 2.5 3.5 3 1 2 1.5 2 2 2 2 2.5 3.5 2.5 4.5 4 4 5 5 32 37.5 37.5
Hungary
Italy
1.5 1.5 1.5 2 2 3 4 4 4.5 1 0 2.5 2.5 3 3.5 2 2 3 1.5 3.5 4.5 1 1.5 3 2 2 4 2 4 2 3 4 3.5 4 4 3.5 26.5 31.5 35.5
Italy
Netherlands
3.5 3.5 4 3 3 3.5 4.5 5 4.5 2.5 4 3.5 2 2 2.5 2.5 3 4.5 4 4.5 4 3 3 3.5 2.5 2.5 2.5 4.5 4.5 4.5 4 4.5 5 4 5 5 40 44.5 47
Netherlands
Norway
3.5 - 2.5 3.5 - 3.5 4 - 3.5 4 - 2.5 2 - 2 2 - 2.5 1.5 - 2.5 2.5 - 2.5 2.5 - 3 2 - 3 4 - 3.5 4 - 4 35.5 - 35
Norway
Poland
3.5 - 4 3.5 - 3 4.5 - 4.5 3 - 3.5 3 - 3.5 2 - 2 1.5 - 3.5 2 - 3 2.5 - 2.5 1 - 4 3.5 - 3.5 2 - 4.5 32 - 41.5
Poland
Portugal
1 1.5 1.5 3 3 3 3 3.5 3.5 1 1 1 0.5 2 2 0.5 1 2 1.5 2.5 3.5 0.5 1.5 2.5 0.5 2 2 1.5 1.5 3 2.5 2.5 2.5 3.5 4 4 19 26 30
Portugal
Scotland
3.5 3.5 4 3 3 3 4 4.5 4.5 1 2.5 3.5 1 1.5 1 1 2 2 3 3 2 3 3 2.5 2.5 2.5 3 1.5 1.5 3.5 2.5 3.5 3.5 5 5 5 31 35.5 37.5
Scotland
Spain
1.5 1.5 2.5 3.5 4 3 5 5 5 2 2 4.5 2 2 3 0 0.5 2 3.5 4 3.5 1.5 2 3 0.5 1.5 2.5 1 1.5 3.5 1 2.5 3.5 1 3 5 22.5 29.5 41
Spain
Sweden
1.5 1 3 3.5 3.5 2 5 4.5 4.5 5 5 3.5 2 2 1.5 2 2 3 4 4 3.5 3 4 4 3 3 3 2.5 4 3.5 4.5 4.5 4.5 4 5 5 40 42.5 41
Sweden
TACTICS
average
3 3 3 3 3 2.5 4 4.5 4 2.5 2.5 3 2 2.5 2 1.5 2 2.5 2.5 3 3 2 2.5 2.5 2 2.5 2.5 2 2.5 2.5 3 3.5 3.5 3.5 4 4 31.5 35.5 37
TACTICS
average
= 49-60 stars – excellent performance,
= 37-48.5 stars – good performance,
= 25-36.5 stars – fair performance,
Changes in scores 2007 to 2012
9
Pedestrian
safety
Passenger
safety
Moped/motor
scooter safety
Cycling safety
Water safety/
drowning
prevention
Fall
prevention
Poisoning
prevention
Burn/scald
prevention
Choking/
strangulation
prevention
Child safety
leadership
Child safety
infrastructure
Child safety
capacity
Overall score
2007
2009
2012
2007
2009
2012
2007
2009
2012
2007
2009
2012
2007
2009
2012
2007
2009
2012
2007
2009
2012
2007
2009
2012
2007
2009
2012
2007
2009
2012
2007
2009
2012
2007
2009
2012
2007
2009
2012
Austria
3 5 5 2.5 3 3 4 4.5 4.5 1 4 5 2 3 2.5 1.5 2.5 2 1 3 3 1 2.5 2.5 2 2.5 2.5 1 1.5 1 4 3 3.5 4 4 4 27 38.5 38.5
Austria
Belgium
3.5 4 3.5 2.5 3 2.5 3 3 3.5 1 1 2.5 2.5 2.5 2 3 2.5 2 3.5 4 2.5 3 3 2.5 2.5 2.5 2.5 1 1 0 1.5 1.5 1 1 1.5 2 28 29.5 26.5
Belgium
Czech
Republic
3 4 3.5 3.5 3 3 3 5 5 3 4.5 5 2 3.5 4 0.5 2 2 1.5 2.5 2.5 1.5 3 2 2 2 2.5 3 4.5 4.5 4 4 5 4 4 5 31 42 44
Czech
Republic
Denmark
4 - 3.5 3.5 - 2 4.5 - 4.5 4 - 2.5 2 - 1 1.5 - 3.5 2.5 - 3.5 2.5 - 3 2.5 - 3 2.5 - 1 5 - 2.5 5 - 3 39.5 - 33
Denmark
France
3.5 4 3.5 3 3.5 2.5 4.5 5 4.5 3 4 2.5 2.5 3.5 3.5 3 3 1.5 3.5 2.5 1.5 3 3.5 2.5 3 3 2 2 2 1 2 3 3 4 3 2.5 37 40 30.5
France
Germany
4 4 5 3 3 3 3.5 3.5 3.5 4 4 3.5 1 1 1 1.5 1.5 3 2.5 2.5 4 2 2.5 3 2.5 3 4.5 3.5 4.5 4 3 3 3 5 5 4.5 35.5 37.5 42
Germany
Greece
1.5 4 0.5 3 4.5 0.5 4 4 2.5 1 0 0 1.5 2 1 1.5 1 0 0 1.5 0 0.5 0.5 0.5 1.5 1.5 0.5 0 1.5 2 3.5 4 3 3 4 4 21 28.5 14.5
Greece
Hungary
3 4 4.5 3 3 2.5 5 4.5 4.5 4 3 3 1.5 1.5 2 1.5 2 2 2.5 3.5 3 1 2 1.5 2 2 2 2 2.5 3.5 2.5 4.5 4 4 5 5 32 37.5 37.5
Hungary
Italy
1.5 1.5 1.5 2 2 3 4 4 4.5 1 0 2.5 2.5 3 3.5 2 2 3 1.5 3.5 4.5 1 1.5 3 2 2 4 2 4 2 3 4 3.5 4 4 3.5 26.5 31.5 35.5
Italy
Netherlands
3.5 3.5 4 3 3 3.5 4.5 5 4.5 2.5 4 3.5 2 2 2.5 2.5 3 4.5 4 4.5 4 3 3 3.5 2.5 2.5 2.5 4.5 4.5 4.5 4 4.5 5 4 5 5 40 44.5 47
Netherlands
Norway
3.5 - 2.5 3.5 - 3.5 4 - 3.5 4 - 2.5 2 - 2 2 - 2.5 1.5 - 2.5 2.5 - 2.5 2.5 - 3 2 - 3 4 - 3.5 4 - 4 35.5 - 35
Norway
Poland
3.5 - 4 3.5 - 3 4.5 - 4.5 3 - 3.5 3 - 3.5 2 - 2 1.5 - 3.5 2 - 3 2.5 - 2.5 1 - 4 3.5 - 3.5 2 - 4.5 32 - 41.5
Poland
Portugal
1 1.5 1.5 3 3 3 3 3.5 3.5 1 1 1 0.5 2 2 0.5 1 2 1.5 2.5 3.5 0.5 1.5 2.5 0.5 2 2 1.5 1.5 3 2.5 2.5 2.5 3.5 4 4 19 26 30
Portugal
Scotland
3.5 3.5 4 3 3 3 4 4.5 4.5 1 2.5 3.5 1 1.5 1 1 2 2 3 3 2 3 3 2.5 2.5 2.5 3 1.5 1.5 3.5 2.5 3.5 3.5 5 5 5 31 35.5 37.5
Scotland
Spain
1.5 1.5 2.5 3.5 4 3 5 5 5 2 2 4.5 2 2 3 0 0.5 2 3.5 4 3.5 1.5 2 3 0.5 1.5 2.5 1 1.5 3.5 1 2.5 3.5 1 3 5 22.5 29.5 41
Spain
Sweden
1.5 1 3 3.5 3.5 2 5 4.5 4.5 5 5 3.5 2 2 1.5 2 2 3 4 4 3.5 3 4 4 3 3 3 2.5 4 3.5 4.5 4.5 4.5 4 5 5 40 42.5 41
Sweden
TACTICS
average
3 3 3 3 3 2.5 4 4.5 4 2.5 2.5 3 2 2.5 2 1.5 2 2.5 2.5 3 3 2 2.5 2.5 2 2.5 2.5 2 2.5 2.5 3 3.5 3.5 3.5 4 4 31.5 35.5 37
TACTICS
average
Eleven out of the 16 countries appear to have made progress in the ve years between
assessments, with the greatest improvements in score found in Spain and the Czech Republic.
In 2007 the 16 countries represented a ratio of good:fair:poor performance of 3:11:2 and in 2012
this has improved to 7:9:1, demonstrating a marked improvement.
The average overall safety performance score increased from 31.5 in 2007 to 36 in 2012. The
average increase of 5.09 was statistically signicant (p=0.019; 95% condence interval 0.96,9.22).
Changes 2009-2012
Twenty-four countries participated in both the 2009 and 2012 allowing a comparison of scores based on
102 indicators - the original 94 plus the eight indicators added in 2009 (see table on next page).
All countries increased their scores in at least one sub-area (range 0-9 sub-areas) except France.
There were only three sub-areas where the average score increased (cycling, burns/scalds and
choking/strangulation).
The sub-area with the most countries reporting an improved score was burn/scald prevention
(16/24 countries showed an improvement) and this is most likely the result of the introduction
of policy at the EU level addressing child resistant lighters and reduced ignition propensity (RIP)
= 13-24.5 stars – poor performance,
= 0-12.5 stars – unacceptable performance
10
cigarettes that beneted from action at the Member State level. Other areas with a greater number
of countries reporting an improved score were leadership (15/24), water safety (14/24) and choking
strangulation (13/24).
Eighteen countries reported progress in the two years between assessments, with the greatest
improvements in score found in Spain, Ireland, Italy and Latvia. Of the six countries whose scores
decreased, the governments of two (Iceland and Greece) have faced nancial crises during the period.
Pedestrian
safety
Passenger
safety
Moped/motor
scooter
safety
Cycling safety
Water safety/
drowning
prevention
Fall
prevention
Poisoning
prevention
Burn/scald
prevention
Choking/
strangulation
prevention
Child safety
leadership
Child safety
infrastructure
Child safety
capacity
Overall score
2009
2012
2009
2012
2009
2012
2009
2012
2009
2012
2009
2012
2009
2012
2009
2012
2009
2012
2009
2012
2009
2012
2009
2012
2009
2012
Austria
5 5 4 3.5 4.5 4.5 4 5 3 2.5 3 2 3 3 2.5 2.5 2.5 2.5 2 1.5 3 3 4 4 40.5 39
Austria
Belgium
4 3.5 3.5 3 3 3.5 1 2.5 2.5 2 2 2 4 3 3 2.5 2.5 2.5 1.5 0.5 1 0.5 1.5 2 29.5 27.5
Belgium
Czech
Republic
4 5 3 2.5 5 5 4.5 5 3.5 4 2.5 2.5 3 3 2.5 2.5 2 2.5 4.5 5 3.5 4.5 4 5 42 46.5
Czech
Republic
England
4 3.5 3.5 3.5 4 3.5 4 1 1.5 1.5 3 2.5 2.5 3.5 2.5 3 2.5 3 4 3 3.5 3 4.5 5 39.5 36
England
Finland
4 4.5 3.5 4 5 5 4.5 4.5 2 2.5 3 3 3 3.5 2.5 3.5 2.5 3 1.5 2.5 3 4 4 4 38.5 44
Finland
France
4 3.5 3.5 3 5 4.5 4 2.5 3.5 3.5 2.5 1.5 3 2 3 2.5 3 2 2.5 1.5 3 3 3 2.5 40 32
France
Germany
4 3.5 3.5 3.5 3.5 3.5 4 3.5 1 1 2 3 3 4 2.5 2.5 3 4.5 4.5 4 3 3 5 4.5 39 40.5
Germany
Greece
4 0.5 3.5 0 4 2.5 0 0 2 1 1 0 2 1 0.5 0.5 1.5 0.5 1 2 3.5 2.5 4 4 27 14.5
Greece
Hungary
4 4.5 3.5 2.5 4.5 4.5 3 3 1.5 2 1.5 2 3.5 3 1.5 1.5 2 2 2 3 4.5 4.5 5 5 36.5 37.5
Hungary
Iceland
4 4 4 4.5 4.5 5 4.5 4.5 4 3.5 4 3.5 4.5 4.5 4.5 3.5 3 2.5 2.5 3 4 3 5 3 48.5 44.5
Iceland
Ireland
4 4 2.5 4 4.5 5 2 3.5 2.5 3 2 2 1 3 2 3.5 2.5 2.5 1 2.5 3 3.5 4 4 31 40.5
Ireland
Israel
2 3.5 3 3 4 4.5 3 4.5 3 4 1.5 1 2 3 1.5 2 1.5 1 2.5 3.5 4 4 3.5 4 31.5 38
Israel
Italy
1.5 1.5 2 3 4 4.5 0 2.5 3 3.5 2 3 3.5 4.5 1 3 2 2.5 4 2.5 3 4 4 4 30 38
Italy
Latvia
3.5 3.5 4.5 4.5 4 5 3 5 1.5 2.5 1.5 2 2 3 2 3 2.5 3 2.5 2.5 4 3.5 3 5 34 42.5
Latvia
Lithuania
2.5 3.5 3.5 3 4.5 4.5 4 3.5 2 2 1.5 2 2.5 2 2 3 3 3 1.5 1.5 3 3 2.5 3 32.5 34
Lithuania
Luxembourg
4 4 3 3 4 3.5 2.5 2.5 2 2.5 1 1 0.5 1 1 2 2 2 0.5 1 1 2 2.5 2.5 24 27
Luxembourg
Malta
3.5 4 3 3 4.5 4.5 4.5 4.5 2 2.5 1 2 2 3 2 3 1.5 2.5 1 1.5 2.5 2.5 4 4 31.5 37
Malta
Netherlands
3.5 4 3.5 3.5 5 4.5 4 3.5 2 2.5 3.5 4.5 4.5 4.5 3 3.5 2.5 2.5 4.5 4.5 4.5 5 5 5 45.5 47.5
Netherlands
Portugal
1.5 1.5 3.5 3 3.5 3.5 1 1 2 2.5 1 1.5 3 3.5 1.5 2 2 2 2 3 2 2 4 4 27 29.5
Portugal
Scotland
3.5 4 3.5 3.5 4.5 4.5 2.5 3.5 1.5 1 2 2 3 2.5 2.5 3 2.5 3 1.5 4 3.5 3.5 5 4.5 35.5 39
Scotland
Slovenia
5 5 3.5 3.5 4.5 5 5 5 3.5 4 2.5 2.5 2.5 2.5 1.5 2 2 2.5 3 4 4 4.5 3.5 3 40.5 43.5
Slovenia
Spain
1.5 2.5 3.5 3.5 5 5 2 4.5 2 3 0.5 1.5 4.5 3.5 2 2.5 1.5 2.5 1.5 3.5 2 3.5 3 5 29 40.5
Spain
Sweden
1 3 3.5 2 4.5 4.5 5 3.5 2 2 2.5 3 4.5 3.5 4 3.5 3 3 4 3.5 4 4.5 5 5 42.5 41.5
Sweden
Wales
3 2 3 2.5 3.5 3.5 2.5 1 0.5 1.5 1 1.5 2.5 2.5 2.5 3 1.5 2.5 1 2.5 4 4.5 4.5 4.5 29.5 31.5
Wales
TACTICS
average
3.5 3.5 3.5 3 4.5 4 3 3.5 2.5 2.5 2 2 3 3 2 2.5 2 2.5 2.5 2.5 3 3.5 4 4 35 37.5
TACTICS
average
= 49-60 stars – excellent performance,
= 37-48.5 stars – good performance,
= 25-36.5 stars – fair performance,
Changes in scores 2009 to 2012
11
Pedestrian
safety
Passenger
safety
Moped/motor
scooter
safety
Cycling safety
Water safety/
drowning
prevention
Fall
prevention
Poisoning
prevention
Burn/scald
prevention
Choking/
strangulation
prevention
Child safety
leadership
Child safety
infrastructure
Child safety
capacity
Overall score
2009
2012
2009
2012
2009
2012
2009
2012
2009
2012
2009
2012
2009
2012
2009
2012
2009
2012
2009
2012
2009
2012
2009
2012
2009
2012
Austria
5 5 4 3.5 4.5 4.5 4 5 3 2.5 3 2 3 3 2.5 2.5 2.5 2.5 2 1.5 3 3 4 4 40.5 39
Austria
Belgium
4 3.5 3.5 3 3 3.5 1 2.5 2.5 2 2 2 4 3 3 2.5 2.5 2.5 1.5 0.5 1 0.5 1.5 2 29.5 27.5
Belgium
Czech
Republic
4 5 3 2.5 5 5 4.5 5 3.5 4 2.5 2.5 3 3 2.5 2.5 2 2.5 4.5 5 3.5 4.5 4 5 42 46.5
Czech
Republic
England
4 3.5 3.5 3.5 4 3.5 4 1 1.5 1.5 3 2.5 2.5 3.5 2.5 3 2.5 3 4 3 3.5 3 4.5 5 39.5 36
England
Finland
4 4.5 3.5 4 5 5 4.5 4.5 2 2.5 3 3 3 3.5 2.5 3.5 2.5 3 1.5 2.5 3 4 4 4 38.5 44
Finland
France
4 3.5 3.5 3 5 4.5 4 2.5 3.5 3.5 2.5 1.5 3 2 3 2.5 3 2 2.5 1.5 3 3 3 2.5 40 32
France
Germany
4 3.5 3.5 3.5 3.5 3.5 4 3.5 1 1 2 3 3 4 2.5 2.5 3 4.5 4.5 4 3 3 5 4.5 39 40.5
Germany
Greece
4 0.5 3.5 0 4 2.5 0 0 2 1 1 0 2 1 0.5 0.5 1.5 0.5 1 2 3.5 2.5 4 4 27 14.5
Greece
Hungary
4 4.5 3.5 2.5 4.5 4.5 3 3 1.5 2 1.5 2 3.5 3 1.5 1.5 2 2 2 3 4.5 4.5 5 5 36.5 37.5
Hungary
Iceland
4 4 4 4.5 4.5 5 4.5 4.5 4 3.5 4 3.5 4.5 4.5 4.5 3.5 3 2.5 2.5 3 4 3 5 3 48.5 44.5
Iceland
Ireland
4 4 2.5 4 4.5 5 2 3.5 2.5 3 2 2 1 3 2 3.5 2.5 2.5 1 2.5 3 3.5 4 4 31 40.5
Ireland
Israel
2 3.5 3 3 4 4.5 3 4.5 3 4 1.5 1 2 3 1.5 2 1.5 1 2.5 3.5 4 4 3.5 4 31.5 38
Israel
Italy
1.5 1.5 2 3 4 4.5 0 2.5 3 3.5 2 3 3.5 4.5 1 3 2 2.5 4 2.5 3 4 4 4 30 38
Italy
Latvia
3.5 3.5 4.5 4.5 4 5 3 5 1.5 2.5 1.5 2 2 3 2 3 2.5 3 2.5 2.5 4 3.5 3 5 34 42.5
Latvia
Lithuania
2.5 3.5 3.5 3 4.5 4.5 4 3.5 2 2 1.5 2 2.5 2 2 3 3 3 1.5 1.5 3 3 2.5 3 32.5 34
Lithuania
Luxembourg
4 4 3 3 4 3.5 2.5 2.5 2 2.5 1 1 0.5 1 1 2 2 2 0.5 1 1 2 2.5 2.5 24 27
Luxembourg
Malta
3.5 4 3 3 4.5 4.5 4.5 4.5 2 2.5 1 2 2 3 2 3 1.5 2.5 1 1.5 2.5 2.5 4 4 31.5 37
Malta
Netherlands
3.5 4 3.5 3.5 5 4.5 4 3.5 2 2.5 3.5 4.5 4.5 4.5 3 3.5 2.5 2.5 4.5 4.5 4.5 5 5 5 45.5 47.5
Netherlands
Portugal
1.5 1.5 3.5 3 3.5 3.5 1 1 2 2.5 1 1.5 3 3.5 1.5 2 2 2 2 3 2 2 4 4 27 29.5
Portugal
Scotland
3.5 4 3.5 3.5 4.5 4.5 2.5 3.5 1.5 1 2 2 3 2.5 2.5 3 2.5 3 1.5 4 3.5 3.5 5 4.5 35.5 39
Scotland
Slovenia
5 5 3.5 3.5 4.5 5 5 5 3.5 4 2.5 2.5 2.5 2.5 1.5 2 2 2.5 3 4 4 4.5 3.5 3 40.5 43.5
Slovenia
Spain
1.5 2.5 3.5 3.5 5 5 2 4.5 2 3 0.5 1.5 4.5 3.5 2 2.5 1.5 2.5 1.5 3.5 2 3.5 3 5 29 40.5
Spain
Sweden
1 3 3.5 2 4.5 4.5 5 3.5 2 2 2.5 3 4.5 3.5 4 3.5 3 3 4 3.5 4 4.5 5 5 42.5 41.5
Sweden
Wales
3 2 3 2.5 3.5 3.5 2.5 1 0.5 1.5 1 1.5 2.5 2.5 2.5 3 1.5 2.5 1 2.5 4 4.5 4.5 4.5 29.5 31.5
Wales
TACTICS
average
3.5 3.5 3.5 3 4.5 4 3 3.5 2.5 2.5 2 2 3 3 2 2.5 2 2.5 2.5 2.5 3 3.5 4 4 35 37.5
TACTICS
average
In 2009 these 24 countries represented a ratio of good:fair:poor performance of 9:14:1 and in
2012 this has improved to 16:7:1, demonstrating an increase in adoption, implementation and / or
enforcement of evidence-based good practices.
The average overall safety performance score based on the enhanced set increased from 35 in
2009 to 37.5 in 2012. The average difference of 2.08 was not quite statistically signicant (p=0.082;
95% condence intervals -0.29, 4.46).
= 13-24.5 stars – poor performance,
= 0-12.5 stars – unacceptable performance
12
Pedestrian safety
Walking is encouraged as part of the battle against the obesity epidemic. Children are increasingly
encouraged where feasible to walk to and from school. At the same time, countries continue to
become more motorised, and the environment is becoming less friendly for pedestrians, particularly
child pedestrians.
Inequality in pedestrian deaths for children and adolescents shows over a 14 times greater risk in
the lowest performing country compared to that of the best performing country participating in the
report card assessment for whom data were available. Rates for males are higher than females for all
countries except for the Netherlands, Norway and Portugal. The highest rates were seen in Latvia,
Lithuania, and Estonia for males and Slovenia, Latvia and Poland for females
Latvia
Lithuania
Estonia
Poland
Slovenia
Slovakia
Croatia
Israel
Ireland
Romania
Czech Republic
Hungary
EU average*
Bulgaria
Portugal
United Kingdom
Denmark
Belgium
Spain
Germany
Finland
Austria
Italy
Norway
Netherlands
Sweden
France
0.23
0.27
0.19
0.26
0.37
0.44
0.62
0.73
0.70
0.87
0.70
0.86
0.58
0.78
1.07
1.13
1.10
1.12
1.26
1.30
1.70
1.72
1.44
1.79
2.31
2.75
3.48
0.10
0.17
0.27
0.27
0.31
0.29
0.22
0.23
0.32
0.20
0.57
0.43
0.77
0.58
0.54
0.59
0.65
0.75
0.63
0.74
0.55
0.79
1.26
1.05
0.93
0.76
1.25
Source: WHO European Detailed Mortality Database (EDMD); 3 year averages for 2008-2010 or 2007-2009 or most recent
three years of data; Cyprus, Iceland, Luxembourg and Malta excluded due to small numbers and resulting rate variability;
Greece is excluded as ICD-9 codes do not allow breakdown of road trafc injuries so EU average presented represents
remaining 26 countries of the EU.
Pedestrian related deaths for children and adolescents
(Europe age standardised rate per 100 000 0-19 years by sex)
females
males
13
Children are at increased risk of injury due to their small size, inability to judge distances and speeds,
and lack of experience with trafc rules. Pedestrian injury rates increase from the time children
begin to walk until their development advances enough that they can manage to safely manoeuvre
in trafc. However the highest rates are seen in adolescents, which likely relates to exposure and risk
taking behaviours.
INJURY AREA SCORES
Pedestrian safety
Pedestrian safety
Comparison of pedestrian safety scores
The level of pedestrian safety for children and adolescents was assessed based on the adoption,
implementation and enforcement of evidence-based national level policies relating to pedestrian
safety that included:
• a national law requiring reduced speed in residential areas (e.g. areas near schools and
playgrounds)
• a national law assuming driver responsibility in a crash involving a child pedestrian (e.g., places the
burden of proof on the driver)
• a national policy providing specic supports for vehicle redesign to reduce risk of pedestrian injur
y
• a national ministry/ government department with mandated responsibility for child and
adolescent pedestrian safety
• a government approved national injury prevention strategy with specic targets and timelines
related to child and adolescent pedestrian safety
• a national media campaign at least once in past ve years targeting child and adolescent
pedestrian safety.
Countries were assessed based on the above good practice measures and given a score out of a
possible 5 stars.
European age standardised rate /100 000
0.0
0.5
1.0
1.5
2.0
15-19 years10-14 years5-9 years1-4 years< 1 year
EU average rate of pedestrian related deaths for children and
adolescents by age and sex
Source: WHO European Detailed Mortality Database (EDMD), EU average based on 2008-2010, 2007-2009 or most recent
three years of data for all EU countries except Greece as ICD-9 codes do not allow breakdown of road trafc injuries.
females
males
14
Key ndings
Currently many of the recommended evidence-based national level policies in pedestrian safety
are adopted, implemented or enforced in the majority of countries assessed. However scores
ranged from 1.5 to 5 stars with an average score of 3.5 out of 5 stars.
Pedestrian safety scores did not correspond to pedestrian deaths for all countries. For example,
Sweden who had one of the lower pedestrian safety scores also had one of the lowest death
rates. However Sweden has invested heavily in local infrastructure in the last 25 plus years
and this is not captured in the policy measures assessed. It is therefore reasonable to assume
that the lack of correspondence between pedestrian death rates and safety scores may reect
in part that only national level policies were assessed and that there can be differing levels
of implementation and enforcement of adopted policy measures between the countries. In
addition, it is likely that there are differing levels of exposure for child pedestrians between
countries that would also account for differences in death rates.
All countries but three, Croatia, Portugal and Sweden, report a national law requiring reduced
speed in residential areas, although in Sweden municipal level laws do exist. In addition, Greece,
Israel, the Netherlands and Wales report their national laws are only partly implemented or
enforced.
Thirteen countries (Austria, Belgium, Croatia, Denmark, Finland, France, Germany, Hungary, the
Netherlands, Poland, Slovakia, Slovenia and Sweden) report a national law that assumes driver
responsibility in a crash involving a child pedestrian, although most laws are not specic to
children and the law in Poland is only party implemented or enforced.
For the countries where a historical comparison in sub-area scores was possible between 2007
and 2012, improved scores reected increased adoption of national laws requiring reduced
speeds in residential areas and addressing liability in the event of a child pedestrian incident and
the introduction of national media campaigns targeting child pedestrian safety.
Pedestrian safety
5
4 or 4.5
3 or 3.5
2 or 2.5
1 or 1.5
less than 1
non-participants
Score out of 5 stars
Netherlands
Belgium
England
Scotland
Northern
Ireland
Norway
Iceland
Cyprus
Denmark
Sweden
Poland
Czech Rep
Austria
Estonia
Malta
Italy
Greece
Spain
Portugal
Hungary
Germany
France
Israel
Finland
Wales
Ireland
Latvia
Lithuania
Slovenia
Bulgaria
Croatia
Slovakia
Romania
Luxembourg
Pedestrian safety
in Europe
15
INJURY AREA SCORES
Passenger/driver safety
Children and adolescents spend an increasing amount of time in motor vehicles as family car
ownership in Europe has increased. In some countries and/or regions children are more likely to be
driven to school than to walk, cycle or take public transport. Fatal injuries occur in all age groups,
but are highest in males aged 15-19 years, likely reecting increased risk in novice drivers due to
inexperience or increased risk due to driving with a novice driver.
Inequality in motor vehicle passenger or driver deaths for children and adolescents shows over 10
times greater risk in the lowest performing country compared to that of the best performing country
participating in the report card assessment for whom data were available. The highest rates occur in
Lithuania, Croatia and Slovenia for males and Lithuania, Bulgaria and Poland for females.
Passenger/driver safety
Source: WHO European Detailed Mortality Database (EDMD); 3 year averages for 2008-2010 or 2007-2009 or most recent
three years of data; Cyprus, Iceland, Luxembourg and Malta excluded due to small numbers and resulting rate variability;
Greece is excluded as ICD-9 codes do not allow breakdown of road trafc injuries so EU average presented represents
remaining 26 countries of the EU.
Motor vehicle passenger or driver deaths for
children and adolescents
(Europe age standardised rate per 100,000 population 0-19 years by sex)
males
females
Lithuania
Croatia
Poland
Latvia
Slovenia
Finland
Estonia
Denmark
Bulgaria
Hungary
Spain
EU*
Ireland
Norway
United Kingdom
Czech Republic
Israel
Belgium
Austria
Germany
Sweden
Slovakia
Netherlands
Italy
Romania
France
Portugal
0.98
1.30
1.70
1.82
2.03
2.06
2.20
2.94
2.64
3.04
2.90
3.00
3.59
3.23
3.40
3.69
3.67
3.12
4.39
4.33
4.72
4.89
4.71
4.75
6.26
8.02
0.03
0.14
0.20
0.57
0.64
0.61
0.75
0.82
1.01
0.63
1.20
0.81
1.15
1.08
0.90
1.44
1.43
1.31
1.50
2.34
1.47
1.94
1.89
2.01
2.30
2.32
1.90
4.34
males
females
females
males
16
Comparison of passenger/driver safety scores
The level of passenger safety for children and adolescents was assessed based on adoption,
implementation and enforcement of evidence-based national level policies relating to passenger/
driver safety that included:
• a national law requiring use of appropriate child and adolescent passenger restraint
• a national law requiring children to remain seated rear facing in car seats until age 4 years
• a national law requiring children to remain seated in the back seat until age 13 years
• a national policy aimed at increasing access to child passenger restraint systems (CPRS) by
disadvantaged families (new policy measure in 2012)
• a national law requiring graduated licensing for new drivers
• a national law banning children from riding/driving farm tractors
• a national law banning children from riding/driving all terrain vehicles (ATVs, 3- or 4-wheelers)
• a national ministry/ government department with mandated responsibility for child and
adolescent passenger safety
• a government approved national strategy with specic targets and timelines related to child and
adolescent passenger safety
• a national programme of child home visits that includes education on child passenger safety
• a national media campaign at least once in past ve years targeting passenger safety.
Countries were assessed based on the above good practice measures and given a score out of a
possible 5 stars.
Key ndings
Currently many of the recommended evidence-based national level policies in passenger safety
are adopted, implemented or enforced in the majority of countries assessed and scores ranged
from 0 to 4.5 stars. The average score across the participating countries was 3 out of 5 stars.
Interestingly, passenger safety policy scores do not correspond to motor vehicle related deaths.
For example, Latvia has a high policy score but ranks towards the bottom in terms of
passenger/driver related injury deaths
. This likely reects different levels of exposure to risk and
preventive interventions, and implementation and enforcement of existing laws between the
countries.
Passenger/driver safety
European age standardised rate /100 000
0
2
4
6
8
10
12
15-19 years10-14 years5-9 years1-4 years< 1 year
EU average rate of motor vehicle passenger/driver deaths deaths for
children and adolescents by age and sex
Source: WHO European Detailed Mortality Database (EDMD), EU average based on 2008-2010, 2007-2009 or most recent
three years of data for all EU countries except Greece as ICD-9 codes do not allow breakdown of road trafc injuries.
females
males
17
Passenger/driver safety
5
4 or 4.5
3 or 3.5
2 or 2.5
1 or 1.5
less than 1
non-participants
Score out of 5 stars
Netherlands
Belgium
England
Scotland
Northern
Ireland
Norway
Iceland
Cyprus
Denmark
Sweden
Poland
Czech Rep
Austria
Estonia
Malta
Italy
Greece
Spain
Portugal
Hungary
Germany
France
Israel
Finland
Wales
Ireland
Latvia
Lithuania
Slovenia
Bulgaria
Croatia
Slovakia
Romania
Luxembourg
Passenger safety
in Europe
All countries reported legislation requiring use of appropriate child passenger restraints although
Greece, Hungary and Israel indicate increased enforcement was needed.
Although several countries have laws that require children to remain seated rear facing until older
than a year, no country reported a law requiring children to remain seated rear facing until age 4
years; the age that research suggests would keep them safest. Of note, although there is no law,
the norm in Sweden is to keep children seated rear facing until age 4 years and the country has
reduced their child passenger death rate in very young children to almost zero.
No country requires children to stay seated in the back seat of a motor vehicle to age 13 years.
Twelve countries (Bulgaria, Czech Republic, France, Hungary, Iceland, Ireland, Latvia, Poland,
Portugal, Romania, Slovakia and Spain) reported a law requiring children to remain seated in the
back seat of the motor vehicle until age 12 and / or 150 cm in height. However, in most countries
exceptions are made if the child is considered properly restrained in the front seat, and several
countries indicated that this law is not well enforced.
Twelve countries reported a policy designed to increase access to child passenger restraints by
disadvantaged families (Belgium, Czech Republic, England, Finland, Iceland, Ireland, Israel, Malta,
Portugal, Scotland, Slovenia and Wales), with most favouring a reduced tax on the restraints.
Several countries that had other subsidy-type programmes indicated that the funds were not
easily obtained, and so questioned whether the policies really increase access.
While many countries have phased licensing policy for new drivers, only 16 have multi-stage
programmes with graduated privileges that allow new drivers on-road experience under
conditions of reduced risk such as: zero tolerance for alcohol, no driving at night, limiting
passengers, speed, and so on. However, several countries are in progress of reviewing current laws.
All countries except Greece have a law banning children from riding/driving farm tractors, but age
limits vary and in some countries it only applies to driving on ofcial roads.
All countries except Bulgaria and Greece have laws banning children from riding/driving all terrain
vehicles (ATVs), although several indicated the law is only partially implemented or enforced and
only a few have laws that govern off-road riding.
For the countries where a historical comparison in sub-area scores was possible, improved scores
reected increased enforcement of existing passenger restraints laws and the introduction of
national media campaigns targeting child passenger safety.
18
Mopeds and motor scooter use by adolescents is very common in southern Europe and is increasing
across the EU as the density of road trafc increases, and mopeds are seen as an economic alternative
to a car. In several countries mopeds are the major means of transportation to school, work and social
events for adolescents.
Inequality in deaths due to motorised two-wheelers for children and adolescents shows a 36 times
greater risk for moped or motor scooter injury in the lowest performing country compared to that of
the best performing country participating in the report card assessment for whom data are available.
While the highest rates are found in Croatia, Lithuania and Spain for males and Belgium, Finland and
Spain for females, males are killed in accidents on motorised two-wheelers in much greater numbers
than females (nearly 8x the risk using the EU average). Deaths due to motorised two-wheelers are for
the most part an issue for males aged 15-19 years.
Moped/motor scooter safety
Source: WHO European Detailed Mortality Database (EDMD); 3 year averages for 2008-2010 or 2007-2009 or most recent
three years of data; Cyprus, Iceland, Luxembourg and Malta excluded due to small numbers and resulting rate variability;
Greece is excluded as ICD-9 codes do not allow breakdown of road trafc injuries so EU average presented represents the
remaining 26 countries of the EU
Deaths due to motorised two-wheelers for
children and adolescents
(Europe age standardised rate per 100 000 population 0-19 years by sex)
Croatia
Lithuania
Spain
Finland
Denmark
Slovenia
Austria
Belgium
Italy
EU*
Norway
Netherlands
Poland
France
United Kingdom
Latvia
Germany
Hungary
Sweden
Czech Republic
Bulgaria
Slovakia
Estonia
Israel
Romania
Ireland
Portugal
0.11
0.11
0.19
0.27
0.32
0.32
0.37
0.49
0.50
0.73
0.55
0.65
0.65
0.63
0.72
0.61
0.79
0.85
0.83
0.69
0.91
1.22
1.15
1.39
1.58
1.71
2.15
0.03
0.06
0.02
0.00
0.00
0.04
0.00
0.03
0.10
0.08
0.09
0.00
0.03
0.07
0.07
0.21
0.05
0.11
0.20
0.40
0.23
0.00
0.21
0.35
0.24
0.13
0.00
females
males
19
Moped/motor scooter safety
INJURY AREA SCORES
Moped/motor scooter safety
Comparison of moped/motor scooter scores
The level of moped/motor scooter safety for children and adolescents was assessed based on a
country’s adoption, implementation and enforcement of evidence-based national level policies
relating to moped/motor scooter safety including:
• a national law limiting legal age to drive a moped/motor scooter (small engine motorcycle)
• a national law requiring a minimum qualication for riding a moped/motor scooter (e.g., formal
exam prior to receiving riding permit)
• a national law limiting age or number of child and adolescent passengers on mopeds/motor
scooters
• a national law limiting speeds for mopeds/motor scooters
• a national law requiring compulsory use of a helmet by moped/motor scooter riders and
passengers
• a national law addressing drinking and driving of licensed vehicles by young drivers (e.g., specied
allowable blood alcohol level when driving a scooter) (new policy measure in 2012)
• a national ministry/ government department with mandated responsibility for child and
adolescent moped or motor scooter safety
• a government approved national injury prevention strategy with specic targets and timelines
related to child and adolescent moped or motor scooter safety
• a national media campaign at least once in past ve years targeting child and adolescent moped
or motor scooter safety.
Countries were assessed based on the above good practice measures and given a score out of a
possible 5 stars.
European age standardised rate /100 000
0
0.5
1.0
1.5
2.0
2.5
3.0
3.5
15-19 years10-14 years5-9 years1-4 years< 1 year
EU average rate of deaths due to motorised two-wheelers
for children and adolescents by age and sex
Source: WHO European Detailed Mortality Database (EDMD), EU average based on 2008-2010, 2007-2009 or most recent
three years of data for all EU countries except Greece as ICD-9 codes do not allow breakdown of road trafc injuries.
females
males
20
Key ndings
Road safety related policies related to moped/motor scooters were the most likely to have
been adopted and implemented compared to all other injury areas and while the ranges in
scores was 3 to 5 stars, the average score across the 31 countries was 4.5 out of 5 stars with
10 countries reporting receiving 5 out of 5 stars. It is likely that more countries have adopted
these laws as they are for the most part specied under EU Directives, whereas for other areas
(e.g., passenger/driver safety), the measures investigated are not.
Moped/motor scooter safety scores do not correspond to motorcycle related deaths for all
countries. For example, Lithuania with the highest death rate also has a high safety score. This
lack of correspondence between mortality rate and score likely reects that the category used
to calculate the mortality rates includes more than just moped/motor scooter-related incidents.
Current coding of death data in some countries does not allow for a breakdown to examine
moped/motor scooter related injuries separately, which makes European level comparisons
difcult. In addition levels of exposure to risk both in terms of moped ownership and use and
driving conditions and implementation and enforcement of policy measures vary between the
countries.
All countries had a law limiting the legal age to drive a moped/motor scooter and all required
use of a helmet, although the legal age limit was reported as not well enforced in Poland.
All countries require minimum qualications, although in Bulgaria this was reported as only
partly enforced, and all had specic speed limits, although Greece, Israel and Portugal reported
that the speed limits are not well enforced.
All countries but the Netherlands reported a law limiting the age or number of child
passengers on mopeds/motor scooters, but Germany, Greece, Poland and Portugal reported
that the law was not fully enforced.
For the countries where a historical comparison in sub-area scores was possible, improved
scores reected increased enforcement of existing laws and the introduction of national media
campaigns addressing moped/motor scooter safety.
Moped/motor scooter safety
5
4 or 4.5
3 or 3.5
2 or 2.5
1 or 1.5
less than 1
non-participants
Score out of 5 stars
Netherlands
Belgium
England
Scotland
Northern
Ireland
Norway
Iceland
Cyprus
Denmark
Sweden
Poland
Czech Rep
Austria
Estonia
Malta
Italy
Greece
Spain
Portugal
Hungary
Germany
France
Israel
Finland
Wales
Ireland
Latvia
Lithuania
Slovenia
Bulgaria
Croatia
Slovakia
Romania
Luxembourg
Moped/motor
scooter safety
in Europe
21
As with walking, cycling is encouraged to promote physical activity and to battle the obesity
epidemic. Children are being encouraged to use non-motorised transportation more often.
Unfortunately, few countries have invested in infrastructure (such as separate bicycle lanes) to
make the environment friendlier for cyclists, particularly in urban and suburban localities.
Inequality in cycling deaths for children and adolescents shows an over 40 times greater risk in
the lowest performing country compared to that of the best performing country participating in
the report card assessment for whom data were available. The highest rates were seen in Latvia,
Belgium and the Netherlands for males and Denmark, the Netherlands and Belgium for females.
Rates were higher for males than females in all countries except Austria and Denmark, the latter
being notable in that rates for females were over twice that for males.
Cycling safety
Netherlands
Belgium
Denmark
Latvia
Lithuania
Ireland
Poland
Slovenia
Bulgaria
Estonia
EU*
Czech Republic
Hungary
Slovakia
Finland
United Kingdom
Norway
Germany
Croatia
Italy
Austria
Romania
Sweden
Spain
France
Portugal
Israel
0.06
0.06
0.14
0.15
0.09
0.16
0.10
0.19
0.24
0.22
0.20
0.31
0.20
0.36
0.28
0.29
0.31
0.25
0.41
0.44
0.46
0.56
0.53
0.88
0.29
0.72
0.60
0.00
0.02
0.01
0.00
0.08
0.03
0.12
0.04
0.00
0.07
0.10
0.06
0.15
0.00
0.12
0.11
0.13
0.23
0.10
0.17
0.16
0.06
0.31
0.67
0.33
0.51
0.00
Source: WHO European Detailed Mortality Database (EDMD); 3 year averages for 2008-2010 or 2007-2009 or most recent
three years of data; Cyprus, Iceland, Luxembourg and Malta excluded due to small numbers and resulting rate variability;
Greece is excluded as ICD-9 codes do not allow breakdown of road trafc injuries so EU average presented represents
remaining 26 countries of the EU.
Deaths due to cycling for children and adolescents
(Europe age standardised rate per 100 000 population 0-19 years by sex)
INJURY AREA SCORES
Cycling safety
females
males
22
Comparison of cycling safety scores
The level of cycling safety for children and adolescents was assessed based on a country’s adoption,
implementation and enforcement of evidence-based national level policies relating to cycling safety
that included:
• a national law requiring use of bicycle helmet while cycling
• a national ministry/government department with mandated responsibility for child and youth
cycling safety
• a government approved national strategy with specic targets and timelines related to child and
adolescent cycling safety
• a national media campaign at least once in past ve years targeting child and adolescent cycling
safety.
Countries were assessed based on the above good practice measures and given a score out of a
possible 5 stars.
Cycling safety
European age standardised rate /100 000
0.0
0.1
0.2
0.3
0.4
0.5
0.6
0.7
0.8
15-19 years10-14 years5-9 years1-4 years< 1 year
EU average rate of deaths due to cycling for children and adolescents
by age and sex
Source: WHO European Detailed Mortality Database (EDMD), EU average based on 2008-2010, 2007-2009 or most recent
three years of data for all EU countries except Greece as ICD-9 codes do not allow breakdown of road trafc injuries.
The rates of death due to cycling are for the most part and issue for children over age 5 years, with
the highest rates found in children and adolescents over the age of 10 years, particularly males.
females
males
23
Cycling safety
in Europe
5
4 or 4.5
3 or 3.5
2 or 2.5
1 or 1.5
less than 1
non-participants
Score out of 5 stars
Netherlands
Belgium
England
Scotland
Northern
Ireland
Norway
Iceland
Cyprus
Denmark
Sweden
Poland
Czech Rep
Austria
Estonia
Malta
Italy
Greece
Spain
Portugal
Hungary
Germany
France
Israel
Finland
Wales
Ireland
Latvia
Lithuania
Slovenia
Bulgaria
Croatia
Slovakia
Romania
Luxembourg
Cycling safety
Key ndings
Many of the countries have road safety plans that include specic targets for cyclists and have
carried out extensive educational and media campaigns to prevent cycling-related accidents.
The scores ranged from 1 to 5 stars with an average score across the participating countries of
3.5 out of 5 stars.
We note that the policy assessment did not examine environmental modications such
as cycling lanes, as these strategies are most often implemented at the local level and the
assessment focused on policies at the national level.
Cycling safety scores did not correspond to cycling deaths for all countries. For example,
the Netherlands, which has a higher cycling safety score, also had high death rates. This
nding reects the different levels of exposure as cycling is more widely undertaken in the
Netherlands, but may also reect levels of implementation and enforcement of policy measures
between the countries. Another example is Latvia, which had the highest death rate for males
and 5 out of 5 stars for policy uptake, however their helmet law just came into effect in 2008
and the 3-year average presented includes data from 2007-2009.
Thirteen countries (Austria, Croatia, Czech Republic, Finland, Iceland, Israel, Latvia, Lithuania,
Malta, Slovakia, Slovenia, Spain and Sweden) reported a national law requiring use of a bicycle
helmet while cycling. The age up to which a helmet is required varies between countries from
12 years to all ages and ve of the countries (Finland, Iceland, Israel, Malta and Spain) indicate
that enforcement is an issue.
For the countries where a historical comparison in sub-area scores was possible, improved
scores reected introduction or enhanced implementation / enforcement of existing laws
requiring helmet use and the introduction of national media campaigns addressing cycling safety.