Báo cáo khoa học: Kinetics of electron transfer from NADH to the Escherichia coli nitric oxide reductase flavorubredoxin pdf
Bạn đang xem bản rút gọn của tài liệu. Xem và tải ngay bản đầy đủ của tài liệu tại đây (2.07 MB, 10 trang )
Kinetics of electron transfer from NADH to the Escherichia
coli nitric oxide reductase flavorubredoxin
Joa
˜
o B. Vicente
1
, Francesca M. Scandurra
2
, Joa
˜
o V. Rodrigues
1
, Maurizio Brunori
2
, Paolo Sarti
2
,
Miguel Teixeira
1
and Alessandro Giuffre
`
2
1 Instituto de Tecnologia Quı
´
mica e Biolo
´
gica, Universidade Nova de Lisboa, Oeiras, Portugal
2 Department of Biochemical Sciences, CNR Institute of Molecular Biology and Pathology and Istituto Pasteur – Fondazione Cenci
Bolognetti, University of Rome ‘La Sapienza’, Italy
In humans and other higher organisms, nitric oxide
(NO) is produced by the inducible isoform of NO-syn-
thase (iNOS) in several cell types, including macro-
phages, as part of the immune response to counteract
microbial infection [1,2]. NO production is enhanced
at the site of infection [2] leading to the formation of
highly reactive species, such as peroxynitrite (ONOO
–
[3]), all of which are cytotoxic towards the invading
microbes.
As a strategy to evade the host immune attack,
pathogenic microorganisms have evolved biochemical
pathways to resist to such a stress condition (generally
termed ‘nitrosative stress’), and particularly to degrade
NO. Many microorganisms express flavohemoglobin
[4,5], an enzyme that efficiently catalyzes the oxidation
of NO to nitrate (NO
3
–
) in the presence of O
2
, accord-
ing to the following reaction:
2NO þ 2O
2
þ NAD(P)H ! 2NO
À
3
þ NAD(P)
þ
þ H
þ
The flavodiiron proteins (FDPs, originally named
A-type flavoproteins [6]), are a different class of micro-
bial enzymes that were recently proposed to be involved
Keywords
flavodiiron proteins; microbial NO
detoxification; NADH:rubredoxin
oxidoreductase; nitrosative stress; time-
resolved spectroscopy
Correspondence
A. Giuffre
`
, Istituto di Biologia e Patologia
Molecolari del Consiglio Nazionale delle
Ricerche, c ⁄ o Dipartimento di Scienze
Biochimiche ‘A. Rossi Fanelli’, Universita
`
di
Roma ‘La Sapienza’, Piazzale Aldo Moro 5,
I-00185 Roma, Italia
Fax: +39 06 4440062
Tel: +39 06 49910944
E-mail:
(Received 22 September 2006, revised 20
November 2006, accepted 21 November
2006)
doi:10.1111/j.1742-4658.2006.05612.x
Escherichia coli flavorubredoxin (FlRd) belongs to the family of flavodiiron
proteins (FDPs), microbial enzymes that are expressed to scavenge nitric
oxide (NO) under anaerobic conditions. To degrade NO, FlRd has to be
reduced by NADH via the FAD-binding protein flavorubredoxin reduc-
tase, thus the kinetics of electron transfer along this pathway was investi-
gated by stopped-flow absorption spectroscopy. We found that NADH,
but not NADPH, quickly reduces the FlRd-reductase (k ¼ 5.5 ±
2.2 · 10
6
m
)1
Æs
)1
at 5 °C), with a limiting rate of 255 ± 17 s
)1
. The reduc-
tase in turn quickly reduces the rubredoxin (Rd) center of FlRd, as
assessed at 5 °C working with the native FlRd enzyme (k ¼
2.4 ± 0.1 · 10
6
m
)1
Æs
)1
) and with its isolated Rd-domain (k % 1 ·
10
7
m
)1
Æs
)1
); in both cases the reaction was found to be dependent on pH
and ionic strength. In FlRd the fast reduction of the Rd center occurs syn-
chronously with the formation of flavin mononucleotide semiquinone. Our
data provide evidence that (a) FlRd-reductase rapidly shuttles electrons
between NADH and FlRd, a prerequisite for NO reduction in this detoxi-
fication pathway, and (b) the electron accepting site in FlRd, the Rd
center, is in very fast redox equilibrium with the flavin mononucleotide.
Abbreviations
eT, electron transfer; FDP, flavodiiron protein; FlRd, flavorubredoxin; FlRd-reductase, NADH:flavorubredoxin oxidoreductase; FMN, flavin
mononucleotide; FMN
sq
, flavin mononucleotide semiquinone (one electron-reduced); Rd, rubredoxin; Rd-domain, rubredoxin domain of
flavorubredoxin; RR, Pseudomonas oleovorans rubredoxin reductase.
FEBS Journal 274 (2007) 677–686 ª 2006 The Authors Journal compilation ª 2006 FEBS 677
in NO detoxification, particularly under microaerobic
conditions [7]. In the absence of O
2
, FDPs are indeed
endowed with NO-reductase activity [8–10], being cap-
able of degrading NO most probably to nitrous oxide
(N
2
O):
2NO þ 2e
À
þ 2H
þ
! N
2
O þ H
2
O
Flavodiiron proteins are widespread among prokaryo-
tes [6,11]; based on genomic and functional analysis
they were more recently identified also in a restricted
number of anaerobic, pathogenic protozoa [11–14]. As
a distinctive feature, FDPs are characterized by two
structural domains: the N-terminal one, with a metallo-
b-lactamase like fold, harboring a nonheme diiron site,
and the flavodoxin-like domain with a flavin mononu-
cleotide (FMN) moiety [15]. The 3D structure is now
available for two FPDs, i.e. the enzyme isolated from
Desulfovibrio gigas (originally named rubredoxin:oxy-
gen oxidoreductase, ROO [16]), and the one from
Moorella thermoacetica [17]. In both cases, the two
redox centers (FMN and Fe-Fe) are at a relatively
long distance (% 35 A
˚
), but the enzyme displays a
homodimeric assembly in a head-to-tail configuration,
bringing the FMN of one monomer in close proximity
to the Fe-Fe site of the other monomer. It is therefore
likely, though not proven yet, that the dimer is the
functional unit of this enzyme, ensuring fast electron
equilibration between the redox cofactors.
The FDP expressed by Escherichia coli contains in
addition a rubredoxin-like domain with an iron-sulfur
center, fused at the C-terminus of the flavodiiron core;
thus this protein was named flavorubredoxin (FlRd)
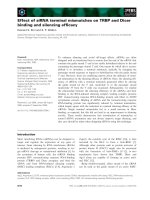
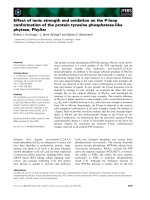
[6]. E. coli FlRd is the terminal component of an elec-
tron transport chain (Fig. 1) that involves NADH and
flavorubredoxin reductase, a FAD-binding protein of
the NAD(P)H:rubredoxin oxidoreductase family. The
genes coding for FlRd (norV) and its redox partner
FlRd-reductase (norW) form a single dicistronic tran-
scriptional unit [18].
In E. coli, the involvement of FlRd in the anaerobic
NO detoxification was originally proposed by Gardner
et al. [7] on the basis of molecular genetic evidence
and confirmed by measuring the NO consumption cat-
alyzed by the purified recombinant FlRd [8] and by
other bacterial FDPs [9,10]. The protective role of
FlRd towards nitrosative stress is further supported by
the finding that after exposing E. coli cells to NO
under anaerobic conditions, the transcriptional levels
of the norVW genes raise considerably and the FlRd
protein is promptly expressed [7,19]. It is not clear
whether the capability of degrading NO is a common
and distinctive feature among all the members of the
FDPs family. Every FDP characterized so far seems to
be capable of reacting with O
2
as well, though to dif-
ferent extents. Moreover, recently it was reported the
case of one FDP, the ROO from Desulfovibrio gigas,
which in vivo protects from nitrosative stress, but
in vitro as purified it consumes O
2
possibly more effi-
ciently than NO [20].
Although FDPs might be the targets for novel drugs
designed to counteract microbial infection, the informa-
tion on the mechanism whereby FDPs degrade NO is
as yet very poor. Probably, the active site is the Fe-Fe
binuclear center, because substitution of Zn for Fe
abolishes the activity [9]. Consistently, we have shown
previously that the Rd-domain of FlRd, a genetically
truncated version of the enzyme lacking the flavodiiron
domain, is unable to catalyze the anaerobic NO degra-
dation in the presence of excess reductants [8]. Also
based on the redox potentials determined for FlRd [21],
it is likely that electrons donated to FlRd enter the
enzyme at the [Fe-Cys
4
] center in the Rd-domain to
be subsequently transferred via FMN to the Fe-Fe site
where the reaction with NO is expected to occur; how-
ever, essentially no information is available as yet on
the kinetics of electron transfer to (as well as within)
this enzyme. Because the efficiency of NO detoxifica-
tion by FlRd (and FDPs in general) clearly depends
on the availability of electrons at the site of reaction
with NO, this prompted us to use E. coli FlRd as a
model to study the kinetics of electron transfer (eT)
along the NADH fi FlRd-reductase fi FlRd chain
Rd
NADH
NAD
+
FAD
e
NO
N
2
O
FMN
Fe-Fe
Flavodiiron Core
FlRd-reductase Flavorubredoxin
Fig. 1. Schematic representation of the
Escherichia coli electron transfer chain coup-
ling NADH oxidation to NO reduction.
Electron transfer to E. coli flavorubredoxin J. B. Vicente et al.
678 FEBS Journal 274 (2007) 677–686 ª 2006 The Authors Journal compilation ª 2006 FEBS
(Fig. 1), which is herein investigated by time-resolved
spectroscopy working on the purified recombinant
proteins.
Results
Reduction of flavorubredoxin reductase by NADH
The kinetics of the reduction of flavorubredoxin reduc-
tase (FlRd-reductase) by NADH was investigated by
time-resolved spectroscopy under anaerobic conditions
and at 5 °C. Upon mixing with NADH, oxidized
FlRd-reductase is fully reduced within 100 ms, as
inferred from the absorption bleaching detected in the
400–500 nm range and the absorption increase at
% 310 nm (Fig. 2A). Synchronously, a broad band
appears at k > 520 nm (thick arrow in Fig. 2A); as
previously proposed by Lee et al. [22] for the Pseudo-
monas oleovorans rubredoxin reductase (RR), we
assign the latter band to the formation of a charge-
transfer complex between NAD
+
and reduced FlRd-
reductase.
The reduction of FlRd-reductase was followed at
455 and 310 nm (thin arrows in Fig. 2A) at increasing
NADH concentrations. At [NADH] < 100 lm,pseudo-
first order conditions were not attained and the
reaction was thus modeled according to the scheme
A+Bfi C. By fitting the experimental time courses
to Eqn (1) (Experimental procedures), we estimated a
second-order rate constant k ¼ 5.5 ± 2.2 · 10
6
m
)1
Æs
)1
(inset to Fig. 2A). At [NADH] ‡ 100 lm, i.e., under
pseudo-first order conditions, within the experimental
error the reaction followed a single exponential time
course, proceeding at k¢ ¼ 255 ± 17 s
)1
(Fig. 2B). In
this [NADH] range, the observed rate constant was
independent of [NADH], suggesting a limiting rate for
eT within the NADH–FlRd-reductase complex. Under
identical experimental conditions, NADPH reduces
FlRd-reductase at an % 100-fold slower rate (not
shown).
300 400 500 600 700
0.00
0.05
0.10
0.15
Absorbance
ΔAbsorbance
log k
λ
(nm)
020406080100
0.00
0.02
0.04
0.06
Δ
bArosb
n
aec
Time (ms)
10 20 30 40 50
0.00
0.01
0.02
0.03
0.04
Time (ms)
0 50 100 150 200 250 300
0
100
200
300
400
500
k s('
1-
)
[NADH] (
μ
M
)
A
B
C
2
1
0.0 0.1 0.2 0.3 0.4 0.5 0.6
5.8
6.0
6.2
6.4
6.6
6.8
7.0
μ
(
M
1/2
)
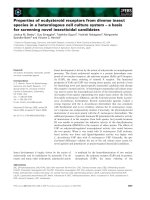
Fig. 2. Reduction of flavorubredoxin reductase by NADH. (A) Time-
resolved absorption spectra collected every 2.56 ms up to 100 ms
after mixing oxidized FlRd-reductase with NADH under anaerobic
conditions. Concentrations after mixing: [FlRd-reductase] ¼ 7.6 l
M;
[NADH] ¼ 16.5 l
M. Bold line: spectrum of fully oxidized FlRd-reduc-
tase (k
max
¼ 455 nm, thin arrow). The thick arrow outlines the
broad band appearing at k > 520 nm (see text for details).
T ¼ 5 °C. Buffer: 50 m
M Tris ⁄ HCl, 18% glycerol, pH 8.0. Inset:
Time courses of the reaction as measured at [NADH] ¼ 10, 30 and
50 l
M (concentrations after mixing), fitted according to Eqn (1) in
Experimental procedures. k ¼ 455 nm. (B) Time course of FlRd-
reductase reduction probed under pseudo-first order conditions, fol-
lowed at 455 nm (line 1) and 310 nm (line 2). Concentrations after
mixing: [NADH] ¼ 100 l
M; [FlRd-reductase] ¼ 7.6 lM.T¼ 5 °C.
Buffer: 50 m
M Tris ⁄ HCl, 18% glycerol, pH 8.0. Inset: Observed rate
constants measured at three different concentrations of NADH
‡ 100 l
M. (C) Ionic strength dependence of the second order rate
constant of FlRd-reductase reduction by NADH. Error bar indicates
the maximal error observed in this data set. Data were modeled
according to the Broensted–Bjerrum equation yielding Z
A
Z
B
¼ )1.3
(see Results and Discussion). T ¼ 5 °C. In these experiments FlRd-
reductase was desalted by gel filtration and ionic strength adjusted
by addition of KCl to the buffer (5 m
M Tris ⁄ HCl, 18% glycerol,
pH 8.0).
J. B. Vicente et al. Electron transfer to E. coli flavorubredoxin
FEBS Journal 274 (2007) 677–686 ª 2006 The Authors Journal compilation ª 2006 FEBS 679
The rate of FlRd-reductase reduction by NADH
decreased constantly with increasing ionic strength
(Fig. 2C). Data were analyzed according to the Broen-
sted–Bjerrum equation, whereby log k is expected to
be linearly dependent on the square root of the ionic
strength with a slope equal to 2AZ
A
Z
B
(A % 0.49 at
5 °C and Z
A
and Z
B
are the charges involved). From
the data in Fig. 2C we estimated Z
A
Z
B
% )1.3, which
is consistent with a slight effect of ionic strength on
this reaction. Finally, the reduction of FlRd-reductase
by NADH was found to be essentially independent of
pH in the range 5.0–8.0 (not shown).
Reduction of the rubredoxin domain of FlRd
by flavorubredoxin reductase
The isolated, genetically truncated rubredoxin domain
(Rd-domain) of FlRd is characterized in the oxidized
state by a typical absorption spectrum (Fig. 3A) that is
bleached upon reduction (not shown). The kinetics of
the anaerobic reduction of Rd-domain by FlRd-reduc-
tase (prereduced by a large excess of NADH) was
investigated by stopped-flow spectroscopy.
As monitored at 484 nm (arrow in Fig. 3A), the
Rd-domain is rapidly (< 1 s) reduced by FlRd-reduc-
tase in a concentration-dependent manner, following a
single exponential time course (Fig. 3B). This is consis-
tent with the fact that FlRd-reductase is kept fully
reduced during the whole time course by the excess
NADH. After mixing the oxidized Rd-domain with
NADH only, i.e., in the absence of FlRd-reductase, no
absorbance changes are observed even over several sec-
onds (not shown), thus proving that NADH is unable
to directly reduce the Rd-domain. When FlRd-reduc-
tase is present to shuttle electrons, the observed rate
constant for the reduction of the Rd-domain shows a
hyperbolic dependence on the FlRd-reductase concen-
tration (inset to Fig. 3B). Data were modeled accord-
ing to Scheme 1, whereby complex formation between
oxidized Rd-domain and reduced FlRd-reductase (k
1
,
k
)1
) is associated with intracomplex electron transfer
(k
2
). This is followed by fast dissociation of the part-
ners (k
3
? k
2
) and re-reduction of oxidized FlRd-
reductase by NADH at 255 s
)1
, as independently
determined (inset to Fig. 2B). As an over-simplifica-
tion, in this model intramolecular eT is assumed to be
an irreversible process, based on the information that
reduction of the Rd-domain by FlRd-reductase is
largely favored thermodynamically, according to the
redox potentials determined by Vicente et al. [21].
As shown in the inset to Fig. 3B, experimental
rates (closed symbols) are suitably fitted by kin-
etic simulations (open symbols), by assuming
k
1
¼ 1.3 · 10
7
m
)1
Æs
)1
, k
)1
£ 13 s
)1
, k
2
¼ 300 s
)1
and
k
3
‡ 5000 s
)1
in Scheme 1.
Reduction of FlRd by flavorubredoxin reductase
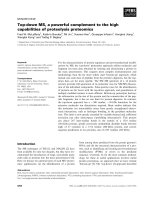
Spectral analysis of FlRd is complex due to the partial
overlap of the optical contribution of its redox cofac-
tors. Figure 4 shows the absorption spectrum of FlRd
in the oxidized state (spectrum A) and after reduction
by an excess of NADH in the presence of catalytic
amounts of FlRd-reductase (spectrum B). In the visible
region, the spectrum of oxidized FlRd is characterized
by a broad band centered at 474 nm and a shoulder at
0 200 400 600
0.00
0.02
0.04
0.06
Time (ms)
B
300 400 500 600 700
0.000
0.025
0.050
0.075
Absorbance
ΔAbsorbance
λ
(nm)
A
0 5 10 15 20 25
0
100
200
300
400
k (
'
s
-1
)
[FlRd-Reductase] (μM)
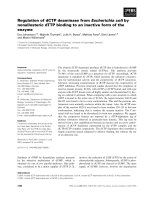
Fig. 3. Reduction of the rubredoxin domain of FlRd (Rd-domain) by
FlRd-reductase. Oxidized Rd-domain was anaerobically mixed with
FlRd-reductase at increasing concentrations, prereduced by excess
NADH. Concentrations after mixing: [Rd-domain] ¼ 7.7 l
M; [FlRd-
reductase] ¼ 0.38, 0.75, 1.5, 3.3, 6.5, 13 or 26 l
M; [NADH] ¼
375 l
M.T¼ 5 °C. Buffer: 50 mM Tris ⁄ HCl, 18% glycerol, pH 8.0.
(A) Absorption spectrum of 7.7 l
M oxidized Rd-domain (k
max
¼
484 nm, arrow). (B) Best fit to single exponential decays of the
time courses measured at 484 nm at increasing FlRd-reductase
concentrations. Inset: Observed rate constant as a function of
FlRd-reductase concentration. Experimental data (closed symbols)
were modeled (open symbols) according to Scheme 1, by
assuming k
1
¼ 1.3 · 10
7
M
)1
Æs
)1
, k
)1
£ 13 s
)1
, k
2
¼ 300 s
)1
and
k
3
‡ 5000 s
)1
.
Electron transfer to E. coli flavorubredoxin J. B. Vicente et al.
680 FEBS Journal 274 (2007) 677–686 ª 2006 The Authors Journal compilation ª 2006 FEBS
% 560 nm (arrow); this spectrum is contributed by
[Fe-Cys
4
] in the Rd-domain (spectrum C) and by
FMN with a possible contribution of the Fe-Fe center
(spectrum D). The spectrum of reduced FlRd (Fig. 4,
line b) displays a low intensity band centered at
% 500 nm, which cannot be directly assigned solely
from analyzing these spectra, as it could either result
from partially reduced FMN or from the Fe-Fe centre.
From these spectra, it is evident that at k > 550 nm
the absorption changes are almost exclusively domin-
ated by the Rd-domain, making this an adequate
wavelength range to monitor redox changes of the Rd
centre in the whole enzyme.
The kinetics of FlRd reduction was investigated by
anaerobically mixing the oxidized protein with FlRd-
reductase preincubated with excess NADH. Also in
the case of FlRd, no direct reduction by NADH was
observed over several seconds. The absolute absorption
spectra collected from 2.56 ms to 10 s after mixing are
depicted in Fig. 5A, together with the initial spectrum
of FlRd in the oxidized state (dotted line); absorption
at k < 400 nm is dominated by NADH in excess. The
difference spectra are shown in Fig. 5B. The ratio
Rd
ox
:Rd
red
at each time point was estimated at
560 nm (arrow in Fig. 5B), which allowed us to recon-
struct the optical contribution of [Fe-Cys
4
] (Fig. 5C)
to the difference spectra in Fig. 5B. By subtraction we
estimated the optical contribution of the FlRd flavodi-
iron domain, which is dominated by the FMN moiety
(Fig. 5D). Inspection of the latter data reveals the
formation of a red flavin semiquinone, characterized
by an absorbance increase at % 390 nm and a syn-
chronous absorbance decrease at % 450 nm [23].
Summing up, after mixing oxidized FlRd with
reduced FlRd-reductase in the presence of an excess of
NADH, two events can be deconvoluted: the reduction
of [Fe-Cys
4
] (monitored at 560 nm) and the formation
of semiquinone FMN (monitored at 390 nm after sub-
traction of the optical contribution of Fe-Cys
4
). As
shown in Fig. 6, both processes appear to be synchron-
ous, following a single exponential time course with a
rate constant linearly dependent on FlRd-reductase
concentration; the calculated apparent second order
rate constant is k ¼ 2.4 ± 0.1 · 10
6
m
)1
Æs
)1
. It should
be noted that at the highest concentrations of FlRd-
reductase (inset to Fig. 6B), the faster accumulation
of flavin mononucleotide semiquinone (FMN
sq
)is
followed by a slower partial decay presumably to
2e-reduced FMN.
The effect of ionic strength and pH on the
reduction of Rd-domain and FlRd
The effect of ionic strength and pH on the reduction
of either the Rd-domain or FlRd was also investigated,
upon mixing at 20 °C these proteins in the oxidized
state with FlRd-reductase prereduced by excess
NADH. Figure 7 shows that in the cases of FlRd (A)
and Rd-domain (B), the observed rates follow a bell-
shaped dependence on ionic strength, with a maximum
at around 40–50 mm.
As shown in Fig. 8, the kinetics of FlRd reduction
was found to be strongly pH dependent with an
apparent pK
a
% 7.3, the asymptotic value at acidic
pH being k¢ % 0.04 s
)1
. A very similar pH depend-
ence was also observed for the reduction of the iso-
lated Rd-domain.
NADH
Rd-D
(ox)
FlRd-Red
(red)
+
k
k
2
+
k
3
FlRd-Red
(red)
Rd-D
(ox)
FlRd-Red
(ox)
Rd-D
(red)
FlRd-Red
(ox)
Rd-D
(red)
k
-1
1
Scheme 1.
300 400 500 600 700
0.00
0.05
0.10
0.15
Absorbance
Wavelength (nm)
a
b
c
d
Fig. 4. Spectral features of flavorubredoxin (FlRd) and its individual
cofactors. Spectrum a: oxidized FlRd (arrow indicates the shoulder
at % 560 nm). Spectrum b: reduced FlRd (a few seconds after mix-
ing with 0.25 l
M FlRd-reductase in the presence of 375 lM NADH).
Spectrum c: oxidized Rd-domain. Spectrum d: optical contribution
of the oxidized flavodiiron (FMN ⁄ Fe-Fe) domain of FlRd estimated
by subtracting spectrum c from spectrum a. Protein concentration:
10 l
M.
J. B. Vicente et al. Electron transfer to E. coli flavorubredoxin
FEBS Journal 274 (2007) 677–686 ª 2006 The Authors Journal compilation ª 2006 FEBS 681
Discussion
Flavodiiron proteins (FDPs), expressed in many prok-
aryotes [6,11] and in a restricted group of pathogenic
amitochondriate protozoa [12–14], are responsible for
NO detoxification under anaerobic conditions [7,8],
thus helping microbes to survive in NO-enriched
microaerobic environments. Because FDPs catalyze the
reduction of NO at the level of their nonheme diiron
site, their catalytic efficiency clearly depends on the
availability of reducing equivalents at this bimetallic
site.
In E. coli NADH is the source of these electrons,
which are then transferred to FlRd via FlRd-reductase
([15], Fig. 1). The results herein presented show that
E. coli FlRd-reductase is highly specific for NADH,
that acts as a very efficient electron donor (k ¼
5.5 ± 2.2 · 10
6
m
)1
Æs
)1
,at5°C) contrary to NADPH.
This specificity can be possibly understood based
on the protein engineering studies on glutathione
reductase [24] and dihydrolipoamide dehydrogenase
[25] from E. coli, which are specific for NADPH and
NADH, respectively. Sequence analyses and homology
modeling of FlRd-reductase (not shown) suggest: (a)
the presence of the residues competent to form
H-bonds with the ribose 2¢-OH and 3¢-OH groups of
NADH, and (b) the absence of a nest of positively
charged residues to stabilize the extra phosphate group
in NADPH.
In the present study, we have observed several anal-
ogies between E. coli FlRd-reductase and the rubre-
doxin reductase (RR) from Pseudomonas oleovorans
300 400 500 600 700
0.00
0.05
0.10
0.15
sbAo nabrec
λ
(nm)
300 400 500 600 700
0.00
0.02
0.04
0.06
0.08
0.10
Δ
bAosabrnec
λ
(nm)
B
A
Rd
FMN
Fe-Fe
Rd
FMN
Fe-Fe
Rd
FMN
Fe-Fe
Rd
FMN
Fe-Fe
time
300 400 500 600 700
-0.04
-0.02
0.00
0.02
0.04
Δ r
os
bAbn
a
ec
λ (nm)
300 400 500 600 700
0.00
0.02
0.04
0.06
0.08
0.10
Δ
bAbroscnae
λ
(nm)
D
C
Rd
FMN
Fe-Fe
FMN
Fe-Fe
Fig. 5. Reduction of flavorubredoxin (FlRd) by FlRd-reductase. (A) Absolute spectra collected after mixing oxidized FlRd with FlRd-reductase
prereduced by excess NADH. Concentrations after mixing: [FlRd] ¼ 10 l
M; [FlRd-reductase] ¼ 0.25 lM; [NADH] ¼ 375 lM. Spectra acquired
in a logarithmic time mode, from 2.56 ms up to 10 s (arrow depicts the direction of the absorption changes with time). Buffer: 50 m
M
Tris ⁄ HCl, 18% glycerol, pH 8.0. T ¼ 5 °C. (B) Difference spectra obtained by subtracting the final spectrum in (A) (t ¼ 10 s) from the remain-
ders. Arrow depicts 560 nm as a suitable wavelength to monitor the redox changes of the [Fe-Cys
4
] centre in FlRd. (C) Optical contribution
of the Rd-domain to the difference spectra depicted in (B). These spectra were reconstructed by estimating the Rd
ox
:Rd
red
ratio at every
time point from the absorption changes detected at 560 nm along the reaction [arrow in (B)]. (D) Optical contribution of the flavodiiron
domain estimated by subtracting the contribution of the Rd-domain (C) from the difference spectra depicted in (B). Spectra reveal the forma-
tion of flavin red semiquinone, as indicated by the increase at 390 nm (arrow).
Electron transfer to E. coli flavorubredoxin J. B. Vicente et al.
682 FEBS Journal 274 (2007) 677–686 ª 2006 The Authors Journal compilation ª 2006 FEBS
[22]. The latter is a FAD-binding protein sharing a
significant amino acid sequence similarity with E. coli
FlRd-reductase (27% identity, 50% similarity); its phy-
siological role is to shuttle electrons between NADH
and rubredoxin, the electron donor of a membrane
bound diiron x-hydroxylase required for the hydroxy-
lation of alkanes [26]. Comparing E. coli FlRd-reduc-
tase and P. oleovorans RR, we notice that: (a) the
FAD moiety accepts the two electrons from NADH as
a single kinetic step with no evidence for flavin radical
accumulation; (b) at saturating NADH concentrations
(> 100 lm), flavin is reduced at comparable limiting
rates [255 ± 17 s
)1
in FlRd-reductase (inset Fig. 2B),
to be compared with 180–190 s
)1
measured for RR];
(c) upon reduction by NADH, a charge transfer com-
plex with NAD
+
is formed, identified by a broad
absorption band at k > 520 nm (Fig. 2A in the pre-
sent study to be compared with Fig. 4 in [22]).
Based on the structural and functional similarities
with P. oleovorans RR, it may be expected that the
physiological function of E. coli FlRd-reductase is to
shuttle electrons between NADH and the Rd center in
FlRd, as originally proposed by Gomes et al. [15].
Consistently, we observed that NADH is unable to
directly reduce [Fe-Cys
4
] in the Rd-domain, either iso-
lated or as part of FlRd, unless FlRd-reductase is pre-
sent to catalyze this eT process (Figs 3B and 6A). In
the latter case, the Rd center is promptly reduced by
FlRd-reductase and this reaction was found to be
highly dependent both on pH and ionic strength
(Figs 7 and 8). Namely, we found that the reaction (a)
speeds up at alkaline pH (apparent pKa % 7.3), a find-
ing that appears physiologically relevant as in the cyto-
sol of E. coli, where FlRd-reductase and FlRd are
found, pH is % 7.5 and (b) displays a bell-shaped
B
0.0 0.2 0.4 0.6 0.8 1.0
0.00
0.01
0.02
0.03
0.04
Δ sbAo ecnabr
Time (s)
A
560 nm
Rd
390 nm
FMN
sq
0.0 0.2 0.4 0.6 0.8 1.0
0.00
0.02
0.04
0.06
Δ ecnabrosbA
Time (s)
0
20
40
60
80
100
120
0 5 10 15 20 25 30
0
20
40
60
80
100
[FlRd-Reductase] (μM)
'k s(
1-
)
Fig. 6. Kinetics of electron transfer between FlRd-reductase and fla-
vorubredoxin. Concentrations after mixing: [FlRd] ¼ 10 l
M; [FlRd-
reductase] ¼ 0.25, 0.5, 1.5, 2.3, 3.4, 5, 11.5, 17.5 and 26 l
M;
[NADH] ¼ 375 l
M.T¼ 5 °C. Buffer: 50 mM Tris ⁄ HCl, 18% gly-
cerol, pH 8.0. Data collected after anaerobically mixing oxidized
FlRd with increasing concentrations of FlRd-reductase prereduced
by excess NADH. Observed rate constants obtained by fitting to
single exponential decays the absorption changes collected at
560 nm (A) and at 390 nm (B).
0 100 200 300 400
0
1
2
3
4
5
'k s(
1-
)
μ (mM)
0
1
2
3
4
5
'k s(
1-
)
A
B
Rd
FMN
Fe-Fe
Rd
FMN
Fe-Fe
Rd
Fig. 7. Effect of ionic strength. Ionic strength dependence of the
rate constants observed for the anaerobic reduction by FlRd-reduc-
tase of FlRd (A) or the isolated Rd-domain (B). Concentrations after
mixing: 8.5 l
M FlRd, 2 lM FlRd-reductase, 375 lM NADH (A)
or 10.5 l
M Rd-domain, 0.5 lM FlRd-reductase, 375 lM NADH (B).
T ¼ 20 °C. Rd-domain and FlRd were previously desalted and equil-
ibrated with 5 m
M Tris ⁄ HCl, 18% glycerol, pH 7.6, by gel permea-
tion chromatography. Ionic strength was then adjusted by addition
of KCl to the buffer. The dashed lines are merely shown to repre-
sent the observed bell-shaped behavior.
J. B. Vicente et al. Electron transfer to E. coli flavorubredoxin
FEBS Journal 274 (2007) 677–686 ª 2006 The Authors Journal compilation ª 2006 FEBS 683
dependence on ionic strength, a fairly common feature
for interprotein electron transfer [27], with maximum
rate at around 40–50 mm.
Under optimal eT conditions (pH ¼ 8.0 and
l % 40 mm), kinetic data could be modeled according
to Scheme 1 (Fig. 3B); we observe that FlRd-reductase
and the Rd domain form a tight complex rapidly
(k % 1 · 10
7
m
)1
Æs
)1
; K
d
£ 1 lm), followed by an intra-
complex eT (from FAD to [Fe-Cys
4
]) proceeding at a
limiting rate of % 300 s
)1
. With the whole FlRd, elec-
trons donated by FlRd-reductase enter the protein at
the Rd center (with an apparent k of 2.4 · 10
6
m
)1
Æs
)1
)
and clearly re-equilibrate with FMN, leading to forma-
tion of FMN
sq
(detected by spectral analysis detailed
in Fig. 5). Such a finding is consistent with the reduc-
tion potentials of FMN ⁄ FMN
sq
and [Fe
3+
) Cys
4
] ⁄
[Fe
2+
) Cys
4
] being very similar (E
0
¼ )40 mV and
)60 mV, respectively [21]). These two events were
observed to proceed synchronously even at the highest
FlRd-reductase concentration, thus strongly suggesting
that [Fe-Cys
4
] and FMN are in very fast redox equilib-
rium (Scheme 2).
It is interesting that also in the flavocytochrome
P450BM3 (from Bacillus megaterium), the flavin
semiquinone shuttles one electron at a time to the
heme active site, whereas the fully (two electron)
reduced flavin contributes to inactivation of the
enzyme [28].
The lack of a UV-visible spectral fingerprint for the
Fe-Fe site hampers the detection of this site’s prompt
reduction via FMN
sq
. However, we notice that if the
reduction of the Fe-Fe site was not occurring synchro-
nously with [Fe-Cys
4
] and FMN 1e-reduction, only
two electrons would quickly equilibrate within FlRd.
Because the redox potentials of both [Fe
3
± Cys
4
] ⁄
[Fe
2
± Cys
4
] and FMN ⁄ FMN
sq
are similar [21], in the
absence of other effects the observed apparent rate
constant for the reduction of [Fe-Cys
4
] and FMN
should be approximately two-fold smaller than that
measured with the isolated Rd-domain (accepting
only one electron). Taking this into account, it is
relevant that the second order rate constants for eT
from FlRd-reductase to isolated Rd-domain (% 1 ·
10
7
m
)1
Æs
)1
) or FlRd (2.4 · 10
6
m
)1
Æs
)1
) actually differ
by a factor significantly greater than two. This leads us
to hypothesize that electrons entering FlRd at the Rd
center quickly equilibrate also with the Fe-Fe site via
FMN
sq
.
In conclusion, we have thoroughly investigated the
eT kinetics to flavorubredoxin, the crucial enzyme in
the E. coli anaerobic NO-detoxification pathway. We
found that FlRd-reductase acts as an efficient electron
shuttle between NADH and the [Fe-Cys
4
] center of
FlRd, where electrons quickly equilibrate intramolecu-
larly with FMN
sq
and most probably Fe-Fe, to
become available for the reduction of NO to N
2
O.
Experimental procedures
Materials
NADH, glucose oxidase and catalase were purchased from
Sigma (St. Louis, MO). The concentration of NADH in
stock solutions was determined spectrophotometrically
using the extinction coefficient e
340nm
¼ 6.2 mm
)1
Æcm
)1
.
Unless otherwise specified, experiments were performed at
5 °Cin50mm Tris ⁄ HCl, 18% (v ⁄ v) glycerol, pH 8.0. The
low temperature was chosen in order to slow down the
reactions that were otherwise too fast to be time-resolved.
Glycerol was used to enhance the stability of purified FlRd
Rd
FMN
Fe-Fe
Rd
FMN
Fe-Fe
Rd
5.5 6.0 6.5 7.0 7.5 8.0
0
1
2
3
4
pH
'k
F(lRd)
s(
1-
)
0
5
10
15
'
k
R
(
-doD
a
mn
i
)
s(
1-
)
Fig. 8. Effect of pH. Rate constants obtained by measuring the
anaerobic reduction of FlRd (closed symbols) or Rd-domain (open
symbols) by FlRd-reductase, at different pH values. Concentrations
after mixing: 8.5 l
M FlRd or 10.5 lM Rd-domain, 2 lM FlRd-reduc-
tase, 375 l
M NADH. T ¼ 20 °C. Buffer: 5 mM Tris ⁄ HCl, 18% gly-
cerol, pH 7.6. FlRd and Rd-domain were previously desalted and
equilibrated in 5 m
M Tris ⁄ HCl, 18% glycerol, pH 7.6, by gel per-
meation chromatography, whereas NADH and FlRd-reductase were
diluted into concentrated buffers (100 m
M) at different pH values.
Ionic strength % 145 m
M after mixing.
Scheme 2.
Electron transfer to E. coli flavorubredoxin J. B. Vicente et al.
684 FEBS Journal 274 (2007) 677–686 ª 2006 The Authors Journal compilation ª 2006 FEBS
and FlRd-reductase in solution, an effect already documen-
ted for Pseudomonas oleovorans rubredoxin reductase (RR)
and rubredoxin [22,29]. Anaerobic conditions were achieved
by N
2
-equilibration of the buffers and by scavenging
residual contaminant oxygen using glucose oxidase (17
unitsÆmL
)1
), glucose (2 mm) and catalase (130 unitsÆmL
)1
).
Escherichia coli flavorubredoxin (FlRd), flavorubredoxin
reductase (FlRd-reductase) and a truncated version of FlRd
consisting of the only rubredoxin domain (Rd-domain)
were overexpressed in E. coli, purified as previously des-
cribed [8,15] and stored at )80 °C until use. The concentra-
tion of oxidized FlRd-reductase and Rd-domain was
determined spectrophotometrically using the extinction coeffi-
cients e
455nm
¼ 12 mm
)1
Æcm
)1
and e
484nm
¼ 7mm
)1
Æcm
)1
,
respectively. The protein concentration of FlRd was deter-
mined by the bicinchoninic acid method [30], iron and
FMN contents were quantitated as in [31] and [32], respect-
ively. As purified, FlRd contained the expected amount of
iron (% 3 Fe per monomer), but substoichiometric FMN
(0.5–0.6 instead of 1 FMN per monomer), pointing to par-
tial loss of flavin during the purification procedure or
incomplete incorporation of flavin during expression.
Absorption spectroscopy and data analysis
UV ⁄ visible static spectra were recorded by using a Shimadzu
(Tokyo, Japan) spectrophotometer (UV-1603). Stopped-flow
experiments were carried out with a thermostated instrument
(DX.17 MV, Applied Photophysics, Leatherhead, UK)
equipped with either a monochromator or a diode-array
(light path ¼ 1 cm). When the instrument was used in the
multiwavelength mode (diode-array), time-resolved absorp-
tion spectra were recorded with an acquisition time of
2.56 ms per spectrum and a wavelength resolution of 2.1 nm.
Typically, three independent traces were collected to be
averaged before analysis.
Kinetic data were analyzed by nonlinear least-squares
regression analysis using the software matlab (MathWorks,
South Natick, NA). The reaction of FlRd-reductase with
NADH, whenever it was not probed under pseudo-first
order conditions, was modeled according to a scheme of
the type A þ B !
k
C. The apparent second order rate con-
stant k was thus obtained by fitting the experimental time
courses to the equation:
ln
B
0
ðA
0
À xÞ
A
0
ðB
0
À xÞ
¼ ktðA
0
À B
0
Þð1Þ
where A
0
and B
0
are the initial concentrations of A and B
and x is the amount of A and B reacted at the time t. The
time courses of both Rd-domain and FlRd reduction by
FlRd-reductase were fitted to single exponential decays. In
the case of FlRd, observed rate constants were linearly
dependent on the concentration of the FlRd-reductase and
the apparent second-order rate constant was thus estimated
by linear regression analysis. The observed rate constants
for Rd-domain reduction showed a hyperbolic dependence
on the concentration of FlRd-reductase. In this case, the
apparent second-order rate constant was estimated by kin-
etic simulations performed using the software facsimile
(AEA Technology, Didcot, UK).
Acknowledgements
This work was partially supported by Ministero
dell’Istruzione, dell’Universita
`
e della Ricerca of Italy
(PRIN ‘Meccanismi molecolari e aspetti fisiopatologici
dei sistemi bioenergetici di membrana’ and FIRB
RBAU01F2BJ to P.S.), by Fundac¸ a
˜
o para a Cieˆ ncia
e Tecnologia of Portugal (project grant POCTI ⁄
2002 ⁄ BME ⁄ 44597 to M.T. and PhD grants
SFRH ⁄ BD ⁄ 9136 ⁄ 2002 to J.B.V. and SFRH ⁄ BD ⁄
14380 ⁄ 2003 to J.V.R.), and by Consiglio Nazionale
delle Ricerche of Italy and Gabinete de Relac¸ o
˜
es
Internacionais da Cieˆ ncia e do Ensino Superior of
Portugal (to A.G. and M.T.).
References
1 MacMicking J, Xie QW & Nathan C (1997) Nitric
oxide and macrophage function. Annu Rev Immunol 15,
323–350.
2 Bogdan C (2001) Nitric oxide and the immune response.
Nat Immunol 2, 907–916.
3 Beckman JS & Koppenol WH (1996) Nitric oxide,
superoxide, and peroxynitrite: the good, the bad, and
ugly. Am J Physiol 271, C1424–C1437.
4 Poole RK, Anjum MF, Membrillo-Hernandez J, Kim
SO, Hughes MN & Stewart V (1996) Nitric oxide,
nitrite, and Fnr regulation of hmp (flavohemoglobin)
gene expression in Escherichia coli K-12. J Bacteriol
178, 5487–5492.
5 Gardner PR, Gardner AM, Martin LA & Salzman AL
(1998) Nitric oxide dioxygenase: an enzymic function
for flavohemoglobin. Proc Natl Acad Sci USA 95,
10378–10383.
6 Wasserfallen A, Ragettli S, Jouanneau Y & Leisinger T
(1998) A family of flavoproteins in the domains Archaea
and Bacteria. Eur J Biochem 254, 325–332.
7 Gardner AM, Helmick RA & Gardner PR (2002) Fla-
vorubredoxin, an inducible catalyst for nitric oxide
reduction and detoxification in Escherichia coli. J Biol
Chem 277, 8172–8177.
8 Gomes CM, Giuffre A, Forte E, Vicente JB, Saraiva
LM, Brunori M & Teixeira M (2002) A novel type of
nitric-oxide reductase. Escherichia coli flavorubredoxin.
J Biol Chem 277 , 25273–25276.
9 Silaghi-Dumitrescu R, Coulter ED, Das A, Ljungdahl
LG, Jameson GN, Huynh BH & Kurtz DM Jr (2003)
A flavodiiron protein and high molecular weight
J. B. Vicente et al. Electron transfer to E. coli flavorubredoxin
FEBS Journal 274 (2007) 677–686 ª 2006 The Authors Journal compilation ª 2006 FEBS 685
rubredoxin from Moorella thermoacetica with nitric
oxide reductase activity. Biochemistry 42, 2806–2815.
10 Silaghi-Dumitrescu R, Ng KY, Viswanathan R & Kurtz
DM Jr (2005) A flavo-diiron protein from Desulfovibrio
vulgaris with oxidase and nitric oxide reductase activ-
ities. Evidence for an in vivo nitric oxide scavenging
function. Biochemistry 44, 3572–3579.
11 Saraiva LM, Vicente JB & Teixeira M (2004) The role
of the flavodiiron proteins in microbial nitric oxide
detoxification. Adv Microb Physiol 49, 77–129.
12 Andersson JO, Sjogren AM, Davis LA, Embley TM &
Roger AJ (2003) Phylogenetic analyses of diplomonad
genes reveal frequent lateral gene transfers affecting
eukaryotes. Curr Biol 13 , 94–104.
13 Sarti P, Fiori PL, Forte E, Rappelli P, Teixeira M,
Mastronicola D, Sanciu G, Giuffre A & Brunori M
(2004) Trichomonas vaginalis degrades nitric oxide
and expresses a flavorubredoxin-like protein: a
new pathogenic mechanism? Cell Mol Life Sci 61,
618–623.
14 Loftus B, Anderson I, Davies R, Alsmark UC, Samuel-
son J, Amedeo P, Roncaglia P, Berriman M, Hirt RP,
Mann BJ, et al. (2005) The genome of the protist para-
site Entamoeba histolytica. Nature 433, 865–868.
15 Gomes CM, Vicente JB, Wasserfallen A & Teixeira M
(2000) Spectroscopic studies and characterization of a
novel electron-transfer chain from Escherichia coli invol-
ving a flavorubredoxin and its flavoprotein reductase
partner. Biochemistry 39, 16230–16237.
16 Frazao C, Silva G, Gomes CM, Matias P, Coelho R,
Sieker L, Macedo S, Liu MY, Oliveira S, Teixeira M
et al. (2000) Structure of a dioxygen reduction
enzyme from Desulfovibrio gigas. Nat Struct Biol 7 ,
1041–1045.
17 Silaghi-Dumitrescu R, Kurtz DM Jr, Ljungdahl LG &
Lanzilotta WN (2005) X-ray crystal structures of Moor-
ella thermoacetica FprA. Novel diiron site structure and
mechanistic insights into a scavenging nitric oxide
reductase. Biochemistry 44, 6492–6501.
18 da Costa PN, Teixeira M & Saraiva LM (2003) Regula-
tion of the flavorubredoxin nitric oxide reductase gene
in Escherichia coli: nitrate repression, nitrite induction,
and possible post-transcription control. FEMS Micro-
biol Lett 218, 385–393.
19 Justino MC, Vicente JB, Teixeira M & Saraiva LM
(2005) New genes implicated in the protection of anae-
robically grown Escherichia coli against nitric oxide.
J Biol Chem 280 , 2636–2643.
20 Rodrigues R, Vicente JB, Felix R, Oliveira S, Teixeira
M & Rodrigues-Pousada C (2006) Desulfovibrio gigas
flavodiiron protein affords protection against nitrosative
stress in vivo. J Bacteriol 188, 2745–2751.
21 Vicente JB & Teixeira M (2005) Redox and spectroscopic
properties of the Escherichia coli nitric oxide-detoxifying
system involving flavorubredoxin and its NADH-oxidiz-
ing redox partner. J Biol Chem 280, 34599–34608.
22 Lee HJ, Basran J & Scrutton NS (1998) Electron trans-
fer from flavin to iron in the Pseudomonas oleovorans
rubredoxin reductase-rubredoxin electron transfer com-
plex. Biochemistry 37, 15513–15522.
23 Ghisla S & Edmondson DA (2001) Flavin Coenzymes.
In Encyclopedia of Life Sciences. Nature Publishing
Group. John Wiley & Sons, Chichester.
24 Mittl PR, Berry A, Scrutton NS, Perham RN & Schulz
GE (1994) Anatomy of an engineered NAD-binding
site. Protein Sci 3, 1504–1514.
25 Bocanegra JA, Scrutton NS & Perham RN (1993) Crea-
tion of an NADP-dependent pyruvate dehydrogenase
multienzyme complex by protein engineering. Biochemis-
try 32, 2737–2740.
26 McKenna EJ & Coon MJ (1970) Enzymatic omega-
oxidation. IV. Purification and properties of the omega-
hydroxylase of Pseudomonas oleovorans. J Biol Chem
245, 3882–3889.
27 McLendon G & Hake R (1992) Interprotein Electron
Transfer. Chem Rev 92, 481–490.
28 Warman AJ, Roitel O, Neeli R, Girvan HM, Seward
HE, Murray SA, McLean KJ, Joyce MG, Toogood H,
Holt RA, Leys D, Scrutton NS & Munro AW (2005)
Flavocytochrome P450 BM3: an update on structure
and mechanism of a biotechnologically important
enzyme. Biochem Soc Trans 33, 747–753.
29 Perry A, Tambyrajah W, Grossmann JG, Lian LY &
Scrutton NS (2004) Solution structure of the two-iron
rubredoxin of Pseudomonas oleovorans determined by
NMR spectroscopy and solution X–ray scattering and
interactions with rubredoxin reductase. Biochemistry 43,
3167–3182.
30 Smith PK, Krohn RI, Hermanson GT, Mallia AK,
Gartner FH, Provenzano MD, Fujimoto EK, Goeke
NM, Olson BJ & Klenk DC (1985) Measurement of pro-
tein using bicinchoninic acid. Anal Biochem 150, 76–85.
31 Fischer DS & Price DC (1964) A Simple Serum Iron
Method Using the New Sensitive Chromogen Tripyri-
dyl-S-Triazine. Clin Chem 10, 21–31.
32 Susin S, Abian J, Sanchez-Baeza F, Peleato ML, Abadia
A, Gelpi E & Abadia J (1993) Riboflavin 3¢- and 5¢ -sul-
fate, two novel flavins accumulating in the roots of
iron-deficient sugar beet (Beta vulgaris). J Biol Chem
268, 20958–20965.
Electron transfer to E. coli flavorubredoxin J. B. Vicente et al.
686 FEBS Journal 274 (2007) 677–686 ª 2006 The Authors Journal compilation ª 2006 FEBS