Báo cáo khoa học: Bridging the gap between in silico and cell-based analysis of the nuclear factor-jB signaling pathway by in vitro studies of IKK2 ppt
Bạn đang xem bản rút gọn của tài liệu. Xem và tải ngay bản đầy đủ của tài liệu tại đây (530.75 KB, 13 trang )
Bridging the gap between in silico and cell-based analysis
of the nuclear factor-jB signaling pathway by in vitro
studies of IKK2
Adaoha E. C. Ihekwaba
1,4
, Stephen J. Wilkinson
1
, Dominic Waithe
3
, David S. Broomhead
2
,
Peter Li
1
, Rachel L. Grimley
3
and Neil Benson
3
1 School of Chemistry, The University of Manchester, Faraday Building, UK
2 School of Mathematics, The University of Manchester, UK
3 Pfizer Global Research and Development, Sandwich, UK
4 VBI, Virginia Tech, Blacksburg, VA, USA
In silico analysis of complex cellular processes (whether
for data description, drug discovery, genetic engineer-
ing or scientific discovery) with its focus on elucidating
system mechanisms, has become critical for progress in
biology [1–5]. Detailed computational models can
reveal complex behavior [6] in signaling pathways [7–
9]. For example, under certain conditions, signaling
molecules can undergo periodic translocation between
different cellular compartments resulting in sustained
oscillations of their local concentrations [10–12]. This
has been demonstrated for the nuclear transcription
factor nuclear factor (NF-jB), whose nuclear concen-
tration has been shown to oscillate due to transloca-
tion to ⁄ from the cytoplasm.
For the oscillations to be observable in a cell popula-
tion rather than a single cell, they need to be largely
synchronous [13–15]. Of course, with the more recent
availability of experimental capabilities to inspect single
cells dynamically [16], more and more cells have been
seen to exhibit asynchronous oscillations [11,12,17].
Intact cells like yeast cells can synchronize their oscilla-
tions with each other [14], and theoretical studies have
demonstrated synchronization (of e.g. metabolic path-
ways) in communicating cells [15].
Experimental observations of oscillations have also
been made for the p53 [18,19] and mitogen-activated
protein kinase [9] signaling pathways, and can also be
seen in mathematical models of such processes
Keywords
enzyme kinetics; in silico; in vitro; nuclear
factor-jB regulation; signal transduction
Correspondence
A. E. C. Ihekwaba, VBI, Virginia Tech,
Washington Street, Blacksburg, VA, USA
Fax: +1 540 2312606
Tel: +1 540 2310795
E-mail:
(Received 13 July 2006, revised 19 Decem-
ber 2006, accepted 22 January 2007)
doi:10.1111/j.1742-4658.2007.05713.x
Previously, we have shown by sensitivity analysis, that the oscillatory
behavior of nuclear factor (NF-jB) is coupled to free IkappaB kinase-2
(IKK2) and IkappaBalpha(IjBa), and that the phosphorylation of IjBa by
IKK influences the amplitude of NF-jB oscillations. We have performed
further analyses of the behavior of NF-jB and its signal transduction net-
work to understand the dynamics of this system. A time lapse study of
NF-jB translocation in 10 000 cells showed discernible oscillations in levels
of nuclear NF-jB amongst cells when stimulated with interleukin (IL-1a),
which suggests a small degree of synchronization amongst the cell popula-
tion. When the kinetics for the phosphorylation of IjBa by IKK were
measured, we found that the values for the affinity and catalytic efficiency
of IKK2 for IjBa were dependent on assay conditions. The application of
these kinetic parameters in our computational model of the NF-jB path-
way resulted in significant differences in the oscillatory patterns of NF-jB
depending on the rate constant value used. Hence, interpretation of in silico
models should be made in the context of this uncertainty.
Abbreviations
IKK, IkappaB kinase; IL-1a, interleukin-1a; MeOH ⁄ EtOH ⁄ PEG, methanol ⁄ ethanol ⁄ polyethylene glycol; NF-jB, nuclear factor kappa B; SC-514,
4-amino-2,3¢-bithiophene-5-carboxamide.
1678 FEBS Journal 274 (2007) 1678–1690 ª 2007 Pfizer Global Research & Development Journal compilation ª 2007 FEBS
[7,9,18,20,21]. It is clear that the complexity of biologi-
cal systems and the difficulty (or at least infrequency)
of obtaining kinetic parameters require the develop-
ment of new analytical methods for both in vitro and
in silico biology [22]. A still bigger challenge is the
measurement of in vivo values of kinetic constants,
which may differ critically from their in vitro biochemi-
cal counterparts.
Oscillations have been demonstrated in a variety of
components of the NF-jB signaling pathway in single
cells [11,12]. These results agreed with in silico simula-
tions of the downstream region of the pathway that
was modeled, as well as suggesting that the oscillatory
frequency has functional significance for downstream
events, such that the signal is not simply encoded in its
amplitude [23].
Activation of the transcription factor NF-jB can be
triggered by exposure of cells to a multitude of external
stimuli, including the cytokines tumor necrosis factor
(TNF-a) and interleukin-1a (IL-1a), thus initiating
numerous and diverse intracellular signaling cascades,
most of which activate the IkappaB kinase (IKK) com-
plex. This crucial component in the NF-jB activation
cascade typically consists of two catalytic subunits
[24,25], IKKa (IKK1) and IKKb (IKK2) [26–29] and a
regulatory unit NF-jB essential modulator (NEMO,
IKKc) [30–33]. The cytoplasmic inhibitors of NF-jB
(the IjBs [34,35]) are phosphorylated by activated IKK
at specific N-terminal residues, tagging them for poly-
ubiquitination and rapid proteasomal degradation. This
allows NF-jB to be released upon activation and it
translocates to the nucleus where it induces the tran-
scription of a large number of target genes encoding reg-
ulators of immune and inflammatory responses and also
genes involved in apoptosis and cell proliferation [36].
In this paper, we report the results of cell-based,
in vitro and in silico experiments on the NF-jB pathway.
First, we demonstrate oscillations in a population of
10 000 A549 cells, which is consistent with synchron-
ous behavior. Secondly, we present in vitro kinetic
measurements of IKK2 protein kinase. We demon-
strate that the assay conditions can affect substantially
the apparent K
m
and k
cat
values of this reaction, whose
parameters are known to be important in an existing
computational model of the NF-jB pathway. Thirdly,
we use the aforementioned computational model
[10,37] to analyze in silico the effect of the parameter
variation discussed above. The parameter values cho-
sen for this reaction have a significant effect on the
amplitude (but not the frequency) of the oscillations.
Finally, we extend this in silico and in vitro strategy to
a cell-based approach to analyze the effect of a known
inhibitor of IKK2, 4-amino-2,3¢-bithiophene-5-carbox-
amide (SC-514) [38]. We initially performed an in vitro
study which confirmed the competitive nature of the
inhibition and the published IC
50
value. Surprisingly,
we then found that cells pretreated with inhibitor dis-
played oscillations of a similar strength (frequency) to
those observed in the untreated cell population. In
order to shed light on the cause of this result, we car-
ried out an in silico analysis by incorporating the inhi-
bition kinetics within the existing computational
model. This showed that the SC-514 inhibitor has lim-
ited impact on the dynamics of NF-jB activation.
Results and Discussion
Immunocytochemistry
Immunocytochemical staining of cell-based NF-jB pro-
teins was used to study oscillatory patterns in NF-jB
nuclear ⁄ cytoplasmic localization in A549 cells. In a pre-
vious study, an EC
50
of 0.340 ngÆmL
)1
for IL-1a was
established (Fig. 1A,B; data not published); in this
case, EC
50
is a measure of the IL-1a concentration
required to produce 50% of maximal response. To
investigate if different fixatives and types of the culture
substrate have an effect on the intensity of nuclear
NF-jB observed, a population time lapse study of nuc-
lear NF-jB translocation following cell stimulation
with 8 ngÆmL
)1
IL-1a was examined. Firstly, we com-
pared the use of a 96-well plastic-bottomed plate with
methanol ⁄ ethanol ⁄ polyethylene glycol (MeOH ⁄ EtOH ⁄
PEG) fixative (with 12 repeats for each time point to
minimize error as a result of background noise) and
glass-bottomed plates with 3.7% formaldehyde fixative
affected the quality of the stained images. Using im-
munocytochemical analysis, significant differences in
the peak intensity was observed between the two
assays. The comparison at the 30-min time point
revealed peak intensity of nuclear NF-jB to be 2.94
arbitrary units for the MeOH ⁄ EtOH ⁄ PEG fixative and
plastic culture plate combination (Fig. 1G) and 5.75
arbitrary units for the formaldehyde fixative and glass
culture plate combination (Fig. 1F). These results indi-
cated that the use of a combination of formaldehyde
fixative and glass culture plates produces a better
resolved image (higher signal ⁄ noise ratio), giving a bet-
ter dynamic range of output values when compared
with the use of the alcohol-based fixative and plastic
culture plates.
We recently showed asynchronous oscillation follow-
ing cell stimulation across four single cells [12,39]. It
has been previously suggested that population-based
analyses may not always reveal oscillatory behavior
that is occurring on the single-cell level, because pro-
A. E. C. Ihekwaba et al. In vitro analysis of NF-jB signaling pathway
FEBS Journal 274 (2007) 1678–1690 ª 2007 Pfizer Global Research & Development Journal compilation ª 2007 FEBS 1679
tein extracts average potentially asynchronous
responses of individual cells [40]. Despite this, we
observed discernible oscillations in the overall levels
of NF-jB activation in a population of 10 000 A549
cells suggesting a significant degree of synchronicity
(Fig. 1F,G). Note that the immunocytochemical
approach used does not facilitate the tracking of individ-
ual cells over time [40].
Having previously shown by sensitivity analysis
[37,41] that the oscillatory behavior of nuclear NF-jB
is tightly coupled to just two participating species, free
IKK2 and free IjBa, and that reactions such as the
phosphorylation of IjBa by IKK exerted a major con-
trolling influence on the amplitude [42] of the oscilla-
tions in the computational model [12,37], we next
studied the rate of IjBa phosphorylation by IKK.
Enzyme kinetics of rhIKK2 for glutathione-
S-transferase-IjBa
We investigated the kinetics of rhIKK2. Figure 2A
shows a typical progress curve for the IKK catalyzed
0
00
1
00
2
00
3
00
4
00
5
001
01
11
.
010.0100.0
L
–1
)m·gn(
L
–1
)m·gn(
.cnoc ahpla1-LI
Translocation Ratio
(Arbitary units)
L
–1
m·gn4
3.0= 0
5CE
1
2
3
4
5
6
7
0
01
0111.010.0
1
00
.0
.c
noc ah
pl
a1
-
L
I
Translocation Ratio
L
–1
m·gn841.0 = 05CE
A
B
C D E
5.1
7
.
1
9.1
1.2
3.
2
5.
2
7.2
9.2
1.3
0540040
5
3003
0
520
0
2
0
510
0
1050
n)im( emiT
[NF -
κκ
B]n
GEP
/H
Ot
E/HO
e
M
/
cit
s
alp
1
.
4
3.
4
5.4
7
.
4
9.4
1.5
3
.
5
5.5
7.5
9
.
5
0
5
4
004053003052002051001050
n)i
m
( em
i
T
[NF
-
κκ
B]n
edyhedl
a
m
r
o
f
/ ssalg
F
G
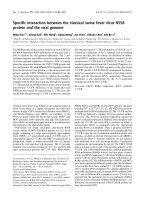
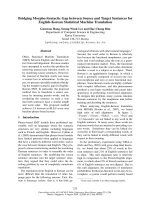
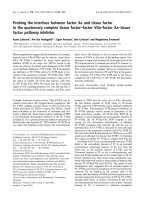
Fig. 1. Immunocytochemical staining of A549 cells and analysis of the dynamics of NF-jB nuclear translocation. (A,B) Dose–response data
from A549 stimulated with IL-1a and fixed with formaldehyde (A) and MeOH ⁄ EtOH ⁄ PEG (B) (data unpublished). (C–E) Cell images showing
nuclear cytoplasmic localization of NF-jB in stimulated (D) and stimulated after pretreatment with SC-514 inhibitor following 30 min of IL-1a
exposure. Cytoplasmic localization of NF-jB in nonstimulated cells is shown in (C), whereas in (D), localization of NF-jB is primarily in the
nucleus. Arrows draw attention to the localization of NF-jB. In (E), NF-jB is observed in both the nuclei and the cytoplasm of the cells. (F,G)
Time course plot of A549 cells stimulation with 8 ngÆ mL
)1
IL-1a generated on glass-bottomed plates with 3.7% formaldehyde fixative (F)
and clear-bottomed plastic plates with MeOH ⁄ EtOH ⁄ PEG fixative (G). The peaks are the fluorescent intensity of nuclear NF-jB when com-
pared with cytoplasmic NF-jB. The error bars in (A), (B), (F) and (G) display standard deviations.
In vitro analysis of NF-jB signaling pathway A. E. C. Ihekwaba et al.
1680 FEBS Journal 274 (2007) 1678–1690 ª 2007 Pfizer Global Research & Development Journal compilation ª 2007 FEBS
phophorylation of GST-IjBa. Figure 2B shows the
corresponding control without GST-IjBa. These data
are consistent with limited autophosphorylation. Fig-
ure 2C shows plots of rhIKK2 velocity as a function
of varying concentration of ATP (0.47–60 lm) at eight
fixed concentrations of GST-IjBa (0.12–15.33 lm). We
found rhIKK2 displayed standard Michaelis-Menten
kinetics at each GST-IjBa concentration with an
apparent K
m,ATP
value of 9.6 ± 3.5 lm (Fig. 2C and
Table 1). We further examined the kinase activity of
[ATP] (µM)
06
0
4020
Initial velocity (v)
n
M min-1
0
02
0
4
06
08
001
I-TS
G
[
κ
B
α
M)
µ
(]
I-TS
G
[
κ
B
α
)
M
µ
(]
61
41
21
01
86
4
2
0
Initial velocity (v)
n
M min-1
0
02
04
0
6
08
001
[ATP] (µM)
0604020
Initial velocity (v)
n
M min-1
2
4
6
8
01
2
1
4
1
6
1
81
02
22
61
41
2
1
018
64
20
Initial velocity (v)
n
M min-1
0
2
4
6
8
01
21
41
61
81
02
Time (min)
Time (min)
021001080604020
[
γ
-33P]-ATP bound
(nmoles)
0
2.0
4.0
021001080604020
[
γ
-33P]-ATP bound
(nmoles)
200.0
400.0
600.0
800.0
10.0
210.0
410.0
610.0
810.0
20.0
220.0
420.0
620.0
820.0
A
B
C
D
FE
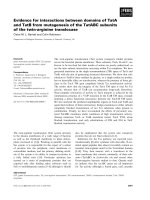
Fig. 2. Enzyme kinetics of rhIKK2 for substrate ATP and GST-IjBa. (A) Interaction between rhIKK2 and GST-IjBa (rhIKK2 in vitro kinase
assay coupled with GST-IjBa as described in Experimental procedures); V
max
is 1.11 · 10
)3
lMÆmin
)1
, K
s
is 5 · 10
)3
± 1.4 · 10
)3
lM.
(B) The control rhIKK2 in vitro kinase assay with no GST-IjBa substrate. The time (in minutes) on the abscissa indicates the time the reac-
tions were stopped with trichloroacetic acid and the plot shows the number of repeats. Phosphorylation of tagged IjBa (d; A) and auto-
phosphorylated rhIKK2 (j; B) is shown. In (A), s is the control assay, and in (B), s and D represent the control repeats, and j represents
the average of the two. Kinase activities were recorded as incorporation of c-
33
P (countsÆmin
)1
) into GST-IjBa (A) and IKK2 (B). (C, D) Micha-
elis–Menten plots generated by varying [ATP][60 l
M (s), 30 lM (d ), 15 lM (h), 7.5 lM (j), 3.75 lM (D), 1.88 lM (m), 0.94 lM (Ñ), 0.47 (.)]
at fixed [GST-IjBa] (C), and varying [GST-IjBa] [15.33 l
M (s), 7.67 lM (d), 3.83 lM (h), 1.92 lM (j), 0.96 lM (D), 0.48 lM (m), 0.24 lM (Ñ),
0.12 l
M (.) at a fixed [ATP] (D). Reactions (45 lL, plate assay) were performed at room temperature for 70 min with [c-
33
P]ATP (2.4 lCi).(E,
F) Enzyme kinetics of recombinant IKK2 for substrate ATP and GST-IjBa with MnCl
2
in Tris ⁄ HCl ⁄ MgCl
2
kinase buffer. Michaelis–Menten
plots generated by varying [ATP] at 15.33 l
M GST-IjBa (E), and varying [GST-IjBa]at60lM ATP (F). K
m,ATP
, K
m
,
GST-IjBa
, k
cat
and V
max
were
2.3 ± 0.6 l
M, 3.7 ± 0.9 lM, 1.51 · 10
)3
s
)1
and 18.7 nMÆmin
)1
, respectively, in kinase buffer Tris ⁄ HCl ⁄ MgCl
2
⁄ MnCl
2
and 2.5 ± 1.2 lM,
6.1 ± 1.3 l
M, 2.15 · 10
)3
s
)1
and 16.2 nMÆmin
)1
in kinase buffer Hepes ⁄ MgCl
2
⁄ MnCl
2
(data not shown).
A. E. C. Ihekwaba et al. In vitro analysis of NF-jB signaling pathway
FEBS Journal 274 (2007) 1678–1690 ª 2007 Pfizer Global Research & Development Journal compilation ª 2007 FEBS 1681
rhIKK2 as a function of varying concentrations of
GST-IjBa (0.12–15.33 lm) at eight fixed concentra-
tions of ATP (0.47–60 lm). Analyses showed the
apparent K
m,GST-IjBa
, value to be 3.8 ± 1.7 lm
(Fig. 2D and Table 1), at saturated ATP concentration
(six-fold of K
m,ATP
). We also found the apparent
maximal turnover rates (k
cat
) for rhIKK2 to be
1.13 · 10
)2
s
)1
at room temperature under the same
conditions.
Previously determined kinetics for IKK2 (Table 2),
revealed a 10–52-fold and 30–140-fold variation in
the K
m
values estimated for IjBa and ATP, respect-
ively. The wide variation in these reported K
m
values
may be attributed to the use of rhIKK2, nonrhIKK2
or IKK complex, and also different experimental
conditions. The K
m
that we determined for GST-
IjBa is comparable to a number of previously pub-
lished values within this wide range [28,43–47]. Simi-
larly, our result for K
m,ATP
is in agreement with
some of the values reported in the literature
[43,47,48].
A noteworthy difference in the previously reported
experiments is the presence [33,38,45,46,49–51] or
absence [43,44,47,48] of MnCl
2
in the assay conditions
(i.e. MgCl
2
with MnCl
2
vs. MgCl
2
only). We therefore
decided to perform a second investigation of the K
m
values in the presence of MnCl
2
, but with all other
experimental conditions constant. Comparison with the
values already obtained in the absence of MnCl
2
would
therefore enable us to quantify this effect on two key
parameters (as determined by us [37]) in our in silico
model.
Kinetic analysis showed K
m,ATP
, K
m,GST-IjBa,
k
cat
and
V
max
to have values of 2.3 ± 0.6 lm, 3.7 ± 0.9 lm,
1.51 · 10
)3
s
)1
and 18.7 nmÆmin
)1
, respectively, using
Tris ⁄ HCl ⁄ MgCl
2
⁄ MnCl
2
buffer and 2.5 ± 1.2 lm,
6.1 ± 1.3 lm, 2.15 · 10
)3
s
)1
and 16.2 n mÆ min
)1
in the
kinase assay using Hepes ⁄ MgCl
2
⁄ MnCl
2
buffer. These
findings confirmed the importance of kinase conditions
used for determining kinetic values (Fig. 2E,F). A list
of previously established kinetic values for IKK2 is
reviewed in Table 2.
Having shown that the disparity in the experimental
kinetic results is dependent on the kinase condition
used, we next studied how the experimental kinetic
data reported here affected the NF-jB model previ-
ously described [12,37,39]. Substitution of the rates
with the kinetic values reported in this section and
Table 2 showed a more damped oscillatory pattern,
similar to (see Fig. 3H in [52]) and with comparable
frequency to the original model (see Fig. 3D).
These findings indicate that substituting previously
reported kinetic data in the original model with the
experimental data determined here results in an oscilla-
tory pattern analogous to that seen in the population
time study of the A549 cells (Fig. 1F,G, where the
Table 2. A list of kinetic constants for IjBa and ATP substrates with IKK2. rh, recombinant human IKK2; nonrh, nonrecombinant human
IKK2; norm, IKK complex; Y, present.
K
m (ATP)
(lM)
K
m(IjBa)
(lM)
k
cat
(s
)1
) · 10
)3
Type of
IKK2 Buffer MgCl
2
MnCl
2
Reference
7.3 0.05 nonrh Tris ⁄ HCl Y [48]
0.13 1.3 4.5 norm Hepes Y Y [45]
2.2 rh Tris ⁄ HCl Y [28]
15.5 2.6 21.0 rh Tris ⁄ HCl Y [43]
0.13 1.4 5 norm Hepes Y Y [46]
1.7 37.0 rh Tris ⁄ HCl Y [44]
0.56 0.5 0.92 norm Hepes Y Y [33]
18 2.2 3.5 rh Hepes Y [47]
0.65 0.94 4.56 rh Hepes Y Y [49]
0.6 0.7 11.2 rh Hepes Y Y [51]
9.6 3.83 11.3 rh Tris ⁄ HCl Y
2.5 6.1 2.15 rh Hepes Y Y
2.3 3.7 1.51 rh Tris ⁄ HCl Y Y
Table 1. Michaelis–Menten kinetics, maximal turnover rates for
rhIKK2, the limiting maximal velocity and the ratio of apparent dis-
sociation constants for binding GST-IjBa in the presence and
absence of ATP. K
app
m
is the apparent dissociation constant for full
length GST-IjBa substrate at saturation concentration of 60 l
M
ATP, and the dissociation constant for ATP at saturation concentra-
tion of 15.33 l
M GST-IjBa. The apparent V
max
(V
app
max
)at60lM ATP
and 50 n
M IKK2 is 136 ± 4.2 nMÆmin
)1
.
k
cat
(s
)1
) · 10
)2
K
app
m
(lM)
V
app
max
(nMÆmin
)1
) a
GST-IjBa 1.13 ± 0.016 3.8 ± 1.7 136 ± 4.2 0.9 ± 0.5
ATP 1.13 ± 0.016 9.6 ± 3.5 136 ± 4.2 0.9 ± 0.5
In vitro analysis of NF-jB signaling pathway A. E. C. Ihekwaba et al.
1682 FEBS Journal 274 (2007) 1678–1690 ª 2007 Pfizer Global Research & Development Journal compilation ª 2007 FEBS
amplitudes are damped). We have thus far demonstra-
ted that kinase assay conditions affect the experimental
rate values. We have also substantiated that the oscilla-
tory pattern of the model is affected when the new data
is implemented in the model. We next studied the impact
of a rhIKK2 inhibitor on the oscillatory pattern of both
cell-based and in silico nuclear NF-jB translocation.
Effect of SC-514 Inhibitor on cell-based nuclear
NF-jB translocation
Kishore et al. [38] first characterized the selective
inhibitor SC-514 in 2003, and showed that it inhibited
all forms of recombinant human IKK2 including
rhIKK2 homodimer and rhIKK1 ⁄ IKK2 complex
6.3
1.4
6.4
1.5
6.5
1.6
0540040530030520
0
2051001050
Time (min)
[NF-
κ
B]n
detalumits945Adetaertnu
s
l
lec
d
e
t
a
l
umi
ts94
5Ad
e
ta
e
r
t-e
rp
s
l
l
e
c
0
10
.0
20.0
30
.0
40
.0
5
0
.0
60
.0
7
0.0
80
.0
90
.0
1
.0
054
004
0
53
0
0305
2
002
051
0
01
050
Time (min)
[NF-
κ
B]n
l
ed
om
l
a
nigirO
l
edomw
eN
0
10.0
20
.0
30.0
4
0.0
50.0
60.0
70.0
8
0.0
90.0
1.0
054004053003052002051001050
Time (min)
[NF-
κ
B]n
ledomlanigirO
ledomweN
ledomroti
bi
hnI
00010010111.0
% CONTROL
0
02
04
06
08
001
[INHIBITOR] [INHIBITOR]
00
010
010
11
1.0
[
γ
-33P]-ATP bound
(nmoles)
0
2.
0
4.0
6.
0
8.0
1
A
B
C
D
E
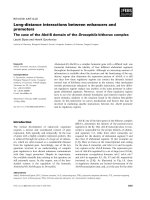
Fig. 3. Effect of SC-514 inhibitor on the activity of rhIKK2 homodimer. (A,B) Different concentrations of SC-514 inhibitor was incubated with
recombinant IKK2, and an IC
50
experiment was undertaken using 10 lM (A, h), 1 lM (B, d) and 0.1 lM (B, s) ATP as described in Experi-
mental procedures. (C) Time lapse of nuclear cytoplasmic localization of NF-jB in 10 000 A549 cells. These cells were dispensed onto a
Whatman 96 glass bottomed plates and treated with 8 ngÆmL
)1
IL-1a in the presence and absence of the SC-514 inhibitor. (D, E) Time
course plot of nuclear NF-jB from in vitro and in silico analysis of the data. The plot shows nuclear NF-jB oscillation in the original model
and in the updated model with newly measured k
r1,
k
a1
and k
d1
for IKKIjBa complex (D). In the original model k
r1
(k
cat
) for IKKIjBa was
4.07 · 10
)3
s
)1
. In the updated model, the original values are replaced with 1.13 · 10
)2
s
)1
(D). (E) shows a plot of the original and the
updated model with the inclusion of newly measured K
i
in the updated model.
A. E. C. Ihekwaba et al. In vitro analysis of NF-jB signaling pathway
FEBS Journal 274 (2007) 1678–1690 ª 2007 Pfizer Global Research & Development Journal compilation ª 2007 FEBS 1683
[38,53,54]. A comparable IC
50
value for rhIKK2 was
obtained in the present study to that previously repor-
ted by Kishore et al. [38]. We obtained values of
0.13 ± 0.06 lm for 0.1 lm ATP, 0.17 ± 0.08 lm for
1 lm ATP and 5.61 ± 0.65 lm for 10 lm ATP
(Fig. 3A,B). This shift in IC
50
values confirms the
competitive nature of this SC-514 inhibitor. It was also
observed that a concentration of 100 lm of SC-514 is
sufficient to completely inhibit IjBa degradation by
IKK2 in vitro (Fig. 3A,B); this was also as established
by Kishore et al. [38]. Having shown SC-514 to inhibit
IjBa phosphorylation, thus demonstrating an inhibi-
tion of IKK2 activity in vitro, we next determined whe-
ther SC-514 would inhibit activated native IKK
complex in IL-1a-stimulated A549 cells.
To test whether these in vitro data were also found in
in vitro cell cultures, a nuclear NF-jB translocation
assay was performed where the cells were pretreated
with 100 lm of the SC-514 inhibitor. We examined the
effect of SC-514 treatment on NF-jB activation by
stimulating A549 cells with IL-1a for 400 min. In the
presence of SC-514, the kinetics of NF-jB activation
and inactivation with the IL-1a was observed. Immu-
nofluorescence analysis showed that following a 6-h
exposure with IL-1a, NF-jB translocated from the
cytoplasm to the nucleus in the entire A549 population,
irrespective of their pretreatment with SC-514 inhibitor
(Fig. 3C). Figure 3C displays time-course plots of nuc-
lear NF-jB dynamics for pretreated and untreated
A549-stimulated cells. Interestingly, the pretreated cells
displayed clearly discernible oscillations that closely fol-
lowed those of the untreated cells in terms of their fre-
quency. The effects of exposing the cells to the
inhibitor were slight, amounting to a modest reduction
in amplitude and a delay in the first oscillatory peak.
It is interesting to speculate on the failure of the
inhibitor to eliminate the oscillations or at least sub-
stantially dampen them. A similar apparent discrepancy
between in vitro and cell-based results was also reported
by Kishore et al. [38], who reported some phosphory-
lation of IjBa even after SC-514 pretreatment at a level
(100 lm) that caused complete in vitro inhibition. One
possible explanation is that this inhibitor does not block
the activity of another IKK isoform, IKK1. Conse-
quently, IjBa may still be phosphorylated by the IKK1
isoform when the IKK1 isoform is present and activ-
ated in the system. Another could be that the intracellu-
lar concentrations of ATP (Mg) are high enough to
attenuate observed inhibition. Alternatively, it may well
be the case that IKK is not the only point of regulation
in the NF-jB pathway [55], and that IjBa phosphory-
lation and degradation, and the subsequent transloca-
tion of NF-jB into the nucleus may be mediated by
another mechanism. Such a mechanism could be
derived from the theory underlying metabolic control
analysis, which states that the control exerted by indi-
vidual parameters depends not only on their own
magnitude but also on that of all the others [56,57].
Effect of SC-514 Inhibitor on in silico
nuclear
NF-jB translocation
To investigate whether the observed in vitro and cell-
based inhibition data translated to an in silico effect,
we examined the impact of the determined experimen-
tal inhibition kinetic data on the same model previ-
ously described by Ihekwaba et al. [37]. Inclusion of
our experimentally determined rate constant (K
i
0.114 lm; k
cat
11.3 · 10
)3
s
)1
) resulted in a dampened
oscillatory pattern with a frequency similar to that of
the original model (Fig. 3E).
Interestingly, the inclusion of IKK2 inhibition by
SC-514 with our experimentally determined rate con-
stants in the original model resulted in a delay in simu-
lated peak 1 and damping of subsequent peaks
(Fig. 3E), a feature also observed in the cell-based
assay (Fig. 3C). One implication of this finding is that
the effects of future inhibitors designed for this NF-jB
signaling pathway should be tested not just in vitro
and cell based but also simulated in silico. Combining
this method of analysis (in vitro, cell-based and in silico
analysis) will facilitate systematic understanding of the
underlying properties of this signaling pathway.
To summarize
Activation of cells via stimuli, TNF-a [12] and IL-1a
[58] induces activation of the NF-jB transcription fac-
tor. The consequences of how changes in external stim-
uli influenced a cascade of co-operative events were
assessed in vitro, in cell cultures, and also in silico in
this study.
Previous work [12] demonstrated oscillatory behav-
ior in the levels of nuclear NF-jB in single cell studies.
In our cell-based experiments, a population of
10 000 A549 cells was observed to undergo similar
oscillatory behavior to that discovered in single cells in
terms of the peak periods and frequency. This clearly
demonstrated that these cells have the ability to syn-
chronize their oscillations with each other.
The study of signaling pathway dynamics requires
detailed cell-based measurements of time-varying phe-
nomena, in this case, oscillatory variations of nuc-
lear levels of NF-jB. In order to attain this degree of
precision, optimization of experimental conditions and
techniques is required. In the past three decades,
In vitro analysis of NF-jB signaling pathway A. E. C. Ihekwaba et al.
1684 FEBS Journal 274 (2007) 1678–1690 ª 2007 Pfizer Global Research & Development Journal compilation ª 2007 FEBS
advances in cell culture techniques and immunocyto-
chemistry have enabled the explanation of diverse
immunological phenomena. We evaluated two alternat-
ive immunocytochemical experimental protocols for
cell assay analysis and found one to be superior for
the scope of this study. Better resolved immunocyto-
chemical images were obtained using glass bottomed
plates with formaldehyde fixative rather than plastic-
bottomed plates with MeOH ⁄ EtOH ⁄ PEG fixative.
A quantitative assay to measure the phosphorylating
activity of rhIKK2 enzymes with GST-IjBa substrate
was described. It was observed that subtle changes in
the experimental design had a profound effect on the
kinetic data obtained. Kinase assay environment was
shown in this study to have a significant effect on the
K
m,GST-IjBa
, K
m
,
ATP
, and the V
max
found, and cautions
us to take appropriate measures when choosing rate val-
ues from the literature. The importance of choosing the
relevant kinetic parameters when building a computa-
tional model was also demonstrated in this study.
We have shown that the inhibition of IKK2 blocks
response in vitro. Despite the fact that IKK2 has been
identified as a key participant in the NF-jB signaling
pathways, both our cell-based and in silico studies
revealed that this inhibition has limited impact on the
dynamics of NF-jB activation.
It should be stressed that the in silico model presen-
ted here represents a considerable simplification of the
NF-jB signaling pathway. For example, it does not
consider participants upstream of IKK2, or other
putative mechanisms for regulation of nuclear NF-jB.
Nevertheless, the findings presented in this paper dem-
onstrate that even a simplified computational model
can give us a deeper understanding of the complex sys-
tem behavior of such signaling pathways.
The key findings indicate that computational mode-
ling can be a useful complement to biochemical and
imaging experiments. The results reported in this paper
should encourage further synergistic experimental and
computational studies aimed towards elucidating other
complex signaling systems.
Experimental procedures
Materials
Materials and apparatus, and their suppliers, were as
follows: formaldehyde (3.7%) in NaCl ⁄ P
i
(internal stores,
Pfizer Global Research and Development, Sandwich, UK);
MeOH ⁄ EtOH ⁄ PEG [60% v ⁄ v 95% EtOH, 20% v ⁄ v MeOH
(HPLC quality), 7% v ⁄ v PEG (Sigma Aldrich, Gillingham,
UK); NaCl ⁄ P
i
, pH 7.2 (Invitrogen, Paisley, UK)]; poly-
oxyethylene sorbitan monolaurate (Sigma); Draq 5 nuclear
stain (Biostatus Ltd., Shepshed, UK); Cellomics NF-jB Hit
kit Evaluation ⁄ Screening (Cellomics Inc., Pittsburg, PA,
USA); DMEM (Gibco, Invitrogen); 200 mml-glutamine;
fetal bovine serum (Gibco Invitrogen, Virkon, Pfizer internal
stores) IL-1a (R & D Systems, Minneapolis, MN, USA);
Whatman 96-well sterile tissue culture treated glass bot-
tomed plates; 96-well, clear-bottomed plastic plates (Costar);
Gilson p200 yellow, p1000 blue and p10 pink tips (Gilson,
Middleton, WI, USA); Reagent boats and Falcon tubes.
Recombinant IKK2 was donated by Frank Stuhmeier of
the Hit Discovery Group (HDG laboratory at Pfizer).
Other reagents and apparatus used were as follows: GST-
IjBa fusion protein [c-
33
P]ATP (Amersham Bioscience,
Chalfont St Giles, UK); ATP (Roche diagnostics GmbH,
Mannheim, Germany); trichloroacetic acid; 50 mm
Tris ⁄ HCl pH 7.5, 10 mm MgCl
2
;50mm Hepes pH 7.5,
10 mm MnCl
2
; NaCl ⁄ P
i
(Invitrogen); Microscint 40 (Pack-
ard, Waltham, MA, USA); Plate seals (Packard); 96-well
white microplate with bonded GF ⁄ C filter [unifilter 96,
GF ⁄ C (Perkin Elmer)]; microtiter plate (Millipore Corp.).
All other reagents and apparatus were of high quality avail-
able from Sigma sources.
Cell culture
A549 cells (human lung carcinoma epithelial cell line
SNB0000178-CE A549) were passaged every 4 days in
DMEM (+ 5 mml-glutamine and 5% fetal bovine serum)
and maintained at 37 °C and 5% CO
2
. For translocation
experiments, cells were removed with 0.05% trypsin ⁄ EDTA,
and plated with cell solution of 1 · 10
6
cellsÆmL
)1
(in a
50 mL flask) and grown until 80% confluency.
Cellular assays
A549 cell solution (100 lL) was seeded on a plastic, flat-bot-
tomed 6 · 96-well- plates (Coster) at a density of 1 · 10
4
cells per well and incubated for an 18–24-h period at 37 °C
and 5% CO
2
. A solution of IL-1a (concentration
40 ngÆmL
)1
resulting in a final concentration of 8 ngÆmL
)1
per well due to the 1 : 5 dilution factor) was prepared for
the time-course assay. Stimulation of cells was performed at
10-min intervals for 400 min with IL-1a. After 400 min, the
plates were inverted to remove media into a dish containing
Virkon disinfectant to destroy cells not adhered to the
plates. MeOH ⁄ EtOH ⁄ PEG fixation solution (100 lL; pre-
warmed in a water bath at 37 °C) was dispensed into each
well and incubated for 15 min (prewarming fixative is critical
to maintaining cell integrity). After 15 min, the plates were
inverted to remove the fixation solution, and 100 lLof
NaCl ⁄ P
i
was dispensed into the wells. The plates were next
inverted to remove the NaCl ⁄ P
i
wash solution, 100 lLof
permeabilization buffer was then dispensed into the wells
and left to incubate for 90 s at room temperature. The plates
were again inverted to remove the permeabilization buffer,
A. E. C. Ihekwaba et al. In vitro analysis of NF-jB signaling pathway
FEBS Journal 274 (2007) 1678–1690 ª 2007 Pfizer Global Research & Development Journal compilation ª 2007 FEBS 1685
and washed twice with NaCl ⁄ P
i
thereby removing wash buf-
fer by inverting the plates. Rabbit polyclonal immunoglob-
ulin IgG (50 lL; primary antibody) was dispensed into each
well and left to incubate for 1 h at room temperature. The
plates were inverted to remove antibody after the 1 h incu-
bation period, 100 lL of detergent [NaCl ⁄ P
i
and 0.1%
Tween 20 (polyoxyethylene sorbitan monolaurate)] was dis-
pensed into the wells and the plates left to incubate for
15 min. The plates were inverted to remove the detergent
after the 15 min incubation period and the wells were
washed twice with wash buffer by inverting the plates. Stain-
ing solution (50 lL; containing goat antirabbit IgG conju-
gated to Alexa Fluor 488 secondary antibody and Draq5
dye; or and Hoechst 33258 dye) was dispensed into each well
and left to incubate for 1 h at room temperature in the dark.
The plates were inverted to remove the antibody solution
and 100 lL of detergent dispensed into the wells and left to
incubate for 10 min. The plates were inverted to remove
detergent solution and 100 lL of wash solution dispensed
into the wells. The plates were inverted to remove the wash
solution for the last time and replaced with 200 lL of wash
buffer. The plates were sealed and analyzed on Evotec
OPERA (Evotec, Hamburg, Germany). This assay study
was also repeated with a glass flat-bottomed 6 · 96-well
plates (Whatman) and 4% formaldehyde fixative.
Immunocytochemical analysis
On reading a microplate using the NF-jB protocol, the
Evotec OPERA has been programmed to find the nuclei
centers of the cells by using the DRAQ5 or Hoechst 33258
nuclear stain image. DRAQ5 is excited with 633 nm laser
and its peak emission is 685 nm, whilst Hoechst uses near-
UV excitation (380 nm) and gives blue emission (530 nm).
The software was used according to the manufacturer’s
instructions (Scheme 1).
Cloning, expression and purification of GST-IjBa
fusion proteins
To overexpress the protein GST-IjBa, the plasmid vectors
were transformed into BL21 (DE3) Escherichia coli. strains,
and the cells were grown overnight in 10 mL LB medium
containing 100 lgÆmL
)1
ampicillin. A colony of E. coli.in
LB agar plates was inoculated into 50 mL of LB liquid med-
ium and incubated on shaking platform with 200 r.p.m. at
37 °C for 3 h. The value at D
600
measured by spectrophotom-
etry was used to indicate the bacterial concentrations. Inocu-
lated liquid medium (2 · 25 mL) was added into a
2 · 500 mL of LB liquid medium, and incubated on rotator
with 200 r.p.m. at 37 °C for 1.5 h. The value at D
600
was
again measured by spectrophotometry. The glutathione-S-
transferase fusion proteins were induced by 2 · 500 lLof
1mm isopropyl b-d-1-thiogalactopyranoside addition to the
E. coli medium and finally incubated on a rotator with
200 r.p.m. at 37 °C for 3 h. The bacterial cells in the
2 · 500 mL medium were harvested by centrifugation
(27 500 r.p.m. for 10 min, 4 °C, Beckman rotor). Collected
bacteria were re-suspended in a 2 · 25 mL NaCl ⁄ P
i
buffer.
The re-suspended cell mixture was placed in a disrupter
machine with NaCl ⁄ P
i
and 2-mercaptoethanol (total collec-
ted volume ¼ 120 mL). Benzoase (125 unitsÆmL
)1
) added to
the collected viscous liquid. The collected liquid was centri-
fuged, the separated soluble fusion protein filtered (volume
collected ¼ 110 mL) and purified using immobilized metal
chromatography at 4 mLÆmin
)1
(absorbance of collected
liquid using IMAC ¼ A
280
). The supernatant was loaded
onto a glutathione affinity column according to the manufac-
turer’s protocol. Bound glutathione-S-transferase proteins
eluted with 5 mm glutathione in NaCl ⁄ P
i
(and 2-mercapto-
ethanol). GST-IjBa (6 mL) eluted from the column. Protein
concentrations measured in a Bradford (Bio-Rad, Hercules,
CA, USA) protein assay. Peak fraction were pooled and sub-
jected to 12% Tris-glycine SDS ⁄ PAGE and western analysis
to determine the purity of the GST-IjBa. Glycerol (2 mL)
was added to prevent damage from freezing, and the end vol-
ume was transferred into Eppendorf tubes in aliquots of
400 lL.
Kinase time-course assay
Recombinant human IKK2 (rhIKK2) time-course reaction
was carried out for 113 min in 50 mm Tris ⁄ HCl, pH 7.5,
and 10 mm MgCl
2
. Reactions were performed in a final vol-
ume of 45 lL (15 lL of rhIKK2, 15 lL ATP [c-
33
P]ATP,
15 lL GST-IjBa for kinase assay and 15 lL of rhIKK2,
15 lL ATP [c-
33
P]ATP, 15 lL50mm Tris ⁄ HCl pH 7.5,
10 mm MgCl
2
for control assay). For experiments related to
K
s
determination of rhKK2 and GST-IjBa binding, assays
were carried out with 50 nm IKK2, 1 lm GST-IjBa peptide,
0.05 lCi [c-
33
P] ATP (10 mCiÆmmol
)1
) and 0.2 lm ATP.
Reaction mixture was withdrawn and dispensed into a
96-well white microplate with bonded GF ⁄ C filter [unifilter
96, GF ⁄ C (Perkin Elmer)]. Each well was successively
washed five times with 100 lL of 12% w ⁄ v trichloroacetic
acid, once with 100 lL2lm ATP, twice again with 100 lL
12% w ⁄ v trichloracetic acid, and once with 100 lL50mm
Tris ⁄ HCl, pH 7.5, and 10 mm MgCl
2
. The plate was
Intensity of cytoplasm
Intensity of nucleus
Ratio of Translocation =
Intensity of cytoplasm
Intensity of nucleus
Scheme 1. This is a simplification of a cell as seen by analysis
software, where the software measures the intensity of NF-jBin
the nucleus when compared with the intensity of NF-jB in the cell.
In vitro analysis of NF-jB signaling pathway A. E. C. Ihekwaba et al.
1686 FEBS Journal 274 (2007) 1678–1690 ª 2007 Pfizer Global Research & Development Journal compilation ª 2007 FEBS
allowed to dry for 10 min in a 55 °C oven, and then 35 lL
of scintillation fluid (Microscint 40) was dispensed to each
well. Incorporated [c-
33
P]ATP was measured using a Top
count NXT (Packard). The amount of IKK-catalyzed
incorporation of
33
P into each peptide was quantified by
liquid scintillation counting. The counts represent initial
velocity of rhIKK2-catalysed phosphorylation (< 30% of
total ATP conversion). The graphs were fitted using gra-
fit
TM
software, and k
1
and k
2
were calculated from V
max
and K
s
values expressed in unitsÆmol
)1
of enzyme per min
and unitsÆmol
)1
, respectively.
Kinase assay with Tris ⁄ HCl ⁄ MgCl
2
rhIKK2 kinase reactions were carried out for 70 min in
50 mm Tris ⁄ HCl, pH 7.5, and 10 mm MgCl
2
. The amounts
of substrates ATP, [c-
33
P]ATP (10 mCiÆmmol
)1
; Amersham
Bioscience), and GST-IjBa are specified for each individual
experiment. Reactions were performed in a final volume of
45 lL (15 lL of rhIKK2, 15 lL ATP, [c
33
À
P]ATP, 15 lL
GST-IjBa). For experiments related to K
m
determinations
of IKK2, various concentrations of ATP and GST-IjBa
peptide were used in the assay at a fixed concentration of
either GST-IjBa or ATP. For GST-IjBa peptide K
m
,
assays were carried out with 50 nm IKK2, 60 lm ATP,
2.4 lCi [c-
33
P]ATP (10 mCiÆmmol
)1
) and GST-IjBa pep-
tide from 0.12 to 15.33 lm. For ATP K
m
, assays were car-
ried out with 50 nm IKK2, 15.33 lm GST-IjBa peptide,
1 lCi [c-
33
P]ATP (10 mCi Æmmol
)1
) and ATP from 0.47 to
60 lm. Sample was analyzed by precipitation on a micro-
titer plate (Millipore Corp). For the microtiter plate assays,
45 lL of reaction sample ⁄ well was precipitated with 45 lL
of 12% w ⁄ v trichloroacetic acid. 70 lL of the reaction mix-
ture was withdrawn and dispensed into a 96-well white
microplate with bonded GF ⁄ C filter (unifilter 96, GF ⁄ C;
Perkin Elmer). Washing of precipitated sample was per-
formed using the same protocol as that described for the
kinase time-course assay. The assay was again repeated
with the inclusion of 10 mm MnCl
2
in the kinase condition.
Kinase assay with Hepes ⁄ MgCl
2
⁄ MnCl
2
rhIKK kinase reactions were carried out for 70 min in
50 mm Hepes pH 7.5, and 10 mm MgCl
2
and 10 mm
MnCl
2
. The amounts of substrates, ATP, [c-
33
P]ATP
(10 mCiÆmmol
)1
, Amersham Bioscience) and GST-IjBa
were the same as those specified in the assay with
Tris ⁄ HCl ⁄ MgCl
2
. Reactions were performed using the same
protocol as that described for the Tris ⁄ HCl ⁄ MgCl
2
assay.
IC
50
([I]
0.5
) dose–response assay
IC
50
experiments were performed in 96-well Millipore
plates. The reactions were carried out for 45 min in 50 mm
Tris ⁄ HCl, pH 7.5, and 10 mm MgCl
2
and typically inclu-
ded: 50 ng of rhIKK2; varying concentrations of SC-514
inhibitor [300–0.1 lm; reconstituted 2.688 mg of SC-514
(relative molecular mass 224 g) to 1 mL of 12 000 lm stock
solution in 100% dimethyl sulfoxide]; and 5.11 lm GST-
IjBa peptide per well at 10 lm ATP 1 l Ci [c
33
À
P]ATP
(10 mCiÆmmol
)1
), 1 lm ATP 0.1 lCi [c
33
À
P]ATP (10
mCiÆmmol
)1
) and 0.1 lm ATP 0.05 lCi [c
33
À
P]ATP
(10 mCiÆmmol
)1
) separate ATP concentrations, to make a
total volume of 40 lL (rhIKK2 10 lL, SC-514 10 lL, ATP
10 lL and GST-IjBa 10 lL). The reaction was run in
duplicate. A positive and a negative control assay were also
included, where the positive control contains no inhibitor in
the assay and the negative control was stopped at time
zero. Reaction sample (40 lLÆwell
)1
) was precipitated with
40 lL of 12% w ⁄ v trichloroacetic acid. Reactions were per-
formed using the same protocol as that described for the
Tris ⁄ HCl ⁄ MgCl
2
and Hepes ⁄ MgCl
2
⁄ MnCl
2
assay.
Kinetic analysis
For two substrate profile analysis, initial velocity studies
were performed with varying concentrations of GST-IjBa
at several fixed concentrations of ATP and vice versa (order
of binding experiments). Lineweaver–Burk double recipro-
cal plots were generated by linear least squares fits of the
data. Replotting the slopes and the y intercepts of the lines
as function of 1 ⁄ [ATP] generated secondary plots. Kinetic
constants (K
m
for ATP, GST-IjBa, and V
max
) values were
determined from a global fit to the database using eritha-
cus software grafit 4- where V
max
is the limiting maximal
velocity that would be observed when all the enzyme is pre-
sent as enzyme–substrate ‘ES’ [rhIKK2-GST-IjBa], K
m
is
the Michaelis–Menten constant and the k
cat
is the break-
down of the ES complex to E + product (P) [59] (Eqn 1).
The equilibria describing competitive inhibition of the
SC-514 are show in Eqn 2, where K
i
is the dissociation con-
stant for the enzyme–inhibitor (EI) complex. To obtain
50% (IC
50
) inhibition, refer to Eqn 2 [59].
E
þ
þ S
À!
À
k
2
k
1
ES À!
k
cat
E þ P
I
#" K
i
EI
½1
K
i
¼ IC
50
=½1 þð½S=K
m
Þ ½2
For a random sequential model, values for K
m,ATP
,
K
m,GST-IjBa
, V
max
and a was determined from the global
fit. The constant a is the ratio of apparent dissociation con-
stants for binding GST-IjBa in the presence and absence
of ATP, and the value of a indicates whether the binding
of one substrate (ATP) affects the affinity of the enzyme
for the other substrate (GST-IjB a ) [59].
A. E. C. Ihekwaba et al. In vitro analysis of NF-jB signaling pathway
FEBS Journal 274 (2007) 1678–1690 ª 2007 Pfizer Global Research & Development Journal compilation ª 2007 FEBS 1687
SC-514 inhibition cellular assays
A549 cells were pretreated with 100 lm SC-514 inhibitor.
IKK2 inhibitor (25 lL, 600 lm; SC-514) (100 lmÆwell
)1
due
to the 1 : 6 dilution factor) was dispensed into the wells of
each plate prior to IL-1a addition. A total of 48 ngÆmL
)1
(8 ngÆmL
)1
per well due to the 1 : 6 dilution factor for wells
containing IKK2 inhibitor) of IL-1a was prepared for cell
assay and was added following the same procedure des-
cribed for the time course cell assay. The cells were washed
with NaCl ⁄ P
i
and fixed after 400 min, and the standard
immunocytochemical detection applied. The plates were
sealed and analyzed using an Evotec OPERA confocal
micro plate imaging reader (Evotec).
Mathematical modeling
All simulations were performed using gepasi and copasi
simulators, initially with parameters described in the revised
supplemental information for Hoffmann et al. [10] (http://
www.sciencemag.org/cgi/data/298/55965596/1241/DC1/2);
including the pre-equilibration period of 2000 s. A diagram
of the network can be obtained from [12,37,41]. Parameters
were varied using the ‘scan’ function in gepasi. The mathe-
matical model described here has been submitted to the
online Cellular Systems Modeling Database and can be
accessed at />index.html free of charge.
Acknowledgements
We thank everyone at Discovery Biology (HDG) Pfizer
(PGRD) Sandwich, especially, Simon Eaglestone for
providing the GST-IjBa, Frank Stuheimer for provi-
ding the recombinant IKK2 (rhIKK2) and Nandini
Kishore for providing the SC-514 inhibitor. We thank
also Paul Hayter, Sasha Sreckovic and Matthew
Strawbridge with help in growing and analyzing the
A549 cells and finally BBSRC for the award of a
CASE studentship to AECI.
References
1 Chakraborty AK, Dustin ML & Shaw AS (2003) In silico
models for cellular and molecular immunology: suc-
cesses, promises and challenges. Nat Immunol 4, 933–936.
2 Westerhoff HV & Palsson BO (2004) The evolution of
molecular biology into systems biology. Nat Biotechnol
22, 1249–1252.
3 Tyson JJ, Chen KC & Novak B (2003) Sniffers, buzzers,
toggles and blinkers: dynamics of regulatory and signal-
ing pathways in the cell. Curr Opin Cell Biol 15, 221–231.
4 Butcher EC, Berg EL & Kunkel EJ (2004) Systems biol-
ogy in drug discovery. Nat Biotechnol 22, 1253–1259.
5 Moore MN & Noble D (2004) Editorial: computational
modelling of cell & tissue processes & function. J Mol
Histol 35 , 655–658.
6 Barabasi AL & Oltvai ZN (2004) Network biology:
understanding the cell’s functional organization. Nat
Rev Genet 5, 101–113.
7 Bhalla US (2003) Understanding complex signaling net-
works through models and metaphors. Prog Biophys
Mol Biol 81, 45–65.
8 Sachs K, Perez O, Pe’er D, Lauffenburger DA & Nolan
GP (2005) Causal protein-signaling networks derived
from multiparameter single-cell data. Science 308, 523–
529.
9 Sasagawa S, Ozaki Y, Fujita K & Kuroda S (2005)
Prediction and validation of the distinct dynamics of
transient and sustained ERK activation. Nat Cell Biol 7,
365–373.
10 Hoffmann A, Levchenko A, Scott ML & Baltimore D
(2002) The IkappaB-NF-kappaB signaling module: tem-
poral control and selective gene activation. Science 298,
1241–1245.
11 Nelson G, Paraoan L, Spiller DG, Wilde GJ, Browne
MA, Djali PK, Unitt JF, Sullivan E, Floettmann E &
White MR (2002) Multi-parameter analysis of the
kinetics of NF-kappaB signalling and transcription in
single living cells. J Cell Sci 115, 1137–1148.
12 Nelson DE, Ihekwaba AE, Elliott M, Johnson JR, Gib-
ney CA, Foreman BE, Nelson G, See V, Horton CA,
Spiller DG et al. (2004) Oscillations in NF-kappaB sign-
aling control the dynamics of gene expression. Science
306, 704–708.
13 Wolf J, Passarge J, Somsen OJ, Snoep JL, Heinrich R
& Westerhoff HV (2000) Transduction of intracellular
and intercellular dynamics in yeast glycolytic oscilla-
tions. Biophys J 78, 1145–1153.
14 Richard P, Bakker BM, Teusink B, Van Dam K &
Westerhoff HV (1996) Acetaldehyde mediates the
synchronization of sustained glycolytic oscillations in
populations of yeast cells. Eur J Biochem 235 ,
238–241.
15 Bier M, Bakker BM & Westerhoff HV (2000) How yeast
cells synchronize their glycolytic oscillations: a perturba-
tion analytic treatment. Biophys J 78, 1087–1093.
16 Rosenfeld N, Young JW, Alon U, Swain PS & Elowitz
MB (2005) Gene regulation at the single-cell level.
Science 307, 1962–1965.
17 Friedman N, Vardi S, Ronen M, Alon U & Stavans J
(2005) Precise temporal modulation in the response of
the SOS DNA repair network in individual bacteria.
PLoS Biol 3, e238.
18 Lahav G, Rosenfeld N, Sigal A, Geva-Zatorsky N,
Levine AJ, Elowitz MB & Alon U (2004) Dynamics of
the p53-Mdm2 feedback loop in individual cells. Nat
Genet 36, 147–150.
In vitro analysis of NF-jB signaling pathway A. E. C. Ihekwaba et al.
1688 FEBS Journal 274 (2007) 1678–1690 ª 2007 Pfizer Global Research & Development Journal compilation ª 2007 FEBS
19 Tyson JJ (2004) Monitoring p53¢s pulse. Nat Genet 36,
113–114.
20 Brightman FA & Fell DA (2000) Differential feedback
regulation of the MAPK cascade underlies the quantita-
tive differences in EGF and NGF signalling in PC12
cells. FEBS Lett 482, 169–174.
21 Kholodenko BN (2000) Negative feedback and ultrasen-
sitivity can bring about oscillations in the mitogen-acti-
vated protein kinase cascades. Eur J Biochem 267,
1583–1588.
22 Kitano H (2002) Systems biology: a brief overview.
Science 295, 1662–1664.
23 Kell DB (2005) Metabolomics, machine learning and
modelling: towards an understanding of the language of
cells. Biochem Soc Trans 33, 520–524.
24 Hoffmann A, Natoli G & Ghosh G (2006) Transcrip-
tional regulation via the NF-kappaB signaling module.
Oncogene 25, 6706–6716.
25 Scheidereit C (2006) IkappaB kinase complexes: gate-
ways to NF-kappaB activation and transcription. Onco-
gene 25, 6685–6705.
26 DiDonato JA, Hayakawa M, Rothwarf DM, Zandi E
& Karin M (1997) A cytokine-responsive IkappaB
kinase that activates the transcription factor NF-kap-
paB. Nature 388, 548–554.
27 Mercurio F, Zhu H, Murray BW, Shevchenko A, Ben-
nett BL, Li JW, Young DB, Barbosa M, Mann M,
Manning A et al. (1997) IKK-1 and IKK-2: cytokine-
activated I kappa B kinases essential for NF-kappa B
activation. Science 278, 860–866.
28 Zandi E, Chen Y & Karin M (1998) Direct phosphory-
lation of IkappaB by IKKalpha and IKKbeta: discrimi-
nation between free and NF-kappaB-bound substrate.
Science 281, 1360–1363.
29 Woronicz JD, Gao X, Cao Z, Rothe M & Goeddel DV
(1997) I kappa B kinase-beta: NF-kappa B activation
and complex formation with I kappa B kinase-alpha
and NIK. Science 278, 866–869.
30 Rothwarf DM, Zandi E, Natoli G & Karin M (1998)
IIKK-gamma is an essential regulatory subunit of the
IkappaB kinase complex. Nature 395, 297–300.
31 Li X, Massa PE, Hanidu A, Peet GW, Aro P, Savitt A,
Mische S, Li J & Marcu KB (2002) IKK alpha, IKK
beta, and NEMO ⁄ IKK gamma are each required for
the NF-kappa B-mediated inflammatory response pro-
gram. J Biol Chem 277, 45129–45140.
32 Li J, Peet GW, Balzarano D, Li XN, Massa P, Barton
RW & Marcu KB (2001) Novel NEMO ⁄ I kappa B
kinase and NF-kappa B target genes at the pre-B to
immature B cell transition. J Biol Chem 276, 18579–
18590.
33 Mercurio F, Murray BW, Shevchenko A, Bennett BL,
Young DB, Li JW, Pascual G, Motiwala A, Zhu H,
Mann M et al. (1999) IkappaB kinase (IKK)-associated
protein 1, a common component of the heterogeneous
IKK complex. Mol Cell Biol 19, 1526–1538.
34 Baeuerle PA & Baltimore D (1988) Activation of DNA-
binding activity in an apparently cytoplasmic precursor
of the NF-kappa B transcription factor. Cell 53, 211–217.
35 Tam WF & Sen R (2001) IkappaB family members
function by different mechanisms.
J Biol Chem 276,
7701–7704.
36 Rottenberg S, Schmuckli-Maurer J, Grimm S, Heussler
VT & Dobbelaere DA (2002) Characterization of the
bovine IkappaB kinases (IKK) alpha and IKKbeta, the
regulatory subunit NEMO and their substrate Ikappa-
Balpha. Gene 299, 293–300.
37 Ihekwaba AEC, Broomhead DS, Grimley RL, Benson
N & Kell DB (2004) Sensitivity analysis of parameters
controlling oscillatory signalling in the NF-jB pathway:
the roles of IKK and IjBa. Systems Biol 1, 93–103.
38 Kishore N, Sommers C, Mathialagan S, Guzova J, Yao
M, Hauser S, Huynh K, Bonar S, Mielke C, Albee L
et al. (2003) A selective IKK-2 inhibitor blocks NF-
kappa B-dependent gene expression in interleukin-1
beta-stimulated synovial fibroblasts. J Biol Chem 278,
32861–32871.
39 Nelson DE, Horton CA, See V, Johnson JR, Nelson G,
Spiller DG, Kell DB & White MRH (2005) Response
to comment on ‘oscillations in NF-kappaB signaling con-
trol the dynamics of gene expression’. Science 308, 52.
40 Barken D, Wang CJ, Kearns J, Cheong R, Hoffmann A
& Levchenko A (2005) Comment on ‘Oscillations in
NF-kappaB signaling control the dynamics of gene
expression’. Science 308, 52.
41 Ihekwaba AEC, Broomhead DS, Grimley R, Benson N,
White MRH & Kell DB (2005) Synergistic control of
oscillations in the NF-kappaB signalling pathway. IEE
Systems Biol 152, 153–160.
42 Ghosh S & Baltimore D (1990) Activation in vitro of
NF-kappa B by phosphorylation of its inhibitor Ikappa
B. Nature 344, 678–682.
43 Burke JR, Wood MK, Ryseck RP, Walther S & Meyers
CA (1999) Peptides corresponding to the N and C ter-
mini of IkappaB-alpha-beta, and -epsilon as probes of
the two catalytic subunits of IkappaB kinase, IKK-1
and IKK-2. J Biol Chem 274, 36146–36152.
44 Heilker R, Freuler F, Vanek M, Pulfer R, Kobel T,
Peter J, Zerwes HG, Hofstetter H & Eder J (1999) The
kinetics of association and phosphorylation of IkappaB
isoforms by IkappaB kinase 2 correlate with their cellu-
lar regulation in human endothelial cells. Biochemistry
38, 6231–6238.
45 Li J, Peet GW, Pullen SS, Schembri-King J, Warren
TC, Marcu KB, Kehry MR, Barton R & Jakes S (1998)
Recombinant IkappaB kinases alpha and beta are direct
kinases of Ikappa Balpha. J Biol Chem 273, 30736–
30741.
A. E. C. Ihekwaba et al. In vitro analysis of NF-jB signaling pathway
FEBS Journal 274 (2007) 1678–1690 ª 2007 Pfizer Global Research & Development Journal compilation ª 2007 FEBS 1689
46 Peet GW & Li J (1999) IkappaB kinases alpha and beta
show a random sequential kinetic mechanism and are
inhibited by staurosporine and quercetin. J Biol Chem
274, 32655–32661.
47 Wisniewski D, LoGrasso P, Calaycay J & Marcy A
(1999) Assay for IkappaB kinases using an in vivo bioti-
nylated IkappaB protein substrate. Anal Biochem 274,
220–228.
48 Burke JR, Miller KR, Wood MK & Meyers CA (1998)
The multisubunit IkappaB kinase complex shows
random sequential kinetics and is activated by the
C-terminal domain of IkappaB alpha. J Biol Chem 273,
12041–12046.
49 Huynh QK, Boddupalli H, Rouw SA, Koboldt CM,
Hall T, Sommers C, Hauser SD, Pierce JL, Combs RG,
Reitz BA et al. (2000) Characterization of the recombin-
ant IKK1 ⁄ IKK2 heterodimer: mechanisms regulating
kinase activity. J Biol Chem 275, 25883–25891.
50 Huynh QK, Kishore N, Mathialagan S, Donnelly AM
& Tripp CS (2002) Kinetic mechanisms of IkappaB-
related kinases (IKK) inducible IKK and TBK-1 differ
from IKK-1 ⁄ IKK-2 heterodimer. J Biol Chem 277,
12550–12558.
51 Kishore N, Huynh QK, Mathialagan S, Hall T, Rouw
S, Creely D, Lange G, Caroll J, Reitz B, Donnelly A
et al. (2002) IKK-i and TBK-1 are enzymatically dis-
tinct from the homologous enzyme IKK-2: comparative
analysis of recombinant human IKK-i, TBK-1, and
IKK-2. J Biol Chem 277, 13840–13847.
52 Lipniacki T, Paszek P, Brasier AR, Luxon B & Kimmel
M (2004) Mathematical model of NF-kappaB regula-
tory module. J Theor Biol 228, 195–215.
53 Bonafoux D, Bonar S, Christine L, Clare M, Donnelly
A, Guzova J, Kishore N, Lennon P, Libby A, Mathiala-
gan S et al. (2005) Inhibition of IKK-2 by 2-[(aminocar-
bonyl) amino]-5-acetylenyl-3-thiophenecarboxamides.
Bioorg Med Chem Lett 15, 2870–2875.
54 Baxter A, Brough S, Cooper A, Floettmann E, Foster
S, Harding C, Kettle J, McInally T, Martin C,
Mobbs M et al. (2004) Hit-to-lead studies: the discov-
ery of potent, orally active, thiophenecarboxamide
IKK-2 inhibitors. Bioorg Med Chem Lett 14, 2817–
2822.
55 Sasaki CY, Barberi TJ, Ghosh P & Longo DL (2005)
Phosphorylation of RelA ⁄ p65 on serine 536 defines an
I{kappa}B{alpha}-independent NF-{kappa}B pathway.
J Biol Chem 280, 34538–34547.
56 Small JR & Kacser H (1993) Responses of metabolic
systems to large changes in enzyme activities and
effectors. 2. The linear treatment of branched path-
ways and metabolite concentrations. Assessment of
the general non-linear case. Eur J Biochem 213,
625–640.
57 Small JR & Kacser H (1993) Responses of metabolic
systems to large changes in enzyme activities and effec-
tors. 1. The linear treatment of unbranched chains. Eur
J Biochem 213, 613–624.
58 Andre R, Pinteaux E, Kimber I & Rothwell NJ (2005)
Differential actions of IL-1 alpha and IL-1 beta in glial
cells share common IL-1 signalling pathways. Neurore-
port 16, 153–157.
59 Segel IH (1993) Enzyme Kinetics: Behavior and Analysis
of Rapid Equilibrium and Steady-State Enzyme Systems.
Wiley-Interscience, New York, NY.
In vitro analysis of NF-jB signaling pathway A. E. C. Ihekwaba et al.
1690 FEBS Journal 274 (2007) 1678–1690 ª 2007 Pfizer Global Research & Development Journal compilation ª 2007 FEBS